MMR
Download script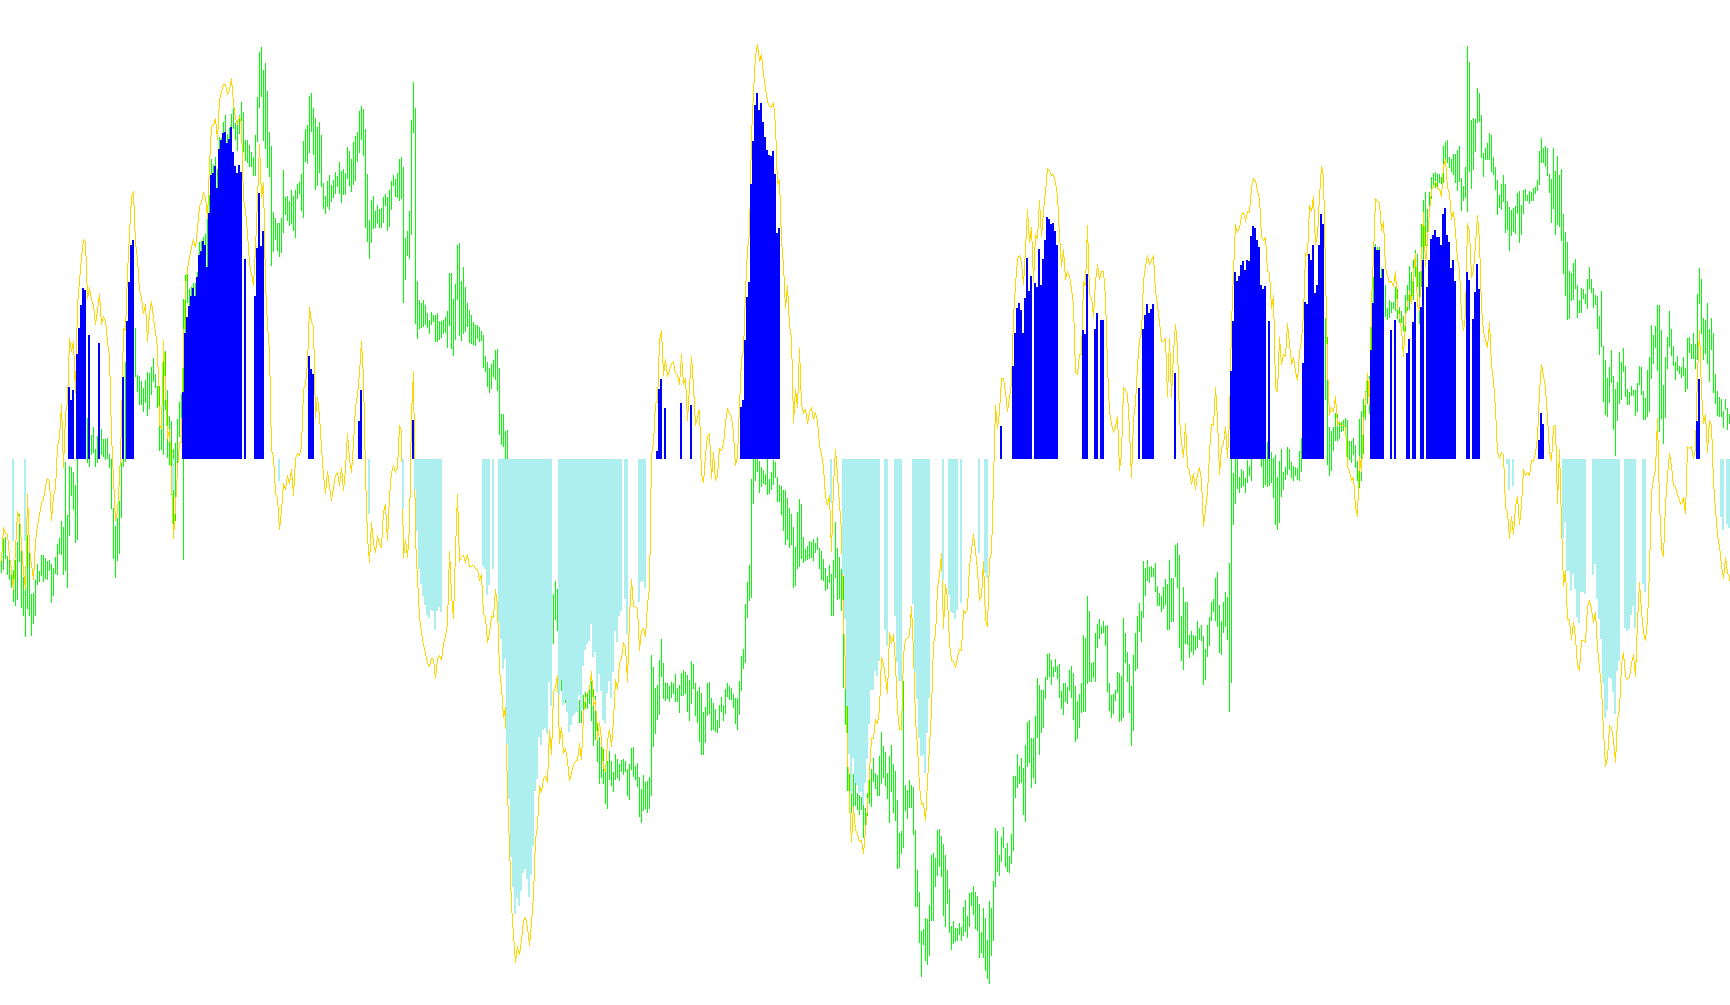
This trading indicator is designed to identify high-probability market trends by combining three distinct types of technical analysis: trend direction, momentum, and price strength. By synthesizing these elements into a single visual display, the script helps traders filter out market "noise" and focus on clear moves.
Core Components of the Logic
The tool operates by tracking four primary data points simultaneously:
- Moving Averages (Trend Identification): The script compares two different types of moving averages—a fast-responding average and a slower, smoothed average. By looking at where these two lines cross or sit in relation to one another, the tool determines the broader direction of the market.
- Relative Strength Index (RSI): This measures the speed and change of price movements. It helps the script understand if an asset is becoming overbought, oversold, or if it has enough "strength" to continue its current move.
- MACD (Momentum Analysis): The MACD provides insight into the momentum of the market. It confirms whether the current price movement is gaining speed or losing steam.
How the Signals are Generated
The script doesn't just look at one indicator; it requires a "consensus" from all three sources before identifying a potential trade. Here is how it processes those signals:
Bullish (Long) Opportunities: For a positive signal to appear, the script looks for three conditions to be met at once:
- The fast moving average must be positioned above the slow moving average.
- The RSI must show significant upward strength.
- The MACD must be in positive territory.
Bearish (Short) Opportunities: Conversely, for a negative signal to appear, it looks for three opposing conditions:
- The fast moving average must drop below the slow moving average.
- The RSI must show significant downward weakness.
- The MACD must be in negative territory.
Visual Representation
The indicator simplifies this complex math into a single visual window. It calculates a combined value based on the distance between the moving averages, the current momentum (MACD), and the price strength (RSI).
While the primary line shows the overall trend flow, the script also generates specific visual "histograms." These highlights appear only when all three conditions for a Long or Short trade are perfectly aligned, providing a clear "green light" or "red light" for the user based on the combined mathematical agreement of the indicators.
//+------------------------------------------------------------------+
//|                                                          MMR.mq4 |
//|                                  Based on a strategy by cmillion |
//|             EMA5+LWMA85 crossover with MACD and RSI confirmation |
//+------------------------------------------------------------------+
#property copyright "Copyright @ 2011, downspin"
#property link      "mg@downspin.de"

int deinit(){return(0);}
#property indicator_separate_window
#property indicator_buffers 3
#property indicator_color1 DodgerBlue
#property indicator_color2 Green
#property indicator_color3 Red
#property indicator_level1 0
#property indicator_levelcolor DarkSlateGray

extern int mac_fast_ma=12,
           mac_slow_ma=26,
           mac_signal=9,
           rsi_period=14,
           ema_period=5,
           lwma_period=85;

double long1[],
       short1[],
       val[];

int init(){
  SetIndexStyle(0,DRAW_LINE); SetIndexBuffer(0,val);
  SetIndexStyle(1,DRAW_HISTOGRAM,EMPTY,5); SetIndexBuffer(1,long1);
  SetIndexStyle(2,DRAW_HISTOGRAM,EMPTY,5); SetIndexBuffer(2,short1);
  return(0);
}

int start(){
  double ema,lwma,rsi,mac;
  for(int i=0;i<Bars-IndicatorCounted();i++){
    ema=iMA(Symbol(),0,ema_period,0,1,0,i);
    lwma=iMA(Symbol(),0,lwma_period,0,3,0,i);
    rsi=iRSI(Symbol(),0,rsi_period,0,i);
    mac=iMACD(Symbol(),0,mac_fast_ma,mac_slow_ma,mac_signal,0,0,i);
    mac*=3000;
    rsi-=50;
    val[i]=(ema-lwma)/(Point*10)+mac+rsi;
    if((ema>lwma)&&(rsi>10)&&(mac>0)){
      long1[i]=val[i]-10;
    }
    if((ema<lwma)&&(rsi<-10)&&(mac<0)){
      short1[i]=val[i]+10;
    }
  }
  return(0);
}
Comments