NRTR WATR_v1
Download script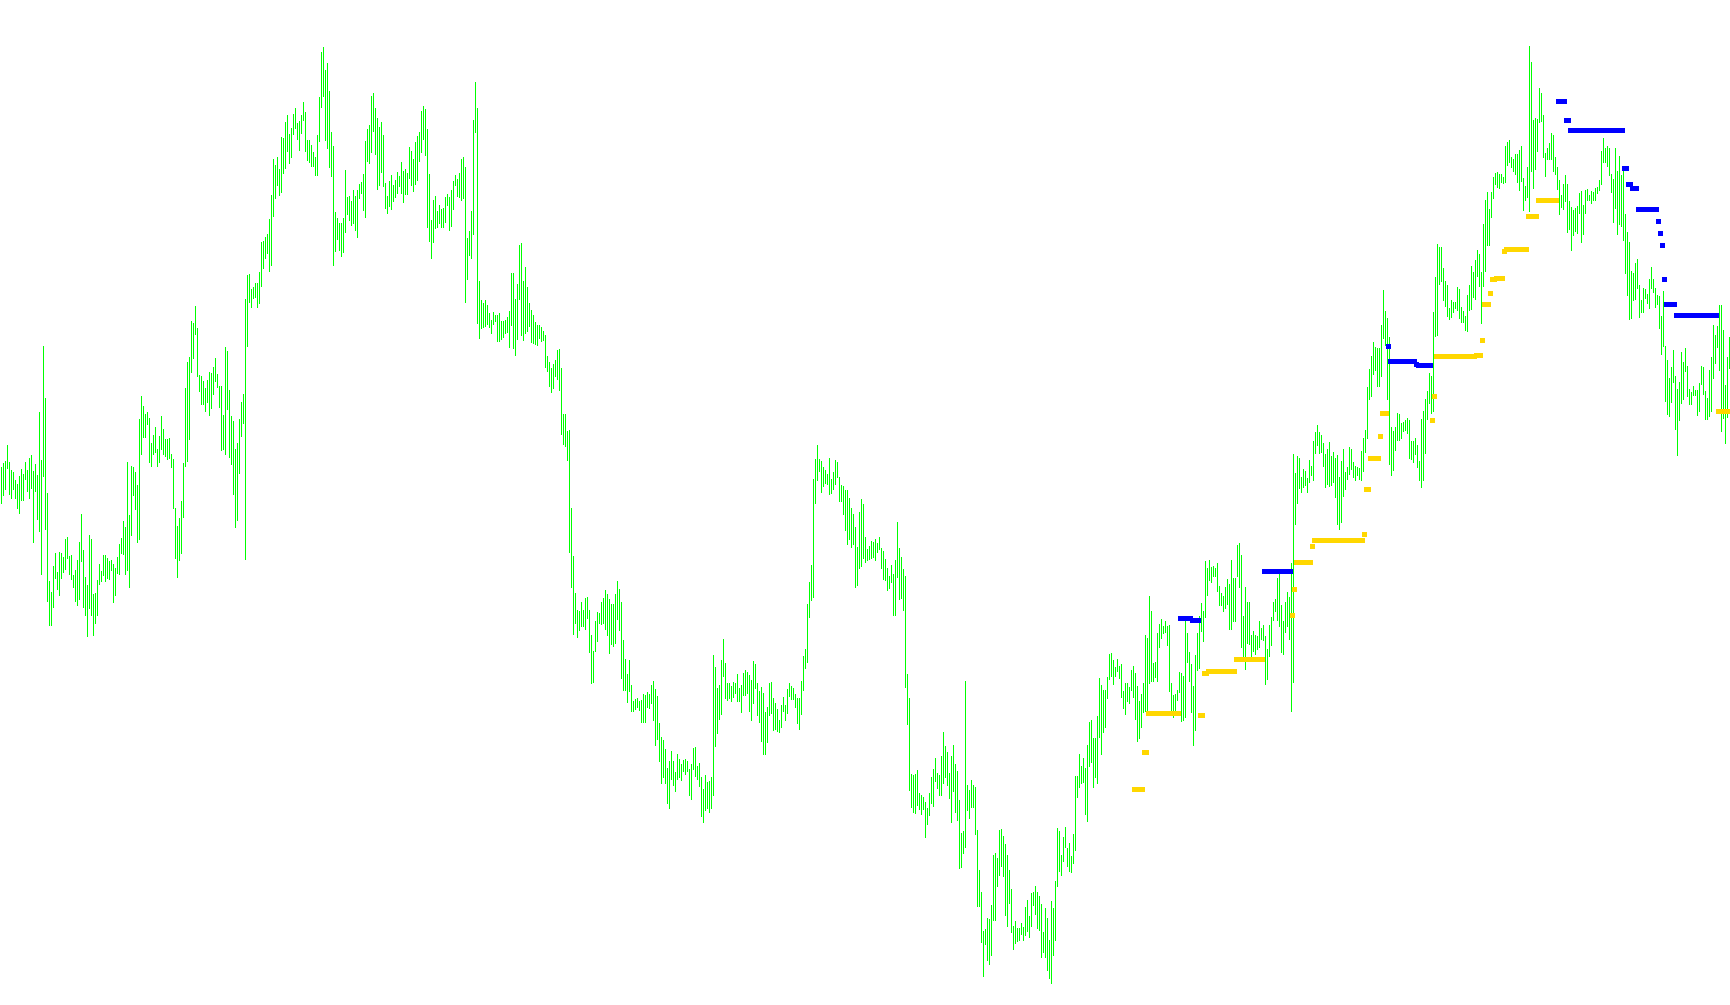
This script functions as a technical analysis tool designed to identify and visualize market trends by calculating price volatility and "trailing" momentum. Unlike standard indicators that simply follow the price, this logic attempts to determine when a trend has structurally shifted based on the relationship between recent price action and historical volatility.
Core Logic Overview
The script operates through three primary stages: Volatility Calculation, Trend Identification, and Dynamic Trailing.
1. Volatility Measurement (WATR) The foundation of this tool is a custom volatility metric (referred to in the code as WATR). Instead of looking at simple averages, the script analyzes a specific number of previous bars to determine the "range" or intensity of price movements.
- It applies a weighting system where more recent price movements are given more importance than older ones.
- Depending on your settings (Variants), it can calculate this volatility based on a fixed historical window or a rolling window relative to specific bar counts.
- The script even includes specific adjustments for certain currency pairs (like JPY pairs) to ensure the volatility scale remains consistent across different market types.
2. Trend Detection Once the volatility is established, the script looks at the current price movement to decide the initial direction of the trend:
- If the price closes higher than it opened, it establishes an upward trend.
- If the price closes lower than it opened, it establishes a downward trend.
3. The "Trailing" Mechanism This is the most sophisticated part of the logic. Rather than just marking a trend as "up" or "down," the script creates a dynamic threshold that moves with the price:
- In an Upward Trend: The script tracks the highest price reached. It then calculates a "buffer zone" based on the volatility metric. A trend is only considered broken if the price falls significantly below this buffer, rather than just dropping by a few pips.
- In a Downward Trend: Conversely, it tracks the lowest price reached and sets a buffer below it. The trend only flips if the price rises significantly above that buffered low.
Visual Output
The results of this logic are displayed as visual markers (arrows) on your chart:
- Blue Markers: Represent the identification of an active upward trend.
- Red Markers: Represent the identification of an active downward trend.
By using this "buffer" approach, the tool aims to filter out "noise"—small, insignificant price fluctuations—and only signal a change when the market shows a meaningful shift in momentum relative to its recent volatility.
/*-----------------------------+
|			       |
| Shared by www.Aptrafx.com    |
|			       |
+------------------------------*/

//+------------------------------------------------------------------+
//|                                                    NRTR WATR.mq4 |
//|                                                                  |
//|                                        Ramdass - Conversion only |
//+------------------------------------------------------------------+

#property indicator_chart_window
#property indicator_buffers 2
#property indicator_color1 Blue
#property indicator_color2 Red
//---- input parameters
extern int AveragePeriod=10;
extern int Variant=2;
extern int CountBars=300;

//---- buffers
double value1[];
double value2[];
//+------------------------------------------------------------------+
//| Custom indicator initialization function                         |
//+------------------------------------------------------------------+
int init()
  {

//---- indicator line
   IndicatorBuffers(2);
   SetIndexStyle(0,DRAW_ARROW);
   SetIndexArrow(0,167);
   SetIndexStyle(1,DRAW_ARROW);
   SetIndexArrow(1,167);
   SetIndexBuffer(0,value1);
   SetIndexBuffer(1,value2);
//----
//----
   return(0);
  }
//+------------------------------------------------------------------+
//| NRTR WATR                                                        |
//+------------------------------------------------------------------+
int start()
  {
   if (CountBars>=Bars) CountBars=Bars - AveragePeriod - 2;
//   CountBars = CountBars - AveragePeriod - 3;
   SetIndexDrawBegin(0,Bars-CountBars+1);
   SetIndexDrawBegin(1,Bars-CountBars+1);
   int i,i2,bar,counted_bars=IndicatorCounted();
   double value,WATR;
   double trend=1,dK,AvgRange,price,AveragePeriod_D;
   AveragePeriod_D=AveragePeriod;
//----
   if(Bars<=AveragePeriod) return(0);
//---- initial zero
   if(counted_bars<1)
   {
      for(i=1;i<=AveragePeriod;i++) value1[Bars-i]=0.0;
      for(i=1;i<=AveragePeriod;i++) value2[Bars-i]=0.0;
   }
AvgRange=0;

if ((Variant == 2) || (Variant == 3))
   {
   for (i=AveragePeriod; i>=1; i--)
       {
       dK = 1+(AveragePeriod_D-i)/AveragePeriod_D;
       AvgRange=AvgRange + dK*MathAbs(High[i]-Low[i]);
       }
   if (Symbol()=="USDJPY" || Symbol()=="GBPJPY" || Symbol()=="EURJPY")
   {WATR = AvgRange/AveragePeriod_D/100;}
   else
   {WATR = AvgRange/AveragePeriod_D;}
   }


if (Variant == 1)
   {
   for (i=1; i<=AveragePeriod; i++)
       {
       dK = 1+(AveragePeriod_D-i)/AveragePeriod_D;
       AvgRange=AvgRange + dK*MathAbs(High[CountBars + i]-Low[CountBars + i]);
       }
   WATR = AvgRange/AveragePeriod_D;
   }

if (Close[CountBars-1] > Open[CountBars-1])
   {
   value1[CountBars - 1] = Close[CountBars - 1] * (1 - WATR);
   trend = 1; value2[CountBars - 1] = 0.0;
   }

if (Close[CountBars-1] < Open[CountBars-1])
   {
   value2[CountBars - 1] = Close[CountBars - 1] * (1 + WATR);
   trend = -1; value1[CountBars - 1] = 0.0;
   }

//----
   bar=CountBars;
   while(bar>=0)
     {
value1[bar]=0.0; value2[bar]=0.0;

    if (Variant == 3)
    {
        AvgRange=0;
        for (i=1; i<=AveragePeriod; i++)
            {
            dK = 1+(AveragePeriod_D-i)/AveragePeriod_D;
            AvgRange=AvgRange+ dK*MathAbs(High[bar + i]-Low[bar + i]);
            }
        WATR = AvgRange/AveragePeriod_D;
    }
    if (trend == 1)
      {
       if (Close[bar] > price) price = Close[bar];
       value = price * (1 - WATR);
       if (Close[bar] < value)
         {
          price = Close[bar];
          value = price * (1 + WATR);
          trend = -1;
          }
       }
    if (trend == -1)
      {
       if (Close[bar] < price) price = Close[bar];
       value = price * (1 + WATR);
       if (Close[bar] > value)
          {
          price = Close[bar];
          value = price * (1 - WATR);
          trend = 1;
          }
       }

if (trend == 1)  {value1[bar]=value; value2[bar]=0.0;}
if (trend == -1)  {value2[bar]=value; value1[bar]=0.0;}

      bar--;
     }
   return(0);
  }
//+------------------------------------------------------------------+
Comments