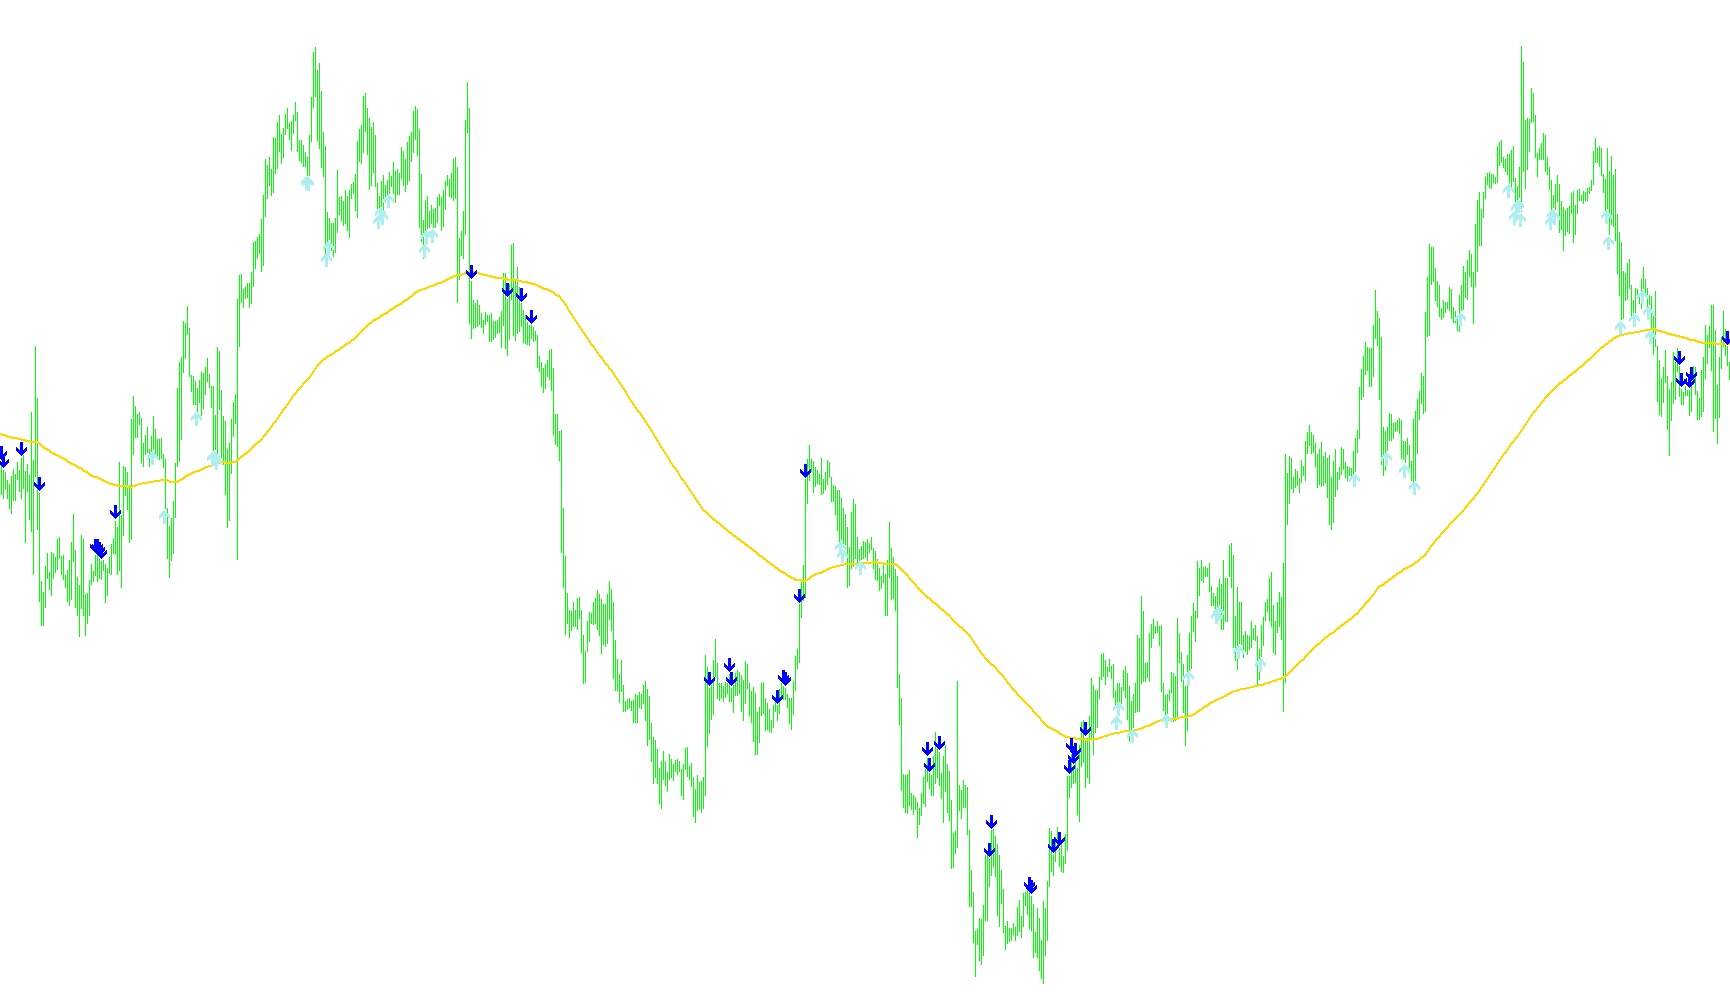
This trading indicator is designed to identify potential trend-reversal opportunities by combining long-term trend filtering with short-term momentum analysis. It automates the detection of specific price actions and signals "Buy" or "Sell" opportunities using visual arrows on the chart.
Core Logic Overview
The script operates on a dual-layered logic system: it first establishes the overarching market direction and then looks for specific rhythmic movements in price momentum to trigger a signal.
1. Trend Identification (The Filter)
The indicator uses a Moving Average to determine the primary trend of the market. By calculating this average over a significant number of periods, the script identifies whether the current price is generally moving above or below the established trend line. This acts as a "filter" to ensure that signals are aligned with the broader market context.
2. Momentum Analysis (The Signal)
To find specific entry points, the script monitors the RSI (Relative Strength Index), which measures the speed and change of price movements. Unlike standard RSI setups that look for overbought or oversold conditions in isolation, this logic focuses on a three-day sequential progression:
- For Sell Signals: The script looks for a specific "rising" momentum sequence. It checks if the price has closed below the trend line and verifies that the momentum (RSI) has increased steadily over three consecutive periods. Furthermore, it ensures that the starting point of this momentum was already above a certain high threshold.
- For Buy Signals: The script looks for a "falling" momentum sequence. It checks if the price has closed above the trend line and verifies that the momentum (RSI) has decreased steadily over three consecutive periods. It also ensures that the starting point of this momentum was already below a certain low threshold.
Visual Outputs
When the mathematical conditions for both the trend filter and the three-day momentum sequence are met simultaneously, the script places visual markers on the chart:
- Sell Arrows: These appear above the high of a candle when the downward momentum criteria are satisfied.
- Buy Arrows: These appear below the low of a candle when the upward momentum criteria are satisfied.
Summary for the User
In simple terms, this tool doesn't just tell you when a price is "high" or "low." Instead, it waits for the market to show a specific pattern: a confirmation that the price is on one side of the major trend, followed by a consistent, multi-day "staircase" movement in momentum. This helps filter out market noise and highlights moments where the momentum is moving decisively in a specific direction.
//+------------------------------------------------------------------+
//|                                                R2_Arrows_v4a.mq4 |
//|           Copyright © 2007 , transport_david , David W Honeywell |
//|                                     hellonwheels.trans@gmail.com |
//+------------------------------------------------------------------+

#property copyright "Copyright © 2007 , transport_david , David W Honeywell"
#property link      "hellonwheels.trans@gmail.com"

#property indicator_chart_window

#property indicator_buffers 3

#property indicator_color1 DeepSkyBlue
#property indicator_color2 Coral
#property indicator_color3 White


extern string s1 = "---------------";
extern int    Ma_Periods          =     200;
extern int    Ma_Type             =       1;
extern int    Ma_Applied_Price    =       0;

extern string s2 = "---------------";
extern int    RsiPeriods          =       4;
extern int    Rsi_Applied_Price   =       1;

extern string s3 = "---------------";
extern int    BuyIfDay1RsiBelow   =      65; // 1st day of tracking must be < this setting
extern int    BuyIfDay3RsiBelow   =      65; // 3rd day must be < this setting

extern string s4 = "---------------";
extern int    SellIfDay1RsiAbove  =      35; // 1st day of tracking must be > this setting
extern int    SellIfDay3RsiAbove  =      35; // 3rd day must be > this setting

extern string s5 = "---------------";
extern int    ShowBars            =   1000;

double Trend_Ma[];
double Sell_Arrow[];
double Buy_Arrow[];
double Close_Trade_Marker[];

double prevtime;

//+-------------+
//| Init        |
//+-------------+
int init()
  {
   IndicatorBuffers(5);

   SetIndexStyle(0,DRAW_LINE,STYLE_SOLID,2);
   SetIndexEmptyValue(0,0.0);
   SetIndexBuffer(0,Trend_Ma);
   SetIndexLabel(0,"Trend_Ma_Periods ( "+Ma_Periods+" )");

   SetIndexEmptyValue(1,0.0);
   SetIndexStyle(1,DRAW_ARROW,STYLE_SOLID,1);
   SetIndexArrow(1,234);
   SetIndexBuffer(1,Sell_Arrow);
   SetIndexLabel(1,"Sell_Arrow ( RsiPeriods "+RsiPeriods+" )");

   SetIndexEmptyValue(2,0.0);
   SetIndexStyle(2,DRAW_ARROW,STYLE_SOLID,1);
   SetIndexArrow(2,233);
   SetIndexBuffer(2,Buy_Arrow);
   SetIndexLabel(2,"Buy_Arrow ( RsiPeriods "+RsiPeriods+" )");

   Print("Init complete");
  }


//+-------------+
//| De-init     |
//+-------------+
int deinit()
  {
   Print("De-init complete");
  }

//+-------------+
//| Start       |
//+-------------+
int start()
  {

   double    Day1;
   double    Day2;
   double    Day3;
   double    Today;

   int       shift;

     for ( shift = ShowBars; shift >= 0; shift-- )
      {

       Trend_Ma[shift] = iMA( Symbol(), 0, Ma_Periods, 0, Ma_Type, Ma_Applied_Price, shift);

       if (prevtime != Time[0]) { RefreshRates(); prevtime=Time[0]; }

       Day1 = iRSI(Symbol(),0,RsiPeriods,Rsi_Applied_Price,shift+3);
       Day2 = iRSI(Symbol(),0,RsiPeriods,Rsi_Applied_Price,shift+2);
       Day3 = iRSI(Symbol(),0,RsiPeriods,Rsi_Applied_Price,shift+1);
       Today = iRSI(Symbol(),0,RsiPeriods,Rsi_Applied_Price,shift);

       //- Sell Arrows ---

       if ( (iClose(Symbol(),0,shift+1) < Trend_Ma[shift+1]) && (Day1 > SellIfDay1RsiAbove) && (Day2 > Day1) && (Day3 > Day2) && (Day3 > SellIfDay3RsiAbove) )

          Sell_Arrow[shift] = iHigh(Symbol(),0,shift) + (20*Point); // High arrow Sell

       //- Buy Arrows ---

       if ( (iClose(Symbol(),0,shift+1) > Trend_Ma[shift+1]) && (Day1 < BuyIfDay1RsiBelow) && (Day2 < Day1) && (Day3 < Day2) && (Day3 < BuyIfDay3RsiBelow) )

          Buy_Arrow[shift] = iLow(Symbol(),0,shift) - (20*Point); // Low arrow Buy

      }

  }
Comments