R2_Arrows_v4a
Download script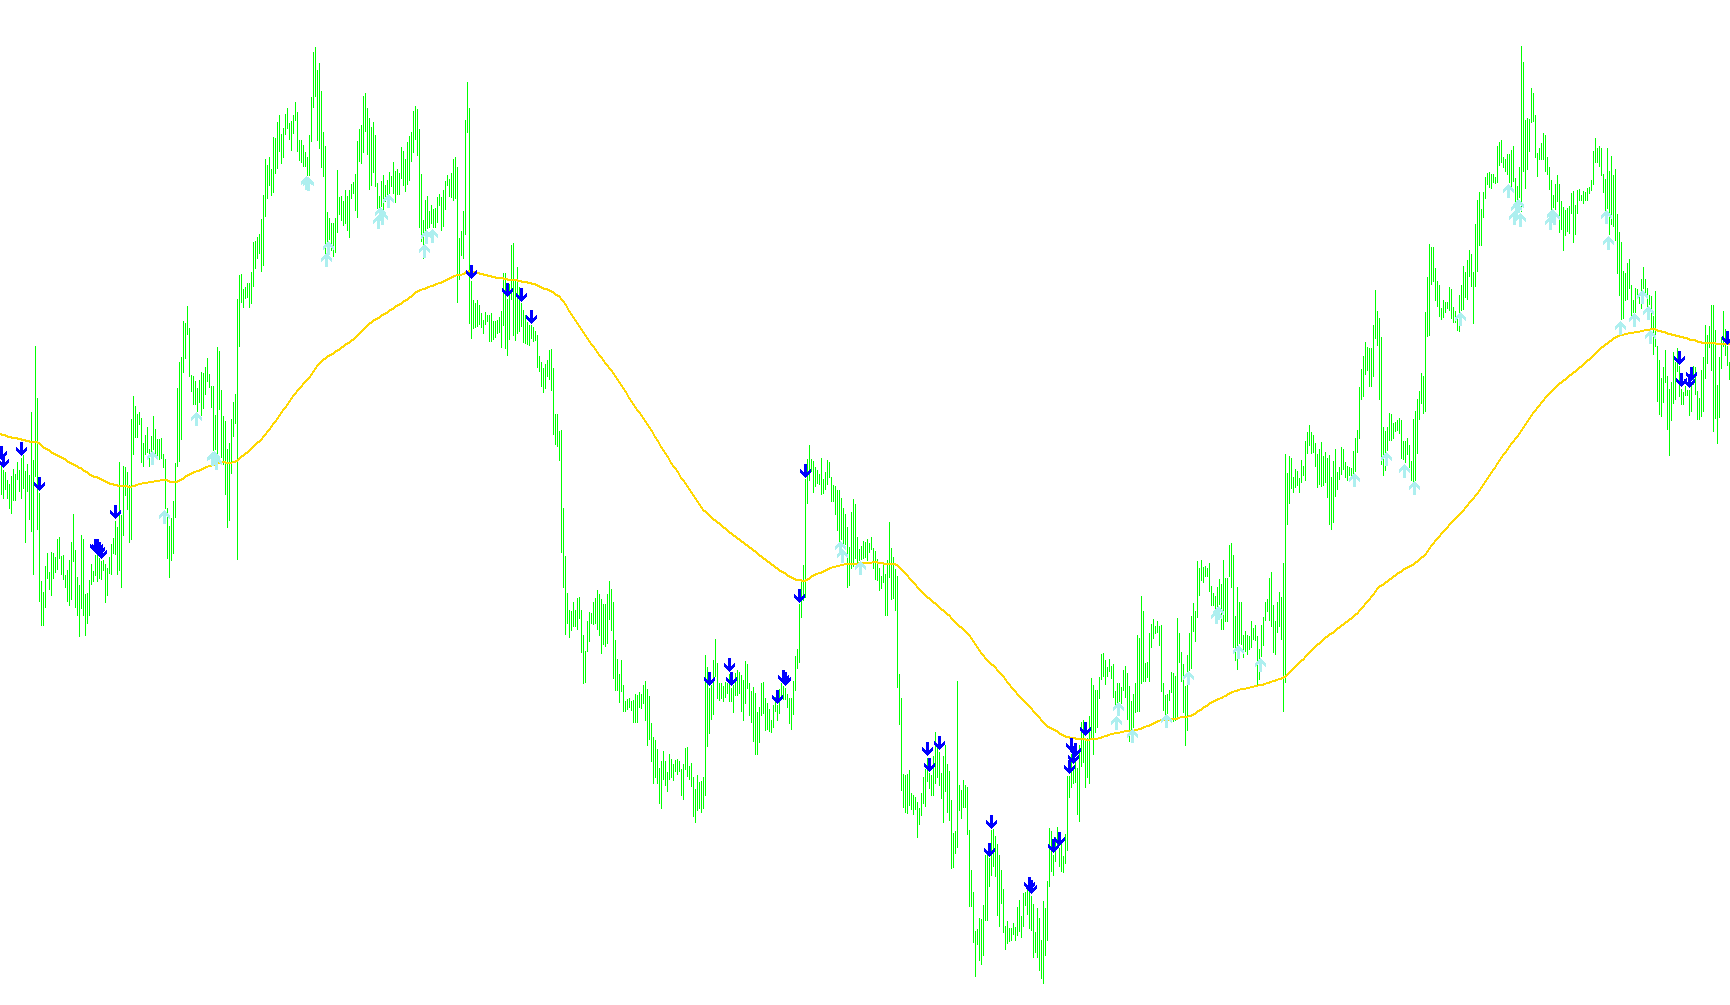
This script is a technical analysis tool designed for the MetaTrader 4 platform. Its primary purpose is to identify potential entry points in the market by visualizing "Buy" and "Sell" signals directly on a price chart using arrows. The logic relies on a combination of trend identification (moving averages) and momentum tracking (Relative Strength Index).
Core Logic Overview
The script functions by analyzing two main components: the overall direction of the market and the immediate velocity of price movements.
1. Trend Identification (The Foundation) Before looking for signals, the script determines the current "path" of the market. It uses a Moving Average—a calculation that smooths out price fluctuations to reveal a clearer trend line.
- Users can choose between a standard Moving Average or a more specialized "Hull" moving average.
- The script compares the current closing price against this trend line to see if the price is currently trading above (potentially bullish) or below (potentially bearish) the established trend.
2. Momentum Analysis (The Trigger) To filter out "fake" movements, the script looks at a momentum indicator called the RSI (Relative Strength Index). It specifically looks at a sequence of four consecutive data points to identify a specific pattern of acceleration.
- For Sell Signals: The script looks for a situation where the price is below the trend line and the RSI values are steadily increasing across three previous steps, while remaining above a specific threshold. This suggests that while the overall trend might be down, there is an active upward "push" or exhaustion point being detected.
- For Buy Signals: Conversely, it looks for situations where the price is above the trend line and the RSI values are steadily decreasing across three previous steps, while remaining below a specific threshold. This indicates a downward "pull" or momentum shift within a larger upward trend.
Visual Outputs
- Trend Line: A visual representation of the moving average used to determine the market's primary direction.
- Buy Arrows: These appear below the price candles when the criteria for an upward momentum entry are met.
- Sell Arrows: These appear above the price candles when the criteria for a downward momentum entry are met.
Summary of Operation
In simple terms, the script ignores "noise" by only showing arrows when the market's current momentum (RSI) aligns with specific historical behaviors relative to its primary trend line (Moving Average). It waits for a specific sequence of three consecutive movements to confirm that a price shift is gaining enough strength to warrant a visual signal on the chart.
//+------------------------------------------------------------------+
//|                                                R2_Arrows_v4a.mq4 |
//|           Copyright © 2007 , transport_david , David W Honeywell |
//|                                     hellonwheels.trans@gmail.com |
//+------------------------------------------------------------------+

#property copyright "Copyright © 2007 , transport_david , David W Honeywell"
#property link      "hellonwheels.trans@gmail.com"

#property indicator_chart_window

#property indicator_buffers 4

#property indicator_color1 DeepSkyBlue
#property indicator_color2 Coral
#property indicator_color3 White
#property indicator_color4 SlateGray

extern bool   Use_Hull            =   false;

extern string s1 = "---------------";
extern int    Ma_Periods          =     200;
extern int    Ma_Type_if_not_Hull =       1; // only if Use_Hull = false
extern int    Ma_Applied_Price    =       0;

extern string s2 = "---------------";
extern int    RsiPeriods          =       4;
extern int    Rsi_Applied_Price   =       1;

extern string s3 = "---------------";
extern int    BuyIfDay1RsiBelow   =      65; // 1st day of tracking must be < this setting
extern int    BuyIfDay3RsiBelow   =      65; // 3rd day must be < this setting

extern string s4 = "---------------";
extern int    SellIfDay1RsiAbove  =      35; // 1st day of tracking must be > this setting
extern int    SellIfDay3RsiAbove  =      35; // 3rd day must be > this setting

extern string s5 = "---------------";
extern int    CloseBuyIfRsiAbove  =      75;
extern int    CloseSellIfRsiBelow =      25;

extern string s6 = "---------------";
extern int    ShowBars            =   1000;

double Trend_Ma[];
double Sell_Arrow[];
double Buy_Arrow[];
double Close_Trade_Marker[];
double Calc[];

double prevtime;

//+------------------------------------------------------------------+
//| Custom indicator initialization function                         |
//+------------------------------------------------------------------+
int init()
  {
//---- indicators

   IndicatorBuffers(5);

   SetIndexStyle(0,DRAW_LINE,STYLE_SOLID,2);
   SetIndexEmptyValue(0,0.0);
   SetIndexBuffer(0,Trend_Ma);
   SetIndexLabel(0,"Trend_Ma_Periods ( "+Ma_Periods+" )");

   SetIndexEmptyValue(1,0.0);
   SetIndexStyle(1,DRAW_ARROW,STYLE_SOLID,1);
   SetIndexArrow(1,234);
   SetIndexBuffer(1,Sell_Arrow);
   SetIndexLabel(1,"Sell_Arrow ( RsiPeriods "+RsiPeriods+" )");

   SetIndexEmptyValue(2,0.0);
   SetIndexStyle(2,DRAW_ARROW,STYLE_SOLID,1);
   SetIndexArrow(2,233);
   SetIndexBuffer(2,Buy_Arrow);
   SetIndexLabel(2,"Buy_Arrow ( RsiPeriods "+RsiPeriods+" )");

   SetIndexEmptyValue(3,0.0);
   SetIndexStyle(3,DRAW_ARROW,STYLE_SOLID,2);
   SetIndexArrow(3,172);
   SetIndexBuffer(3,Close_Trade_Marker);
   SetIndexLabel(3,"Close_Trade_Marker");

   SetIndexEmptyValue(4,0.0);
   SetIndexBuffer(4,Calc);

//----
   return(0);
  }
//+------------------------------------------------------------------+
//| Custom indicator deinitialization function                       |
//+------------------------------------------------------------------+
int deinit()
  {
//----

//----
   return(0);
  }
//+------------------------------------------------------------------+
//| Custom indicator iteration function                              |
//+------------------------------------------------------------------+
int start()
  {
//----
   int shift = ShowBars;

   if (ShowBars > Bars) ShowBars = Bars;

   for ( shift = ShowBars; shift >= 0; shift-- )
    {

      double Exp = 2;

      double firstwma = iMA(Symbol(),0,MathFloor(Ma_Periods/2),0,MODE_LWMA,Ma_Applied_Price,shift);

      double secondwma = iMA(Symbol(),0,Ma_Periods,0,MODE_LWMA,Ma_Applied_Price,shift);

      Calc[shift] = (Exp*firstwma)-secondwma;

    }
   if (Use_Hull)
    {
     for ( shift = ShowBars; shift >= 0; shift-- )
      {

       Trend_Ma[shift] = iMAOnArray(Calc,0,MathFloor(MathSqrt(Ma_Periods)),0,MODE_LWMA,shift);

       if (prevtime != Time[0]) { RefreshRates(); prevtime=Time[0]; }

       double Day1 = iRSI(Symbol(),0,RsiPeriods,Rsi_Applied_Price,shift+3);
       double Day2 = iRSI(Symbol(),0,RsiPeriods,Rsi_Applied_Price,shift+2);
       double Day3 = iRSI(Symbol(),0,RsiPeriods,Rsi_Applied_Price,shift+1);
       double Today = iRSI(Symbol(),0,RsiPeriods,Rsi_Applied_Price,shift);

       //- Sell Arrows ---

       if ( (iClose(Symbol(),0,shift+1) < Trend_Ma[shift+1]) && (Day1 > SellIfDay1RsiAbove) && (Day2 > Day1) && (Day3 > Day2) && (Day3 > SellIfDay3RsiAbove) )

          Sell_Arrow[shift] = iHigh(Symbol(),0,shift) + (20*Point);//High arrow Sell

       //- Buy Arrows ---

       if ( (iClose(Symbol(),0,shift+1) > Trend_Ma[shift+1]) && (Day1 < BuyIfDay1RsiBelow) && (Day2 < Day1) && (Day3 < Day2) && (Day3 < BuyIfDay3RsiBelow) )

          Buy_Arrow[shift] = iLow(Symbol(),0,shift) - (20*Point);//Low arrow Buy

       //- Close Trades Marker ---

       //if (Today < CloseSellIfRsiBelow)

       //   Close_Trade_Marker[shift] = iLow(Symbol(),0,shift) - (50*Point);

       //if (Today > CloseBuyIfRsiAbove)

       //   Close_Trade_Marker[shift] = iHigh(Symbol(),0,shift) + (50*Point);

      }
      return(0);
    }

   if (!Use_Hull)
    {
     for ( shift = ShowBars; shift >= 0; shift-- )
      {

       Trend_Ma[shift] = iMA( Symbol(), 0, Ma_Periods, 0, Ma_Type_if_not_Hull, Ma_Applied_Price, shift);

       if (prevtime != Time[0]) { RefreshRates(); prevtime=Time[0]; }

       Day1 = iRSI(Symbol(),0,RsiPeriods,Rsi_Applied_Price,shift+3);
       Day2 = iRSI(Symbol(),0,RsiPeriods,Rsi_Applied_Price,shift+2);
       Day3 = iRSI(Symbol(),0,RsiPeriods,Rsi_Applied_Price,shift+1);
       Today = iRSI(Symbol(),0,RsiPeriods,Rsi_Applied_Price,shift);

       //- Sell Arrows ---

       if ( (iClose(Symbol(),0,shift+1) < Trend_Ma[shift+1]) && (Day1 > SellIfDay1RsiAbove) && (Day2 > Day1) && (Day3 > Day2) && (Day3 > SellIfDay3RsiAbove) )

          Sell_Arrow[shift] = iHigh(Symbol(),0,shift) + (20*Point); // High arrow Sell

       //- Buy Arrows ---

       if ( (iClose(Symbol(),0,shift+1) > Trend_Ma[shift+1]) && (Day1 < BuyIfDay1RsiBelow) && (Day2 < Day1) && (Day3 < Day2) && (Day3 < BuyIfDay3RsiBelow) )

          Buy_Arrow[shift] = iLow(Symbol(),0,shift) - (20*Point); // Low arrow Buy

       //- Close Trades Marker ---

       //if (Today < CloseSellIfRsiBelow)

       //   Close_Trade_Marker[shift] = iLow(Symbol(),0,shift) - (50*Point);

       //if (Today > CloseBuyIfRsiAbove)

       //   Close_Trade_Marker[shift] = iHigh(Symbol(),0,shift) + (50*Point);

      }
      return(0);
    }

//----
   return(0);
  }
//+------------------------------------------------------------------+
Comments