R2_Arrows_v4a1
Download script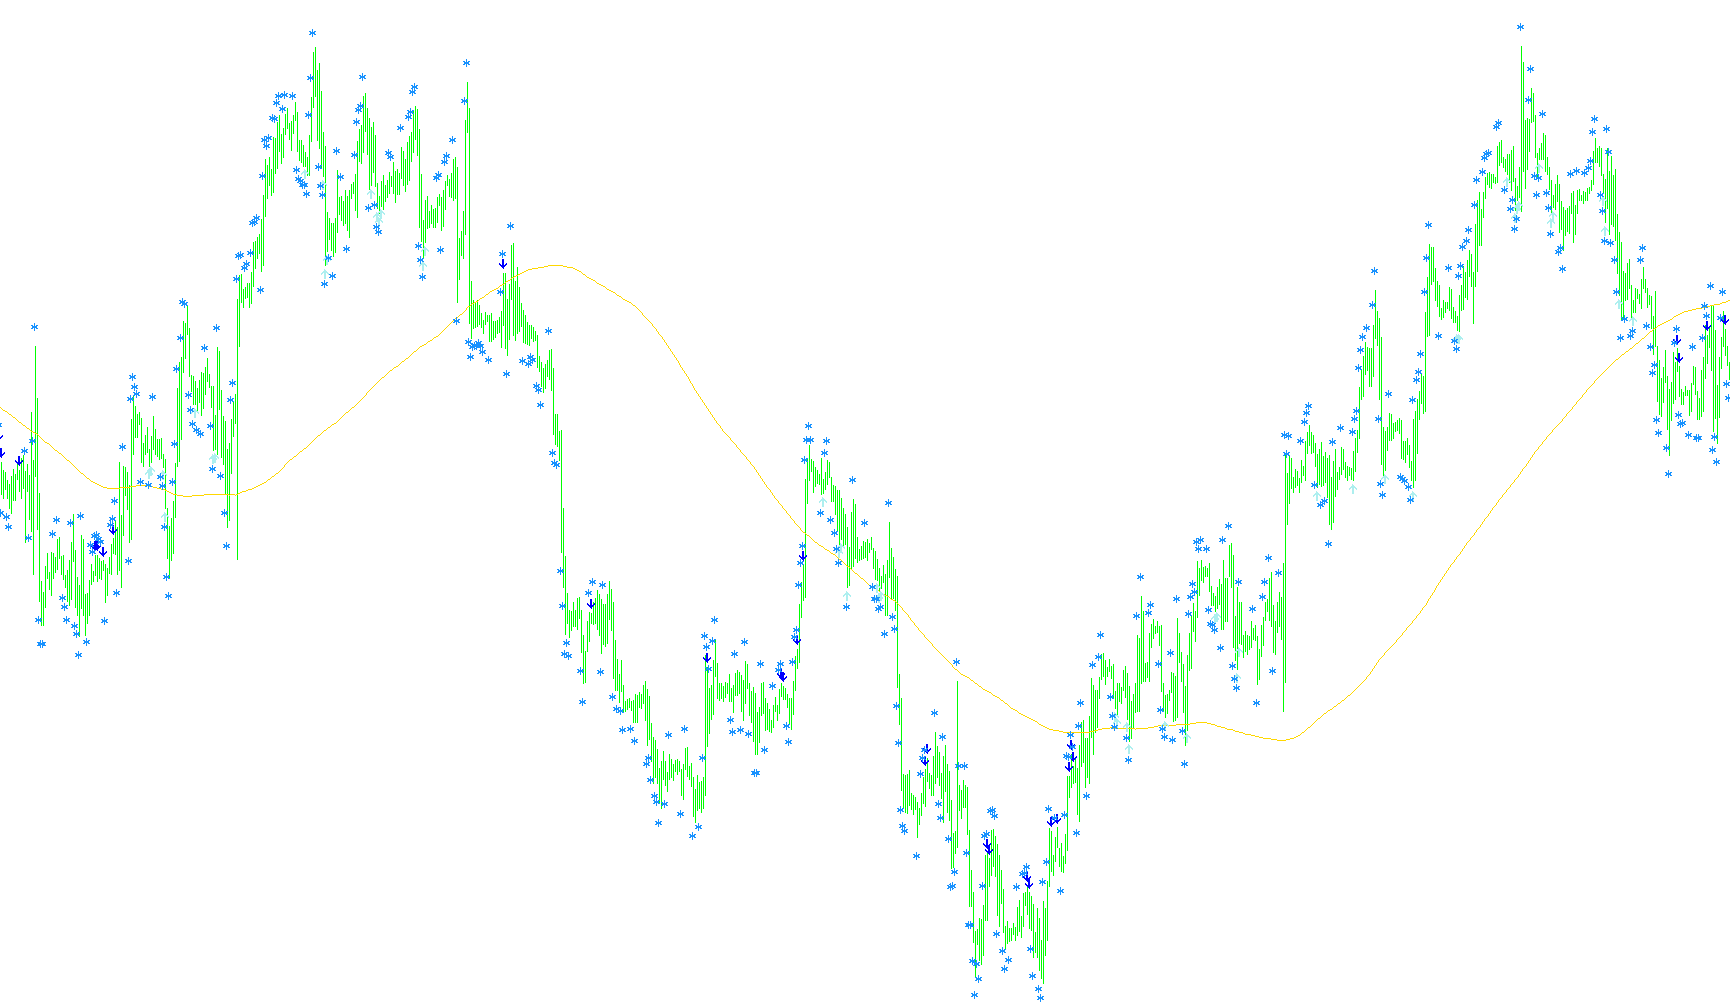
This script is a technical analysis tool designed to identify potential entry and exit points in financial markets by combining trend identification with momentum tracking. It visually simplifies complex market data into three distinct types of signals: Buy Arrows, Sell Arrows, and Trade Close Markers.
Core Logic Overview
The indicator operates by analyzing two primary components of the market: the long-term "Trend" and short-term "Momentum." By looking at both simultaneously, it attempts to ensure that a trade is taken in the direction of the prevailing trend while confirming that the immediate momentum is shifting appropriately.
1. Trend Identification
The script first establishes whether the overall market is moving upward or downward. It does this using a Moving Average (MA). The user can choose between two different calculation methods for this:
- Hull Moving Average: A smoother, faster-responding trend line designed to reduce "lag" (the delay between a price move and the indicator's reaction).
- Standard Moving Average: A traditional linear calculation based on user-defined periods.
The script uses this line as a "filter." For example, it generally looks for buy opportunities only when prices are above this trend line and sell opportunities when prices are below it.
2. Momentum Tracking (RSI)
To time the actual entries, the script monitors the Relative Strength Index (RSI). Rather than looking at just one data point, it analyzes a sequence of the last four RSI values. This allows the script to see if momentum is accelerating in a specific direction over a very short period.
3. Signal Logic
The visual markers on the chart are generated based on specific mathematical conditions:
- Sell Arrows: These appear when the price has closed below the Trend line and there is a consistent upward "spike" in momentum over three consecutive periods (meaning the RSI values are steadily increasing and staying above a specific threshold).
- Buy Arrows: These appear when the price has closed above the Trend line and there is a consistent downward "dip" in momentum over three consecutive periods (meaning the RSI values are steadily decreasing and staying below a specific threshold).
- Close Trade Markers: These act as "exhaustion" signals. They appear when the RSI reaches extreme highs or lows, suggesting that the current move may be overextended and it might be time to consider exiting an open position.
Summary of Visual Elements
- Yellow Line: Represents the calculated Trend (Moving Average).
- Red Arrows: Signal potential Sell entries based on trend and momentum alignment.
- Lime Arrows: Signal potential Buy entries based on trend and momentum alignment.
- Light Gray Markers: Indicate high-probability zones to monitor for closing out existing trades.
//+------------------------------------------------------------------+
//|                                                R2_Arrows_v4a.mq4 |
//|           Copyright © 2007 , transport_david , David W Honeywell |
//|                                     hellonwheels.trans@gmail.com |
//+------------------------------------------------------------------+

#property copyright "Copyright © 2007 , transport_david , David W Honeywell"
#property link      "hellonwheels.trans@gmail.com"

#property indicator_chart_window

#property indicator_buffers 4

#property indicator_color1 Yellow
#property indicator_color2 Red
#property indicator_color3 Lime
#property indicator_color4 LightGray

extern bool   Use_Hull            =   false;

extern string s1 = "---------------";
extern int    Ma_Periods          =     200;
extern int    Ma_Type_if_not_Hull =       0; // only if Use_Hull = false
extern int    Ma_Applied_Price    =       0;

extern string s2 = "---------------";
extern int    RsiPeriods          =       2;
extern int    Rsi_Applied_Price   =       0;

extern string s3 = "---------------";
extern int    BuyIfDay1RsiBelow   =      65; // 1st day of tracking must be < this setting
extern int    BuyIfDay3RsiBelow   =      65; // 3rd day must be < this setting

extern string s4 = "---------------";
extern int    SellIfDay1RsiAbove  =      35; // 1st day of tracking must be > this setting
extern int    SellIfDay3RsiAbove  =      35; // 3rd day must be > this setting

extern string s5 = "---------------";
extern int    CloseBuyIfRsiAbove  =      75;
extern int    CloseSellIfRsiBelow =      25;

extern string s6 = "---------------";
extern int    ShowBars            =   10000;

double Trend_Ma[];
double Sell_Arrow[];
double Buy_Arrow[];
double Close_Trade_Marker[];
double Calc[];

double prevtime;

//+------------------------------------------------------------------+
//| Custom indicator initialization function                         |
//+------------------------------------------------------------------+
int init()
  {
//---- indicators

   IndicatorBuffers(5);

   SetIndexStyle(0,DRAW_LINE,STYLE_SOLID,1);
   SetIndexEmptyValue(0,0.0);
   SetIndexBuffer(0,Trend_Ma);
   SetIndexLabel(0,"Trend_Ma_Periods ( "+Ma_Periods+" )");

   SetIndexEmptyValue(1,0.0);
   SetIndexStyle(1,DRAW_ARROW,STYLE_SOLID,0);
   SetIndexArrow(1,234);
   SetIndexBuffer(1,Sell_Arrow);
   SetIndexLabel(1,"Sell_Arrow ( RsiPeriods "+RsiPeriods+" )");

   SetIndexEmptyValue(2,0.0);
   SetIndexStyle(2,DRAW_ARROW,STYLE_SOLID,0);
   SetIndexArrow(2,233);
   SetIndexBuffer(2,Buy_Arrow);
   SetIndexLabel(2,"Buy_Arrow ( RsiPeriods "+RsiPeriods+" )");

   SetIndexEmptyValue(3,0.0);
   SetIndexStyle(3,DRAW_ARROW,STYLE_SOLID,0);
   SetIndexArrow(3,172);
   SetIndexBuffer(3,Close_Trade_Marker);
   SetIndexLabel(3,"Close_Trade_Marker");

   SetIndexEmptyValue(4,0.0);
   SetIndexBuffer(4,Calc);

//----
   return(0);
  }
//+------------------------------------------------------------------+
//| Custom indicator deinitialization function                       |
//+------------------------------------------------------------------+
int deinit()
  {
//----

//----
   return(0);
  }
//+------------------------------------------------------------------+
//| Custom indicator iteration function                              |
//+------------------------------------------------------------------+
int start()
  {
//----
   int shift = ShowBars;

   if (ShowBars > Bars) ShowBars = Bars;

   for ( shift = ShowBars; shift >= 0; shift-- )
    {

      double Exp = 2;

      double firstwma = iMA(Symbol(),0,MathFloor(Ma_Periods/2),0,MODE_LWMA,Ma_Applied_Price,shift);

      double secondwma = iMA(Symbol(),0,Ma_Periods,0,MODE_LWMA,Ma_Applied_Price,shift);

      Calc[shift] = (Exp*firstwma)-secondwma;

    }
   if (Use_Hull)
    {
     for ( shift = ShowBars; shift >= 0; shift-- )
      {

       Trend_Ma[shift] = iMAOnArray(Calc,0,MathFloor(MathSqrt(Ma_Periods)),0,MODE_LWMA,shift);

       if (prevtime != Time[0]) { RefreshRates(); prevtime=Time[0]; }

       double Day1 = iRSI(Symbol(),0,RsiPeriods,Rsi_Applied_Price,shift+3);
       double Day2 = iRSI(Symbol(),0,RsiPeriods,Rsi_Applied_Price,shift+2);
       double Day3 = iRSI(Symbol(),0,RsiPeriods,Rsi_Applied_Price,shift+1);
       double Today = iRSI(Symbol(),0,RsiPeriods,Rsi_Applied_Price,shift);

       //- Sell Arrows ---

       if ( (iClose(Symbol(),0,shift+1) < Trend_Ma[shift+1]) && (Day1 > SellIfDay1RsiAbove) && (Day2 > Day1) && (Day3 > Day2) && (Day3 > SellIfDay3RsiAbove) )

          Sell_Arrow[shift] = iHigh(Symbol(),0,shift) + (20*Point);//High arrow Sell

       //- Buy Arrows ---

       if ( (iClose(Symbol(),0,shift+1) > Trend_Ma[shift+1]) && (Day1 < BuyIfDay1RsiBelow) && (Day2 < Day1) && (Day3 < Day2) && (Day3 < BuyIfDay3RsiBelow) )

          Buy_Arrow[shift] = iLow(Symbol(),0,shift) - (20*Point);//Low arrow Buy

       //- Close Trades Marker ---

       if (Today < CloseSellIfRsiBelow)

          Close_Trade_Marker[shift] = iLow(Symbol(),0,shift) - (50*Point);

       if (Today > CloseBuyIfRsiAbove)

          Close_Trade_Marker[shift] = iHigh(Symbol(),0,shift) + (50*Point);

      }
      return(0);
    }

   if (!Use_Hull)
    {
     for ( shift = ShowBars; shift >= 0; shift-- )
      {

       Trend_Ma[shift] = iMA( Symbol(), 0, Ma_Periods, 0, Ma_Type_if_not_Hull, Ma_Applied_Price, shift);

       if (prevtime != Time[0]) { RefreshRates(); prevtime=Time[0]; }

       Day1 = iRSI(Symbol(),0,RsiPeriods,Rsi_Applied_Price,shift+3);
       Day2 = iRSI(Symbol(),0,RsiPeriods,Rsi_Applied_Price,shift+2);
       Day3 = iRSI(Symbol(),0,RsiPeriods,Rsi_Applied_Price,shift+1);
       Today = iRSI(Symbol(),0,RsiPeriods,Rsi_Applied_Price,shift);

       //- Sell Arrows ---

       if ( (iClose(Symbol(),0,shift+1) < Trend_Ma[shift+1]) && (Day1 > SellIfDay1RsiAbove) && (Day2 > Day1) && (Day3 > Day2) && (Day3 > SellIfDay3RsiAbove) )

          Sell_Arrow[shift] = iHigh(Symbol(),0,shift) + (20*Point); // High arrow Sell

       //- Buy Arrows ---

       if ( (iClose(Symbol(),0,shift+1) > Trend_Ma[shift+1]) && (Day1 < BuyIfDay1RsiBelow) && (Day2 < Day1) && (Day3 < Day2) && (Day3 < BuyIfDay3RsiBelow) )

          Buy_Arrow[shift] = iLow(Symbol(),0,shift) - (20*Point); // Low arrow Buy

       //- Close Trades Marker ---

       if (Today < CloseSellIfRsiBelow)

          Close_Trade_Marker[shift] = iLow(Symbol(),0,shift) - (50*Point);

       if (Today > CloseBuyIfRsiAbove)

          Close_Trade_Marker[shift] = iHigh(Symbol(),0,shift) + (50*Point);

      }
      return(0);
    }

//----
   return(0);
  }
//+------------------------------------------------------------------+
Comments