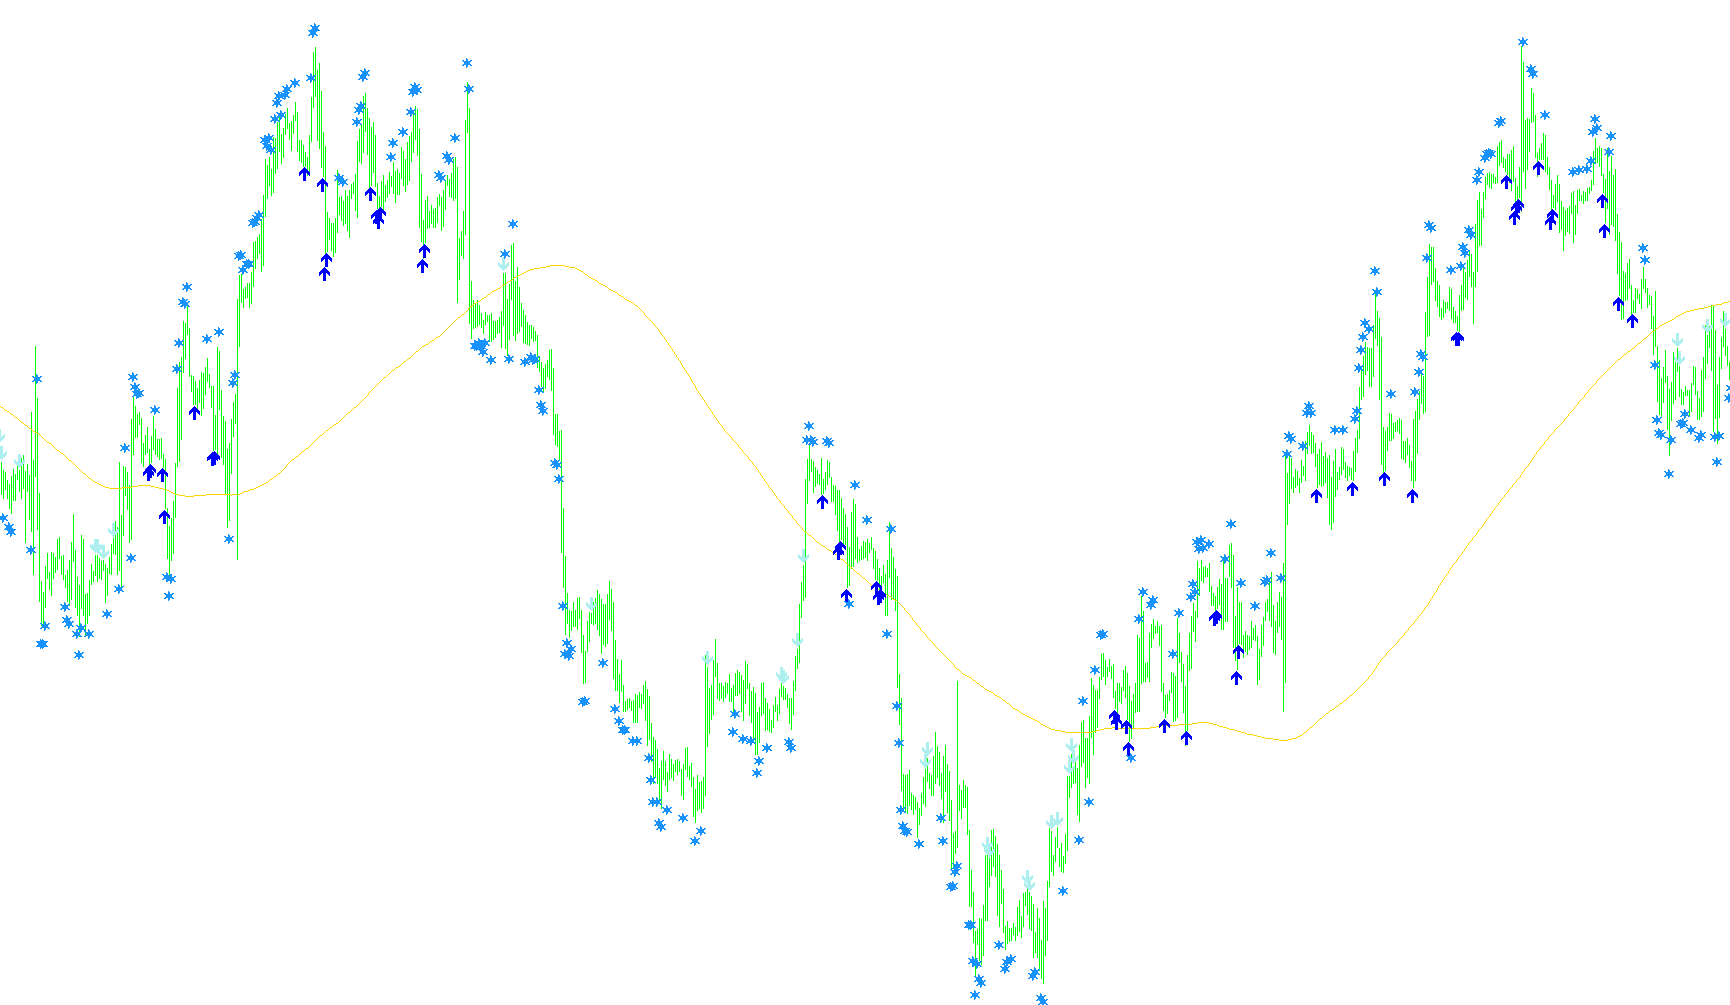
This script is a specialized technical analysis tool designed for the MetaTrader 4 platform. It serves as a visual navigation aid that identifies potential market trends and entry/exit points by analyzing the relationship between price movement, moving averages, and momentum oscillators.
Core Logic Overview
The indicator functions by monitoring three primary components of market data simultaneously:
1. Trend Identification (Moving Average) The script uses a long-term Moving Average to establish the "baseline" of the market. This helps distinguish between a general uptrend and a downtrend. By comparing the current price against this average, the tool determines the overarching direction of the market before looking for specific entries.
2. Momentum Analysis (RSI Sequence) Unlike standard indicators that look at a single point in time, this script performs a multi-day momentum check. It evaluates the Relative Strength Index (RSI) over a three-step sequence. It looks for a consistent "staircase" effect:
- For Buy Signals: It seeks a specific downward progression in momentum across three consecutive periods, ensuring that the price is moving in your favor while staying below certain pre-defined thresholds.
- For Sell Signals: It seeks a consistent upward progression in momentum across three consecutive periods, ensuring the price is retreating while remaining above specific thresholds.
Visual Signals
The script translates these complex mathematical conditions into four distinct visual markers on your chart:
- Trend Line: A continuous line that represents the long-term moving average, providing a visual floor or ceiling for the current price action.
- Buy Arrows: These appear when the price is above the trend line and the momentum sequence confirms a favorable setup for a long position.
- Sell Arrows: These appear when the price is below the trend line and the momentum sequence confirms a favorable setup for a short position.
- Exit Markers: The script also includes specific markers designed to signal potential exit points. These trigger when the price crosses back over the trend line combined with an extreme momentum reading (overbought or oversold conditions), suggesting that the current move may be reaching exhaustion.
Summary of Operation
In essence, the tool filters out "noise" by requiring three things to align before showing a signal: the long-term trend must be favorable, the immediate momentum must be moving in the correct direction consistently over three periods, and the price must stay within specific safety boundaries defined by the user.
//+--------------------------------------------------------------------------+
//|                                                         R2_Arrows_v3.mq4 |
//|    Copyright © 2007 , NOT FOR SALE , transport_david , David W Honeywell |
//| http://finance.groups.yahoo.com/group/MetaTrader_Experts_and_Indicators/ |
//+--------------------------------------------------------------------------+

#property copyright "Copyright © 2007 , NOT FOR SALE , transport_david , David W Honeywell"
#property link      "http://finance.groups.yahoo.com/group/MetaTrader_Experts_and_Indicators/"

//+-------------------------------------------------------------------------------------------------+
//| http://www.tradingmarkets.com/.site/stocks/commentary/editorial/The-Improved-R2-Strategy.cfm    |
//| introduced to http://finance.groups.yahoo.com/group/MetaTrader_Experts_and_Indicators/          |
//| by Peter , blackprinzze , blackprinzze@yahoo.com                                                |
//| for a complimentary build in .mq4                                                               |
//| I have included the option to check Day 3 Rsi Levels .                                          |
//+-------------------------------------------------------------------------------------------------+

#property indicator_chart_window
#property indicator_buffers 4
#property indicator_color1 DodgerBlue
#property indicator_color2 White
#property indicator_color3 Coral
#property indicator_color4 SlateGray

//|+---------------------------------------------------+
//---- input parameters

extern string Ma                  = "---------------";

extern int    Ma_Periods          = 200;
extern int    Ma_Applied_Price    =   0;

//|+---------------------------------------------------+
extern string Rsi                 = "---------------";

extern int    RsiPeriods          =   2;
extern int    Rsi_Applied_Price   =   0;

//|+---------------------------------------------------+
extern string Buy_Rsi_Levels      = "---------------";

extern int    Day_1_Rsi_Below     =  65;
extern int    Day_3_Rsi_Below     = 100;

//|+---------------------------------------------------+
extern string Sell_Rsi_Levels     = "---------------";

extern int    Day_1_Rsi_Above     =  35;
extern int    Day_3_Rsi_Above     =   0;

//|+---------------------------------------------------+
extern string Close_Rsi           = "---------------";

extern int    CloseBuyIfRsiAbove  =  75;
extern int    CloseSellIfRsiBelow =  25;

//|+---------------------------------------------------+
//---- buffers

double ExtMapBuffer0[];
double ExtMapBuffer1[];
double ExtMapBuffer2[];
double ExtMapBuffer3[];

//+------------------------------------------------------------------+
//| Custom indicator initialization function                         |
//+------------------------------------------------------------------+

int init()
  {
//---- indicators

   IndicatorBuffers(4);

   SetIndexEmptyValue(0,0.0);
   SetIndexStyle(0,DRAW_LINE);
   SetIndexBuffer(0,ExtMapBuffer0);

   SetIndexEmptyValue(1,0.0);
   SetIndexStyle(1,DRAW_ARROW);
   SetIndexArrow(1,233);
   SetIndexBuffer(1,ExtMapBuffer1);

   SetIndexEmptyValue(2,0.0);
   SetIndexStyle(2,DRAW_ARROW);
   SetIndexArrow(2,234);
   SetIndexBuffer(2,ExtMapBuffer2);

   SetIndexEmptyValue(3,0.0);
   SetIndexStyle(3,DRAW_ARROW);
   SetIndexArrow(3,172);
   SetIndexBuffer(3,ExtMapBuffer3);

   IndicatorShortName("R2_Arrows_v3");

//----
   return(0);
  }

//+------------------------------------------------------------------+
//| Custor indicator deinitialization function                       |
//+------------------------------------------------------------------+

int deinit()
  {
//----

//----
   return(0);
  }

//+------------------------------------------------------------------+
//| Custom indicator iteration function                              |
//+------------------------------------------------------------------+

int start()
  {

//----
   for (int i=Bars; i>=0; i--)
      {

      //|+---------------------------------------------------+
      double prevtime;
      if (prevtime != Time[0]) { RefreshRates(); prevtime=Time[0]; }

      //|+---------------------------------------------------+
      double Trend_Ma = iMA(Symbol(),0,Ma_Periods,0,MODE_SMA,Ma_Applied_Price,i+1);

      ExtMapBuffer0[i]=Trend_Ma;

      //|+---------------------------------------------------+
      double Day1 = iRSI(Symbol(),0,RsiPeriods,Rsi_Applied_Price,i+3);
      double Day2 = iRSI(Symbol(),0,RsiPeriods,Rsi_Applied_Price,i+2);
      double Day3 = iRSI(Symbol(),0,RsiPeriods,Rsi_Applied_Price,i+1);

      //|+---------------------------------------------------+
      //- Buy Arrows ---
      if ( (Close[i+1] > Trend_Ma) && (Day1 < Day_1_Rsi_Below) && (Day2 < Day1) && (Day3 < Day2) && (Day3 < Day_3_Rsi_Below) )
         ExtMapBuffer1[i]=Low[i]-(20*Point);//Low arrow Buy

      //|+---------------------------------------------------+
      //- Sell Arrows ---
      if ( (Close[i+1] < Trend_Ma) && (Day1 > Day_1_Rsi_Above) && (Day2 > Day1) && (Day3 > Day2) && (Day3 > Day_3_Rsi_Above) )
         ExtMapBuffer2[i]=High[i]+(20*Point);//High arrow Sell

      //|+---------------------------------------------------+
      //- Close Trades Marker ---
      if ( (Close[i+1] < Trend_Ma) && (Day3 < CloseSellIfRsiBelow) )
         ExtMapBuffer3[i]=Low[i]-(50*Point);

      if ( (Close[i+1] > Trend_Ma) && (Day3 > CloseBuyIfRsiAbove) )
         ExtMapBuffer3[i]=High[i]+(50*Point);

      }

//----
   return(0);
  }
//+------------------------------------------------------------------+
Comments