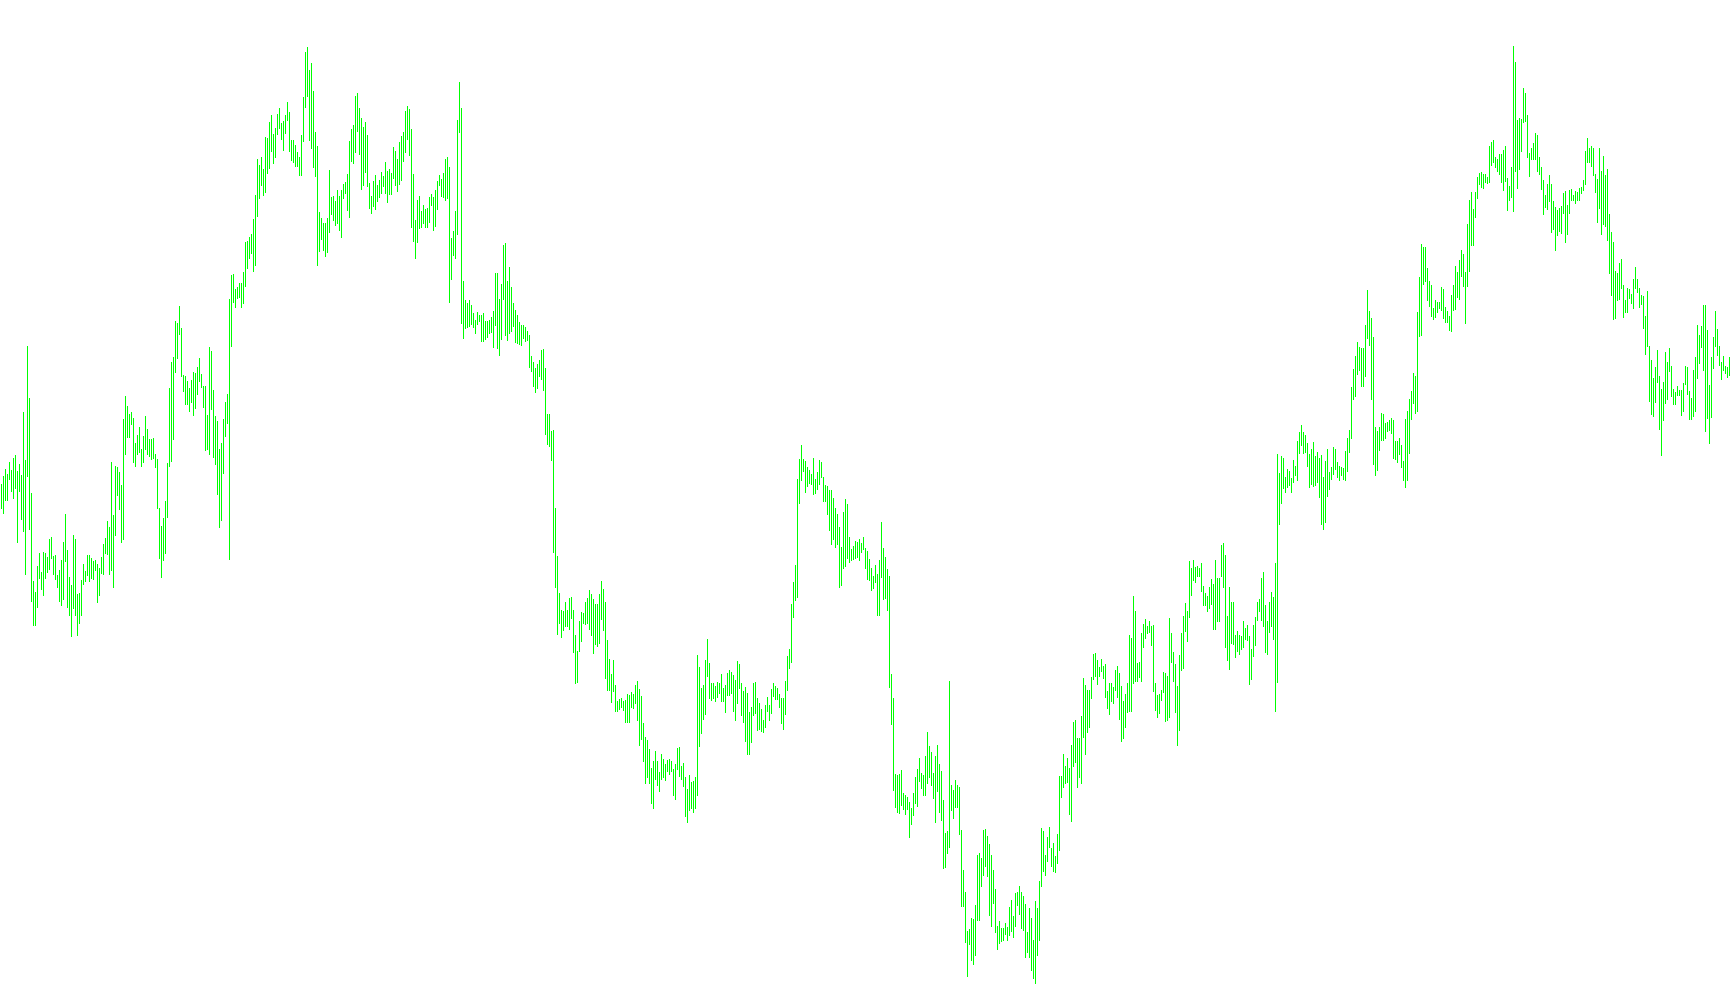
The SeNSetiVe indicator is a specialized technical analysis tool designed to provide a visual representation of market momentum and price behavior. Rather than looking at just one price point, it synthesizes several different layers of market data—including historical highs, lows, averages, and trading volume—to produce a single, cohesive line on a separate window in your trading platform.
How the Logic Works
The indicator operates by performing a complex calculation at every point on the chart. It gathers four primary types of information to determine its final value:
- Extreme Price Points: The script identifies the highest and lowest prices reached within a specific, user-defined lookback window. This helps the indicator understand the "boundaries" of recent price action.
- Moving Averages: It calculates simple moving averages for four different components: the High, Low, Open, and Close prices. By comparing these averages against each other, the script can identify whether the current trend is strengthening or weakening relative to its recent history.
- Price Spread Dynamics: The logic specifically looks at the relationship between the opening and closing prices over a set period, weighing them against the high and low extremes.
- Volume Integration: Finally, the entire calculation is multiplied by the trading volume. This ensures that the resulting line reflects not just the movement of price, but also the "strength" or intensity behind that movement.
The Final Result
By combining these elements into a single formula, the indicator filters out minor market "noise" to highlight significant shifts in trend. Because it incorporates volume, the result provides a more weighted view of market activity; for example, a large price move on low volume may appear differently than a similar move backed by heavy trading activity.
Key Customizations
Users can adjust three primary settings to tailor the indicator to different markets or timeframes:
- Period: Controls how far back into the past the indicator looks to calculate its averages and extremes.
- Factor: Determines the specific window used to find the highest highs and lowest lows.
- Shift: Allows for a horizontal displacement of the resulting line on the chart.
//+------------------------------------------------------------------+
//|   SeNSetiVe.mq4                                                  |
//|   QuantifiEd                                                     |
//|   MySpons@rambler.ru                            Copyright © 2006 |
//+------------------------------------------------------------------+
#property copyright "QuantifiEd"
#property link      ""
//----
#property  indicator_separate_window
#property  indicator_buffers 1
#property indicator_color1 DarkBlue
//----
extern int SPerioD=150;
extern int SFactoR=7;
extern int ShiFt=0;
double buff[];
double Max,Min;
int init()
  {
   string SN;
//----
   SetIndexStyle(0,DRAW_LINE);
   SetIndexBuffer(0,buff);
   SN="SeNSetiVe("+SPerioD+","+SFactoR+","+ShiFt+")";
   IndicatorShortName(SN);
   SetIndexLabel(0,SN);
   SetIndexDrawBegin(0,SPerioD);
//----
  return(0);
  }
//+------------------------------------------------------------------+
//|                                                                  |
//+------------------------------------------------------------------+
int start()
  {
   int i,counted_bars=IndicatorCounted();
//----
   if(Bars<=SPerioD) return(0);
   if(counted_bars<1)
      for(i=1;i<=SPerioD;i++) buff[Bars-i]=0.0;
   i=Bars-SPerioD-1;
   if(counted_bars>=SPerioD) i=Bars-counted_bars-1;
   while(i>=0)
     {
      Max=High[Highest(Symbol(),0,MODE_HIGH,SFactoR,i)];
      Min=Low[Lowest(Symbol(),0,MODE_LOW,SFactoR,i)];
      double hi =iMA(NULL,0,SPerioD,ShiFt,MODE_SMA,PRICE_HIGH,i);
      double lo =iMA(NULL,0,SPerioD,ShiFt,MODE_SMA,PRICE_LOW,i);
      double op =iMA(NULL,0,SPerioD,ShiFt,MODE_SMA,PRICE_OPEN,i);
      double cl =iMA(NULL,0,SPerioD,ShiFt,MODE_SMA,PRICE_CLOSE,i);
      buff[i]=(5*cl-5*op+Max+Min-hi-lo)*Volume[i];
     i--; }
   return(0);
  }
//+------------------------------------------------------------------+
Comments