StepMA_001
Download script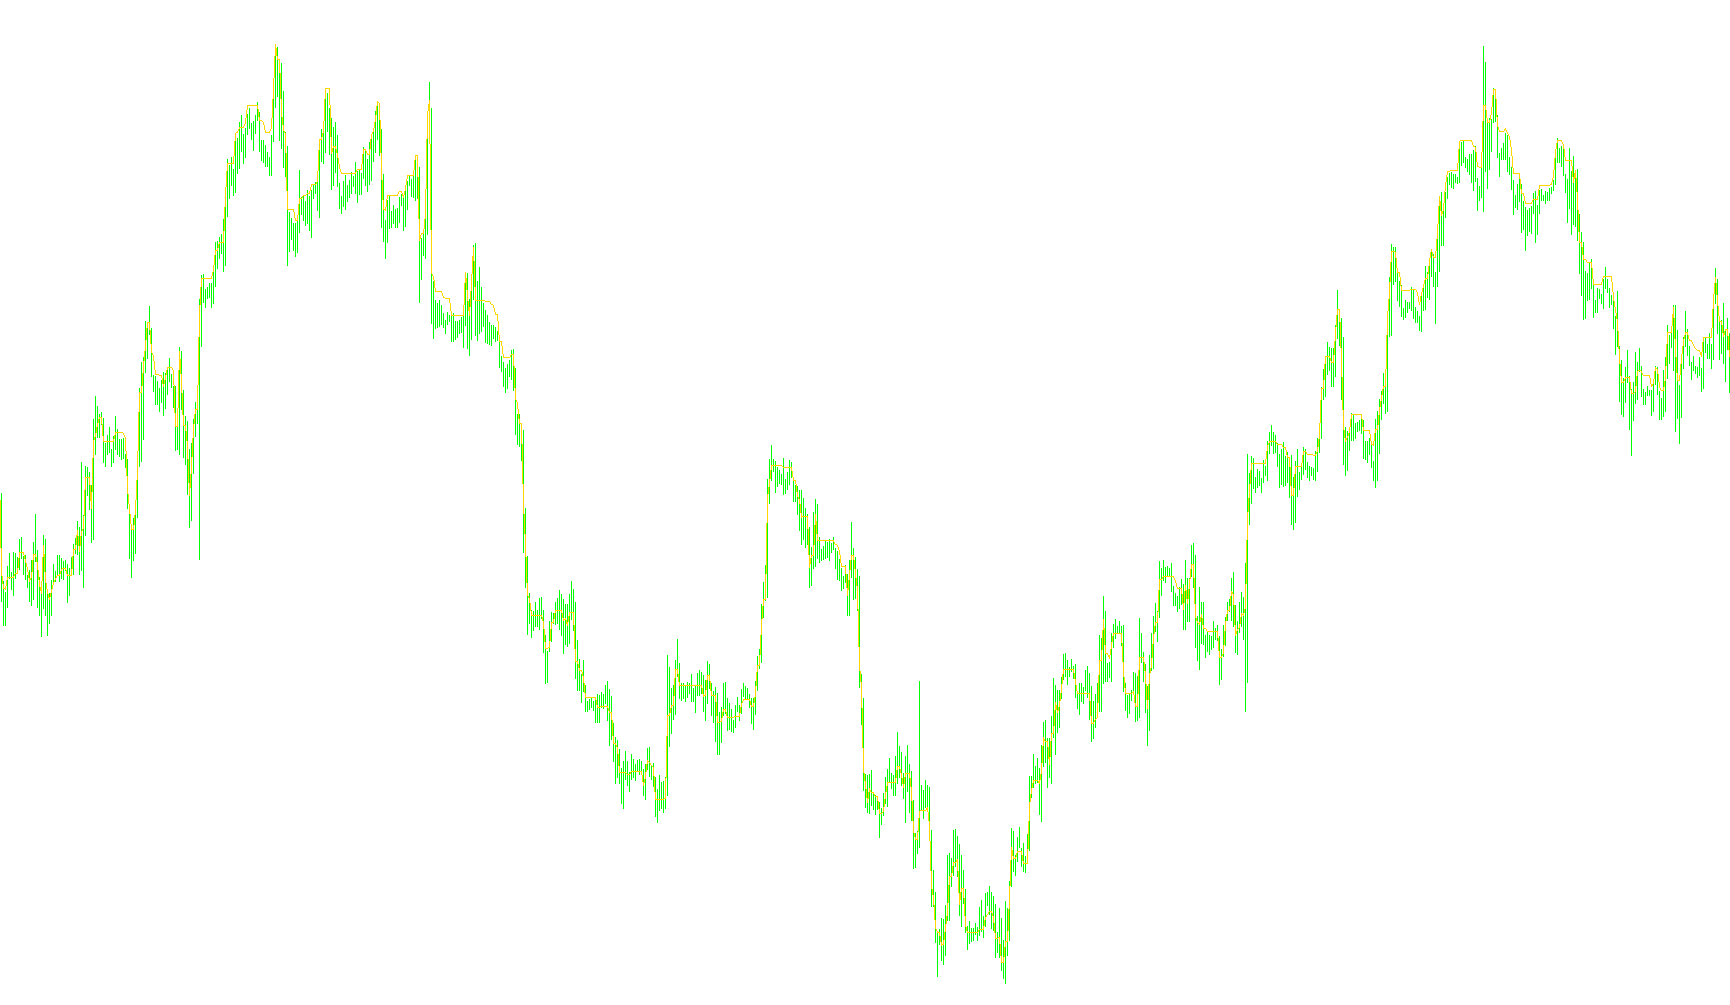
The StepMA indicator is designed to provide a visual representation of market trends by creating a "staircase" effect on your trading chart. Unlike standard moving averages that curve smoothly, this tool focuses on identifying distinct price levels and shifts in direction, making it easier to visualize the overall momentum of the market.
Core Logic and Behavior
The indicator operates by tracking price movement through three primary mechanisms:
1. Trend Detection The script constantly monitors the relationship between the current price and a specific "buffer zone" established around previous price points. It looks for significant breakouts:
- If the price climbs above a predefined upper limit, the system identifies an upward trend.
- If the price drops below a predefined lower limit, the system identifies a downward trend.
2. Price Point Anchoring Instead of reacting to every minor fluctuation (noise), the indicator "locks" onto specific price levels. When a new trend is established, it calculates a boundary based on your chosen Step Size.
- In an upward trend, the indicator identifies a minimum floor. It will only allow this floor to move higher if the price pushes past a certain threshold; otherwise, it remains flat.
- In a downward trend, it identifies a maximum ceiling. Similarly, this ceiling stays horizontal until the price breaks significantly below it.
3. The "Step" Visualization The final result plotted on your screen is a solid line that follows these locked levels. Because the line only moves when the price forces it to a new "step," it eliminates the jaggedness of raw price data. This creates a clean, 계단식 (staircase) visual that highlights:
- Support and Resistance zones.
- Clear trend reversals.
- Periods of consolidation where the price is moving sideways without breaking the current "step."
Customization Options
The logic adapts based on the settings you provide:
- Step Size: Determines how large the "steps" are. A larger size creates a smoother, slower-moving line that filters out more noise, while a smaller size makes the indicator more sensitive to minor price changes.
- HighLow Setting: This allows you to choose whether the trend is calculated based on the actual highs and lows of the candles or based strictly on the closing prices.
Summary for Traders
In simple terms, this tool ignores the "chatter" of the market and only redraws its line when a significant price move occurs. It helps you stay on the right side of the trend by providing a clear, stepped path that shows where the market is currently "resting" versus where it is heading.
//+------------------------------------------------------------------+
//|                                                    StepMA_v1.mq4 |
//|                           Copyright © 2005, TrendLaboratory Ltd. |
//|                                       E-mail: igorad2004@list.ru |
//+------------------------------------------------------------------+
#property copyright "Copyright © 2005, TrendLaboratory Ltd."
#property link      "E-mail: igorad2004@list.ru"

#property indicator_separate_window
#property indicator_buffers 1
#property indicator_color1 Red
#property  indicator_width1  5
//---- input parameters
extern int StepSize=30;
extern int Advance=0;
extern int HighLow=0;
//---- indicator buffers
double LineBuffer[];
//+------------------------------------------------------------------+
//| Custom indicator initialization function                         |
//+------------------------------------------------------------------+
  int init()
  {
   string short_name;
//---- indicator line
   SetIndexStyle(0,DRAW_LINE,STYLE_SOLID);  // dasz po STYLE_SOLID,1 nie musisz dawaæ u góry #property indicator_buffers 1
   SetIndexShift(0,Advance);
   SetIndexBuffer(0,LineBuffer);
   IndicatorDigits(MarketInfo(Symbol(),MODE_DIGITS));
//---- name for DataWindow and indicator subwindow label
   short_name="StepMA("+StepSize+")";
   IndicatorShortName(short_name);
   SetIndexLabel(0,"StepMA");
//----
   SetIndexDrawBegin(0,1);
//----
   return(0);
  }

//+------------------------------------------------------------------+
//| StepMA_v1                                                         |
//+------------------------------------------------------------------+
int start()
  {
   int shift,trend;
   double smin0,smax0,smin1,smax1;


   for(shift=Bars-1;shift>=0;shift--)
   {
	if (HighLow>0)
	  {
	  smax0=Low[shift]+2*StepSize*Point;
	  smin0=High[shift]-2*StepSize*Point;

	  if(Close[shift]>smax1) trend=1;
	  if(Close[shift]<smin1) trend=-1;
	  }

	if (HighLow == 0)
	  {
	  smax0=Close[shift]+2*StepSize*Point;
	  smin0=Close[shift]-2*StepSize*Point;

	  if (Close[shift]>smax1)  trend=1;
	  if (Close[shift]<smin1)  trend=-1;
	  }

	  if(trend>0 && smin0<smin1) smin0=smin1;
	  if(trend<0 && smax0>smax1) smax0=smax1;

	  if (trend>0) LineBuffer[shift]=smin0+StepSize*Point;
	  if (trend<0) LineBuffer[shift]=smax0-StepSize*Point;

	  smin1=smin0;
	  smax1=smax0;
	 }
	return(0);
 }
Comments