StepMA_v3_v2
Download script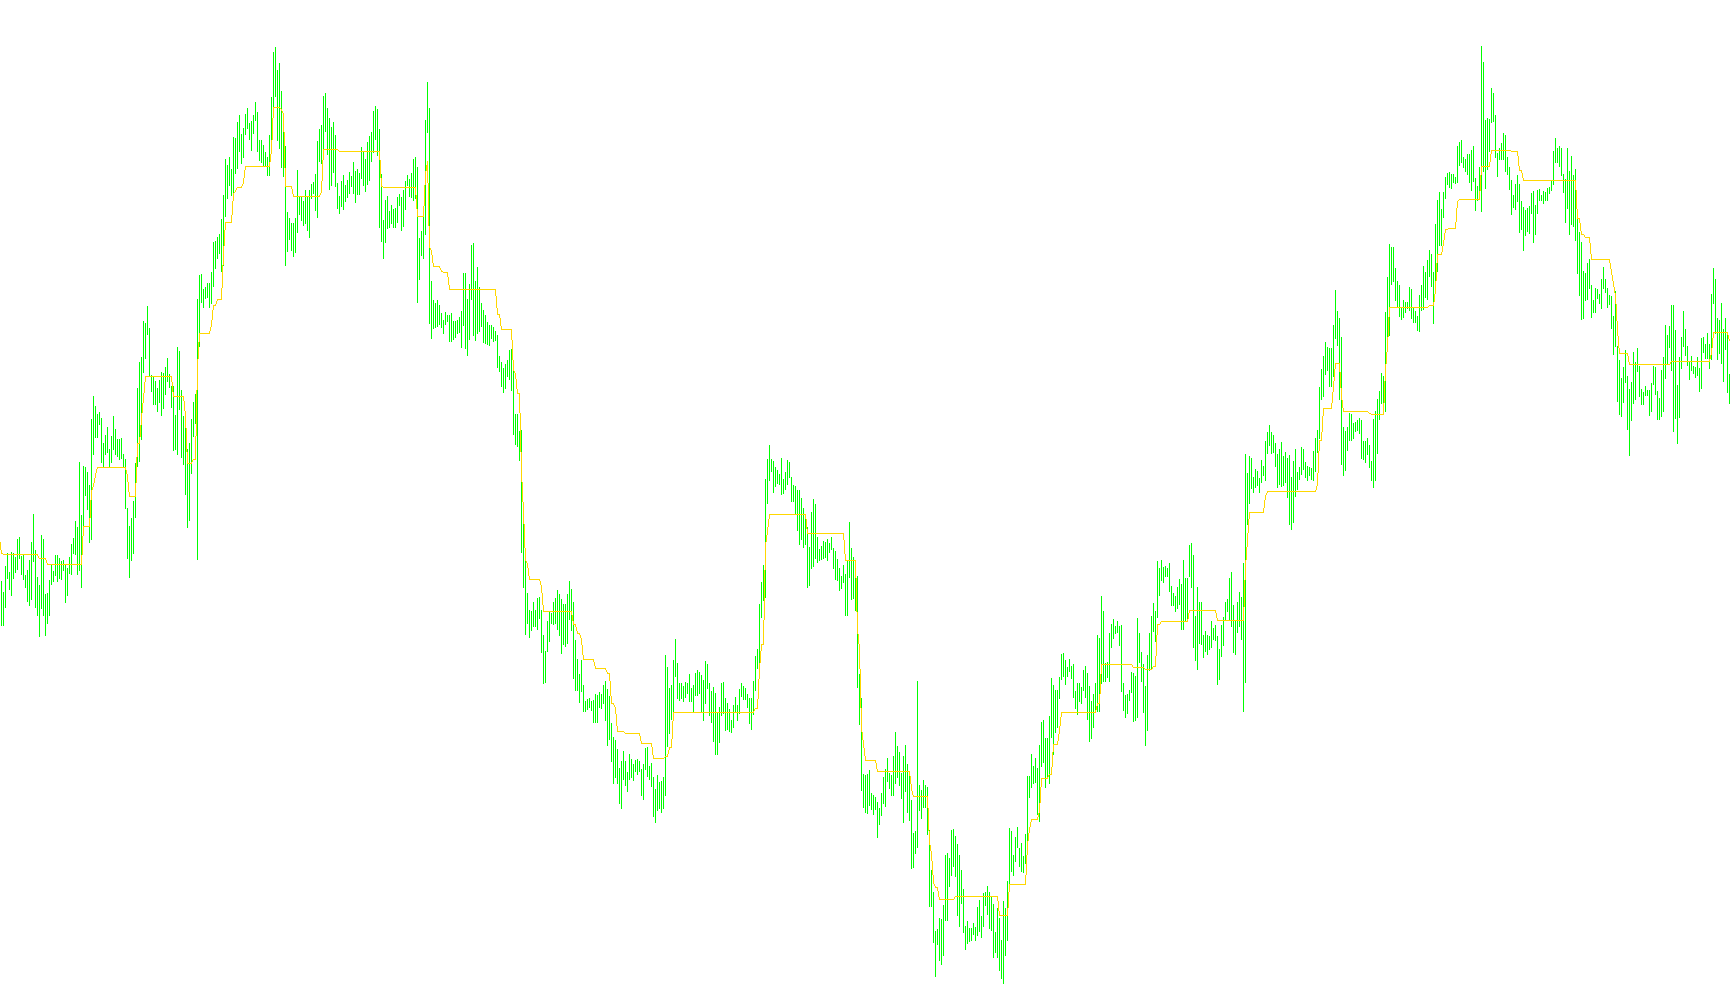
The StepMA is a specialized technical analysis tool designed to provide a clear, "stepped" visualization of market trends. Unlike traditional moving averages that create smooth, flowing curves, this indicator identifies structural shifts in price and creates a staircase-like line that highlights current momentum while filtering out minor market noise.
Core Logic and Functionality
The logic behind the StepMA can be broken down into three primary phases:
1. Volatility Measurement (Dynamic Range)
Before drawing any lines, the tool analyzes a specific lookback period (defined by the user). It calculates the "Average Range" of price movement during this timeframe. Crucially, it applies a weighted calculation to this range, giving more significance to recent price action. This allows the indicator to automatically adjust its sensitivity: in highly volatile markets, the "steps" become larger; in calmer markets, the steps become smaller.
2. Step Size Determination
The script takes the average volatility and multiplies it by a customizable factor to determine a specific Step Size. This step size represents the minimum distance the price must move before the indicator considers a trend change to be significant. By using this dynamic calculation, the tool ensures that it doesn't react to every minor fluctuation, but rather focuses on meaningful price movements.
3. Trend Identification and "Stepping"
The indicator then processes each historical price point to determine whether the market is in an upward or downward trend. It looks at the relationship between the current closing price and the previous boundaries set by the Step Size:
- Trend Detection: If the price breaks above a certain upper threshold, it signals an upward trend. If it breaks below a lower threshold, it signals a downward trend.
- The "Step" Mechanism: Once a trend is established, the line remains flat (horizontal) until the price moves enough to cross the next calculated "step." This creates the unique staircase effect.
- Price Reference: Depending on your settings, the tool can base its calculations on either the extreme highs and lows of a candle or simply on the closing price.
Summary for Traders
For a user, the StepMA acts as a visual filter. Because it "locks" into horizontal levels until a significant move occurs, it provides a cleaner view of market structure than a standard moving average. It effectively helps identify when a trend has truly broken and shifted to a new level, rather than just drifting slightly up or down.
//+------------------------------------------------------------------+
//|                                                    StepMA_v3.mq4 |
//|                           Copyright © 2005, TrendLaboratory Ltd. |
//|                                       E-mail: igorad2004@list.ru |
//+------------------------------------------------------------------+
#property copyright "Copyright © 2005, TrendLaboratory Ltd."
#property link      "E-mail: igorad2004@list.ru"

#property indicator_chart_window
#property indicator_buffers 1
#property indicator_color1 Yellow
//---- input parameters
extern int PeriodWATR=100;
extern double Kwatr=1.0000;
extern int Advance=0;
extern int HighLow=0;
//---- indicator buffers
double LineBuffer[];
//+------------------------------------------------------------------+
//| Custom indicator initialization function                         |
//+------------------------------------------------------------------+
  int init()
  {
   string short_name;
//---- indicator line
   SetIndexStyle(0,DRAW_LINE,STYLE_SOLID,1);
   SetIndexShift(0,Advance);
   SetIndexBuffer(0,LineBuffer);
   IndicatorDigits(MarketInfo(Symbol(),MODE_DIGITS));
//---- name for DataWindow and indicator subwindow label
   short_name="StepMA("+PeriodWATR+")";
   IndicatorShortName(short_name);
   SetIndexLabel(0,"StepMA");
//----
   SetIndexDrawBegin(0,PeriodWATR);
//----
   return(0);
  }

//+------------------------------------------------------------------+
//| StepMA_v2                                                         |
//+------------------------------------------------------------------+
int start()
  {
   int i,shift,trend;
   double smin0,smax0,smin1,smax1,AvgRange,dK,WATR;

   AvgRange=0;
	for (i=PeriodWATR-1;i>=0;i--)
	    {
       dK = 1+1.0*(PeriodWATR-i)/PeriodWATR;
       AvgRange=AvgRange+ dK*MathAbs(High[i]-Low[i]);
       }
	WATR = AvgRange/PeriodWATR;
	int StepSize=Kwatr*WATR/Point;
	Comment(" StepSize = ", StepSize);


   for(shift=Bars-1;shift>=0;shift--)
   {
	if (HighLow>0)
	  {
	  smax0=Low[shift]+2*StepSize*Point;
	  smin0=High[shift]-2*StepSize*Point;

	  if(Close[shift]>smax1) trend=1;
	  if(Close[shift]<smin1) trend=-1;
	  }

	if (HighLow == 0)
	  {
	  smax0=Close[shift]+2*StepSize*Point;
	  smin0=Close[shift]-2*StepSize*Point;

	  if (Close[shift]>smax1)  trend=1;
	  if (Close[shift]<smin1)  trend=-1;
	  }

	  if(trend>0 && smin0<smin1) smin0=smin1;
	  if(trend<0 && smax0>smax1) smax0=smax1;

	  if (trend>0) LineBuffer[shift]=smin0+StepSize*Point;
	  if (trend<0) LineBuffer[shift]=smax0-StepSize*Point;

	  smin1=smin0;
	  smax1=smax0;
	 }
	return(0);
 }
Comments