StepMA_v2
Download script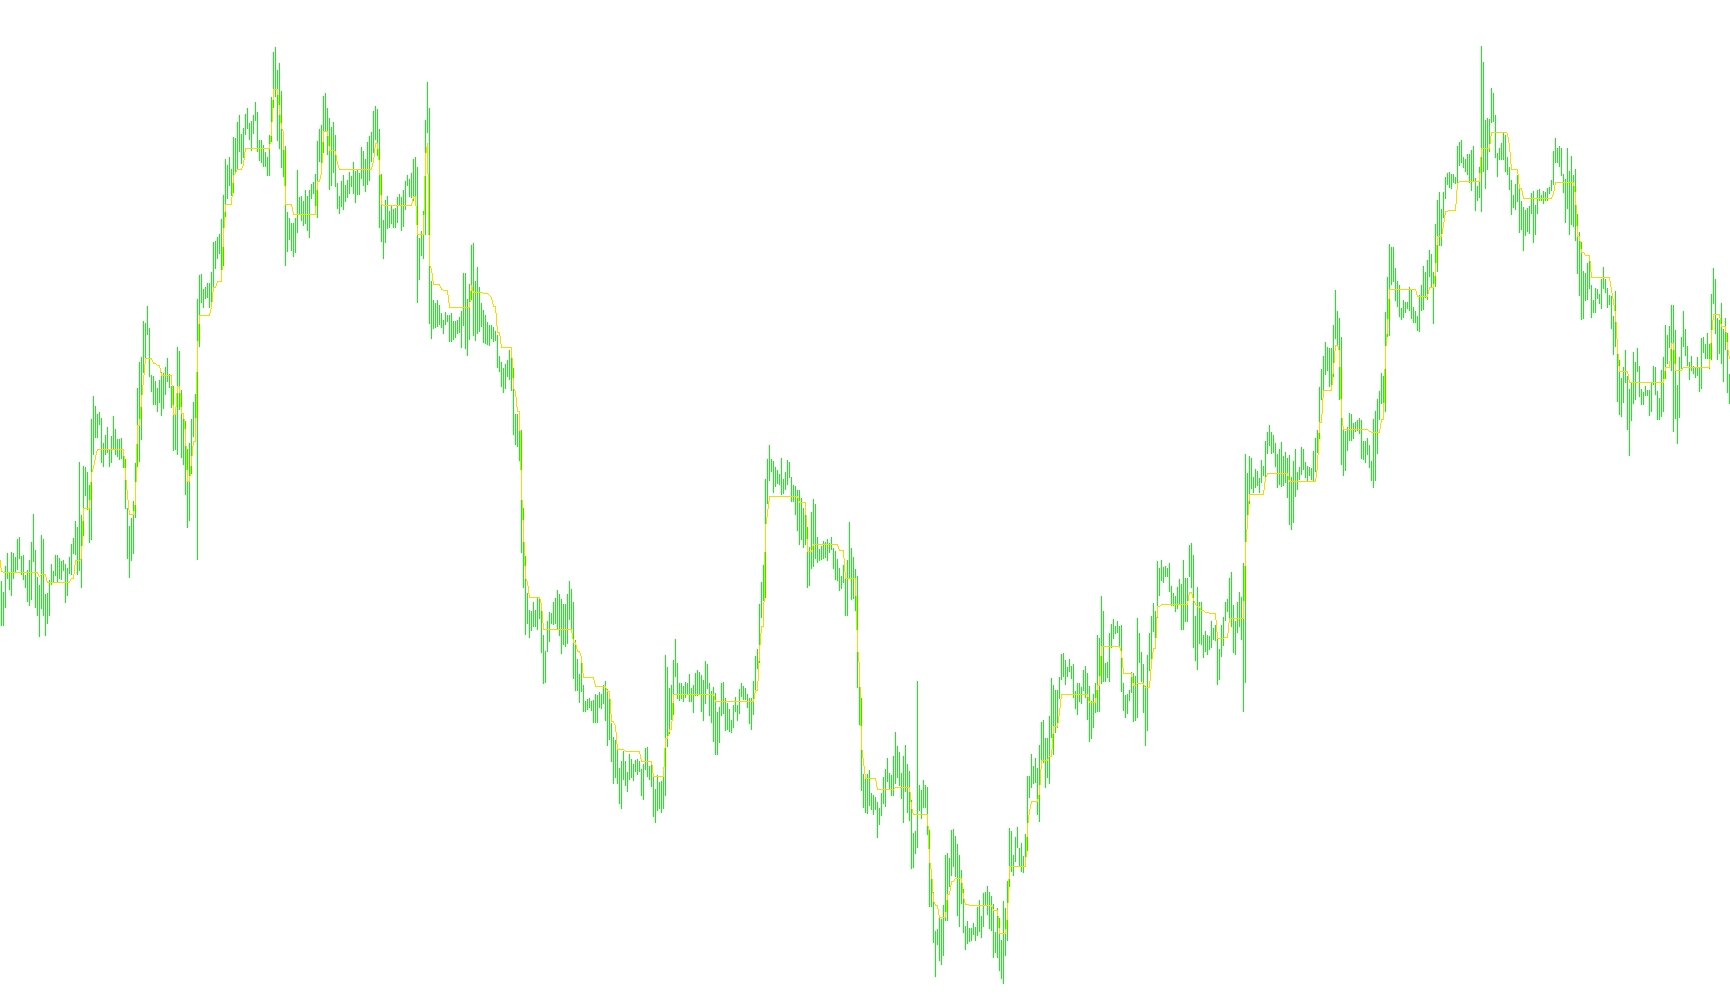
This tool, known as the StepMA, is designed to provide traders with a visual representation of market trends that behaves differently than standard moving averages. While traditional averages often smooth out price data to show a general direction, this script focuses on identifying specific "steps" or levels, helping to filter out minor market noise and highlight significant price movements.
Core Logic and Functionality
The logic behind this indicator can be broken down into three main phases:
1. Calculating Market Volatility (WATR) Before drawing anything on the chart, the script analyzes a specific historical window of time (defined by the user). It looks at the high and low prices within that period to determine the average range of price fluctuations. This allows the indicator to be "dynamic"—meaning it adjusts its sensitivity based on whether the market is currently very volatile or relatively calm.
2. Determining the "Step Size" Once the script understands the current volatility, it calculates a specific unit of movement called the Step Size. Think of this as the minimum distance the price must travel to be considered a significant move. The user can scale this size up or down; a larger step size will result in a smoother, more rigid line, while a smaller one will react more quickly to minor price changes.
3. Trend Identification and Plotting The script then moves through the price history to determine the current trend direction. It evaluates whether the price is breaking above or below established boundaries based on the calculated Step Size.
- Upward Trend: When the price pushes upward significantly, the indicator "steps" up to a new level and stays there until a clear downward break occurs.
- Downward Trend: Conversely, when the price drops significantly, the indicator "steps" down.
How It Appears on Your Chart
Instead of a continuous, wavy line that curves with every tick of the market, the StepMA produces a jagged, stair-like progression. It only moves when the price action is strong enough to overcome the calculated "Step Size."
For a trader, this provides a clear visual of support and resistance levels. Because it ignores small fluctuations, it helps you see the "big picture" of the market's direction, making it easier to identify when a trend has actually shifted rather than just experiencing a temporary pause.
//+------------------------------------------------------------------+
//|                                                    StepMA_v2.mq4 |
//|                           Copyright © 2005, TrendLaboratory Ltd. |
//|                                       E-mail: igorad2004@list.ru |
//+------------------------------------------------------------------+
#property copyright "Copyright © 2005, TrendLaboratory Ltd."
#property link      "E-mail: igorad2004@list.ru"

#property indicator_chart_window
#property indicator_buffers 1
#property indicator_color1 Red
//---- input parameters
extern int PeriodWATR=100;
extern double Kwatr=1.0000;
extern int Advance=0;
extern int HighLow=0;
//---- indicator buffers
double LineBuffer[];
//+------------------------------------------------------------------+
//| Custom indicator initialization function                         |
//+------------------------------------------------------------------+
  int init()
  {
   string short_name;
//---- indicator line
   SetIndexStyle(0,DRAW_LINE,STYLE_SOLID,1);
   SetIndexShift(0,Advance);
   SetIndexBuffer(0,LineBuffer);
   IndicatorDigits(MarketInfo(Symbol(),MODE_DIGITS));
//---- name for DataWindow and indicator subwindow label
   short_name="StepMA("+PeriodWATR+")";
   IndicatorShortName(short_name);
   SetIndexLabel(0,"StepMA");
//----
   SetIndexDrawBegin(0,PeriodWATR);
//----
   return(0);
  }

//+------------------------------------------------------------------+
//| StepMA_v2                                                         |
//+------------------------------------------------------------------+
int start()
  {
   int i,shift,trend;
   double smin0,smax0,smin1,smax1,AvgRange,dK,WATR;

   AvgRange=0;
	for (i=PeriodWATR-1;i>=0;i--)
	    {
       dK = 1+(PeriodWATR-i)/PeriodWATR;
       AvgRange=AvgRange+ dK*MathAbs(High[i]-Low[i]);
       }
	WATR = AvgRange/PeriodWATR;
	int StepSize=Kwatr*WATR/Point;
	Comment(" StepSize = ", StepSize);


   for(shift=Bars-1;shift>=0;shift--)
   {
	if (HighLow>0)
	  {
	  smax0=Low[shift]+2*StepSize*Point;
	  smin0=High[shift]-2*StepSize*Point;

	  if(Close[shift]>smax1) trend=1;
	  if(Close[shift]<smin1) trend=-1;
	  }

	if (HighLow == 0)
	  {
	  smax0=Close[shift]+2*StepSize*Point;
	  smin0=Close[shift]-2*StepSize*Point;

	  if (Close[shift]>smax1)  trend=1;
	  if (Close[shift]<smin1)  trend=-1;
	  }

	  if(trend>0 && smin0<smin1) smin0=smin1;
	  if(trend<0 && smax0>smax1) smax0=smax1;

	  if (trend>0) LineBuffer[shift]=smin0+StepSize*Point;
	  if (trend<0) LineBuffer[shift]=smax0-StepSize*Point;

	  smin1=smin0;
	  smax1=smax0;
	 }
	return(0);
 }
Comments