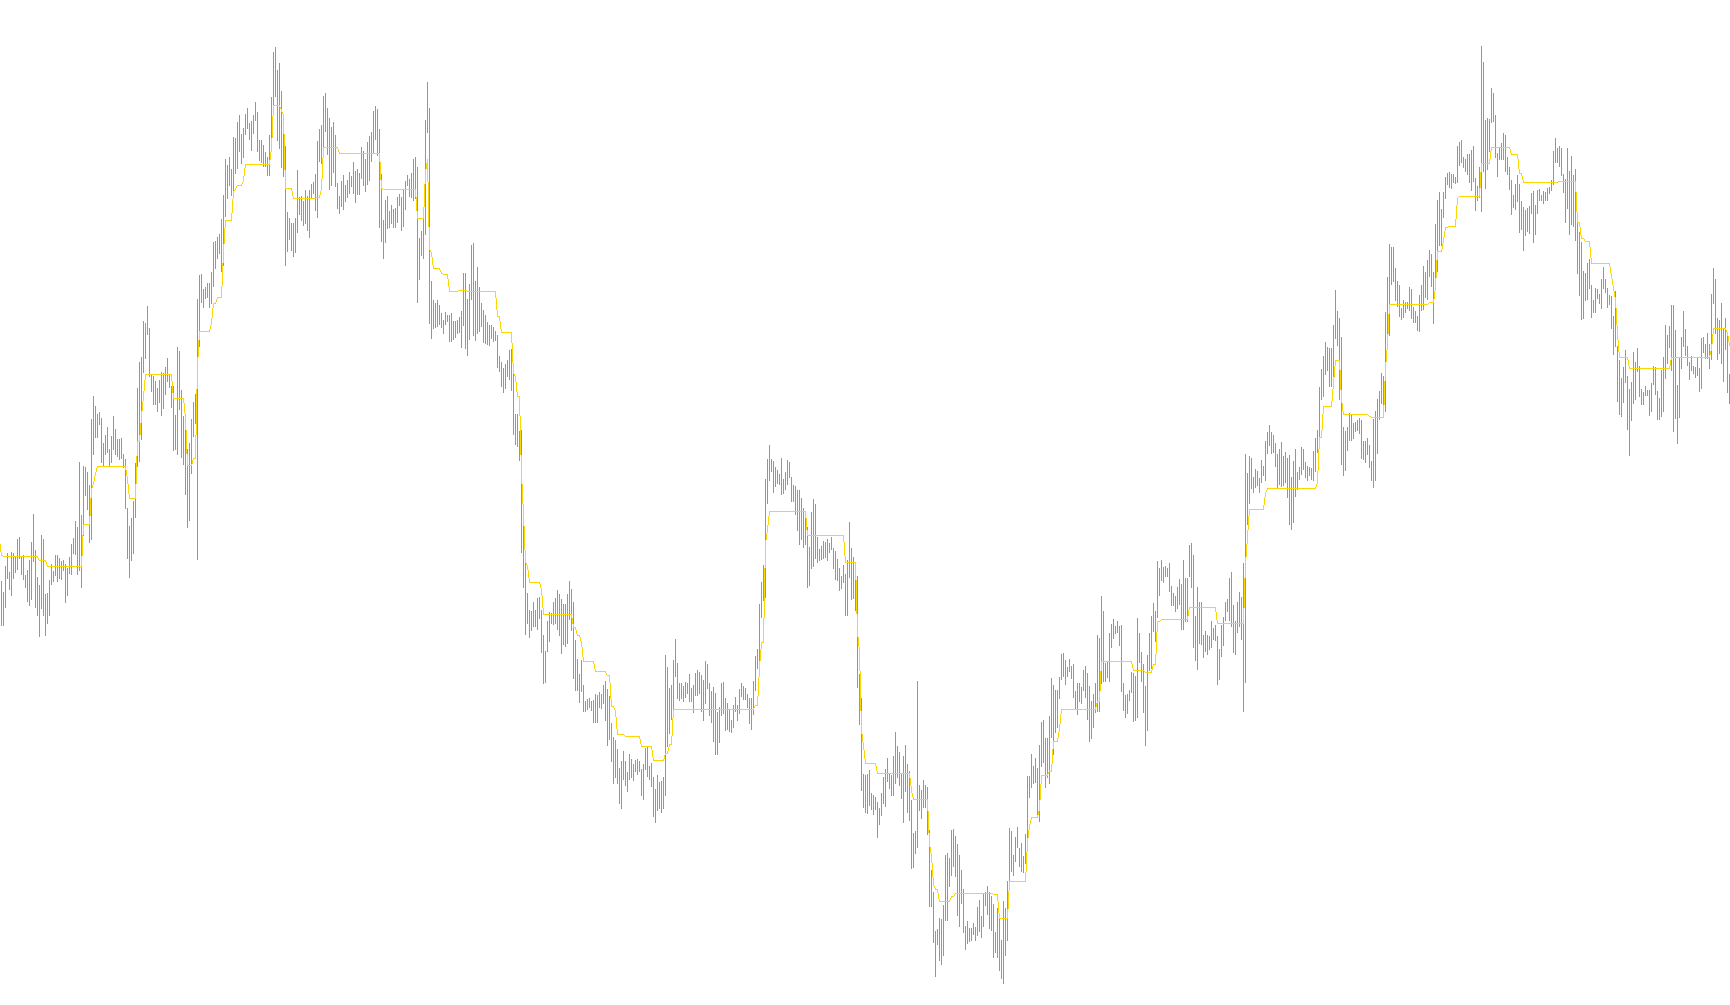
This tool is designed to help traders visualize market trends by identifying specific "steps" in price movement. Unlike standard moving averages that smooth out price data into a continuous curve, this script creates a staircase-like visual that helps highlight shifts in momentum and significant price boundaries.
Core Logic and Functionality
1. Volatility-Based Step Calculation The indicator determines the height of each "step" based on market volatility. It looks at a specific period of historical data (the ATR Length) to measure how much the price typically moves.
- If you choose an automatic setting, the tool calculates these steps by finding the highest and lowest average ranges in recent history.
- This ensures that during high-volatility periods, the "steps" are larger, and during quiet markets, the steps contract automatically to stay relevant to current price action.
2. Trend Detection System The script constantly monitors whether the current closing price is breaking above or below a calculated boundary:
- Upward Trend: When the price closes above the upper boundary of the previous step, the indicator registers an upward trend.
- Downward Trend: When the price closes below the lower boundary of the previous step, it registers a downward trend.
3. The Staircase Construction (The "StepMA") Once a trend is established, the indicator draws a line that moves in discrete increments rather than fluid motion:
- In an uptrend, the line follows the "floor" of the price movement, moving up only when a new higher level is confirmed.
- In a downtrend, the line follows the "ceiling," moving down as price retreats. This creates a jagged, staircase effect that clearly marks support and resistance levels as they evolve over time.
4. Key Customization Options
- High/Low Mode: You can choose whether the indicator calculates its boundaries based on the extreme Highs and Lows of a candle (for more sensitivity to "wicks") or based strictly on the Closing prices (for a smoother, more conservative trend view).
- Sensitivity Factor (Kv): This allows you to multiply or scale the size of the steps, making the indicator either more reactive to small price changes or more resistant to market "noise."
- Visual Aids: The tool provides visual markers (arrows) to signify when the trend flips from up to down (or vice versa), and it can display specific colors to help differentiate between bullish and bearish zones on your chart.
Summary for the User
In simple terms, this script acts as a "trend filter." It ignores minor price fluctuations and only "steps" upward or downward when the market shows enough strength to break through a calculated volatility threshold. It is designed to show you the primary direction of the market while clearly defining the boundaries of that movement.
//+------------------------------------------------------------------+
//|                                                  StepMA_v6.4.mq4 |
//|                                Copyright © 2006, TrendLaboratory |
//|            http://finance.groups.yahoo.com/group/TrendLaboratory |
//|                                       E-mail: igorad2004@list.ru |
//+------------------------------------------------------------------+
#property copyright "Copyright © 2006, TrendLaboratory"
#property link      "http://finance.groups.yahoo.com/group/TrendLaboratory"

#property indicator_chart_window
#property indicator_buffers 3
#property indicator_color1 LightBlue
#property indicator_color2 Blue
#property indicator_color3 Red
//---- input parameters
extern int     Length=10;      // ATR Length
extern double  Kv=1.0;         // Sensivity Factor
extern int     StepSize=0;     // Constant Step Size (if need)
extern int     Advance=0;      // Offset
extern double  Percentage=0;   // Up/down moving percentage
extern bool    HighLow=false;  // High/Low Mode Switch (more sensitive)
extern bool    Color=false;    // Color Mode Switch
extern int     BarsNumber=0;   // Counted bars
//---- indicator buffers
double LineBuffer[];
double UpBuffer[];
double DnBuffer[];
double smin[];
double smax[];
//+------------------------------------------------------------------+
//| Custom indicator initialization function                         |
//+------------------------------------------------------------------+
  int init()
  {
   string short_name;
//---- indicator line
   IndicatorBuffers(5);
   SetIndexStyle(0,DRAW_LINE,STYLE_SOLID,1);
   SetIndexStyle(1,DRAW_ARROW);
   SetIndexStyle(2,DRAW_ARROW);
   SetIndexArrow(1,159);
   SetIndexArrow(2,159);
   SetIndexShift(0,Advance);
   SetIndexShift(1,Advance);
   SetIndexShift(2,Advance);
   SetIndexBuffer(0,LineBuffer);
   SetIndexBuffer(1,UpBuffer);
   SetIndexBuffer(2,DnBuffer);
   SetIndexBuffer(3,smin);
   SetIndexBuffer(4,smax);

   IndicatorDigits(MarketInfo(Symbol(),MODE_DIGITS));
//---- name for DataWindow and indicator subwindow label
   short_name="StepMA("+StepSize+","+Kv+","+StepSize+")";
   IndicatorShortName(short_name);
   SetIndexLabel(0,short_name);
   SetIndexLabel(1,"UpTrend");
   SetIndexLabel(2,"DownTrend");
//----
   SetIndexEmptyValue(0,0.0);
   SetIndexEmptyValue(1,0.0);
   SetIndexEmptyValue(2,0.0);

   SetIndexDrawBegin(0,Length);
   SetIndexDrawBegin(1,Length);
   SetIndexDrawBegin(2,Length);
//----
   return(0);
  }

//+------------------------------------------------------------------+
//| StepMA_v6                                                         |
//+------------------------------------------------------------------+
int start()
  {
   int i,shift,trend,Step;
   double smin0,smax0,smin1,smax1,ATRmin=1000000,ATRmax=-1000000,AvgRange,ATR0;

	if(BarsNumber>0) int Nbars=BarsNumber; else Nbars=Bars;

   for(shift=Nbars-1-Length;shift>=0;shift--)
   {

   if( StepSize==0 )
   {
        AvgRange=0;
	     for (i=Length;i>=1;i--)
	     {
            AvgRange+= (High[shift+i]-Low[shift+i]);
        }
	     ATR0 = AvgRange/Length;
	if (shift>0)
	{
	if (ATR0>ATRmax) ATRmax=ATR0;
	if (ATR0<ATRmin) ATRmin=ATR0;
	}

	Step=0.5*Kv*(ATRmax+ATRmin)/Point;
	}
	else
	{Step=Kv*StepSize;}

	Comment (" StepSize= ", Step);
	if (HighLow)
	  {
	  smax[shift]=Low[shift]+2.0*Step*Point;
	  smin[shift]=High[shift]-2.0*Step*Point;
     }
	else
	  {
	  smax[shift]=Close[shift]+2.0*Step*Point;
	  smin[shift]=Close[shift]-2.0*Step*Point;
	  }

	  if (Close[shift]>smax[shift+1])  trend=1;
	  if (Close[shift]<smin[shift+1])  trend=-1;

	  if(trend>0)
	  {
	  if(smin[shift]<smin[shift+1]) smin[shift]=smin[shift+1];
	  double Line=smin[shift]+Step*Point;
	  if(Color) {UpBuffer[shift]=smin[shift];DnBuffer[shift]=-1.0;}
	  }
	  else
	  {
	  if(smax[shift]>smax[shift+1]) smax[shift]=smax[shift+1];
	  Line=smax[shift]-Step*Point;
	  if(Color) {DnBuffer[shift]=smax[shift];UpBuffer[shift]=-1.0;}
	  }
	  LineBuffer[shift]=Line+Percentage/100.0*Step*Point;
	 }

	return(0);
 }
Comments