SuperTrend volty like
Download script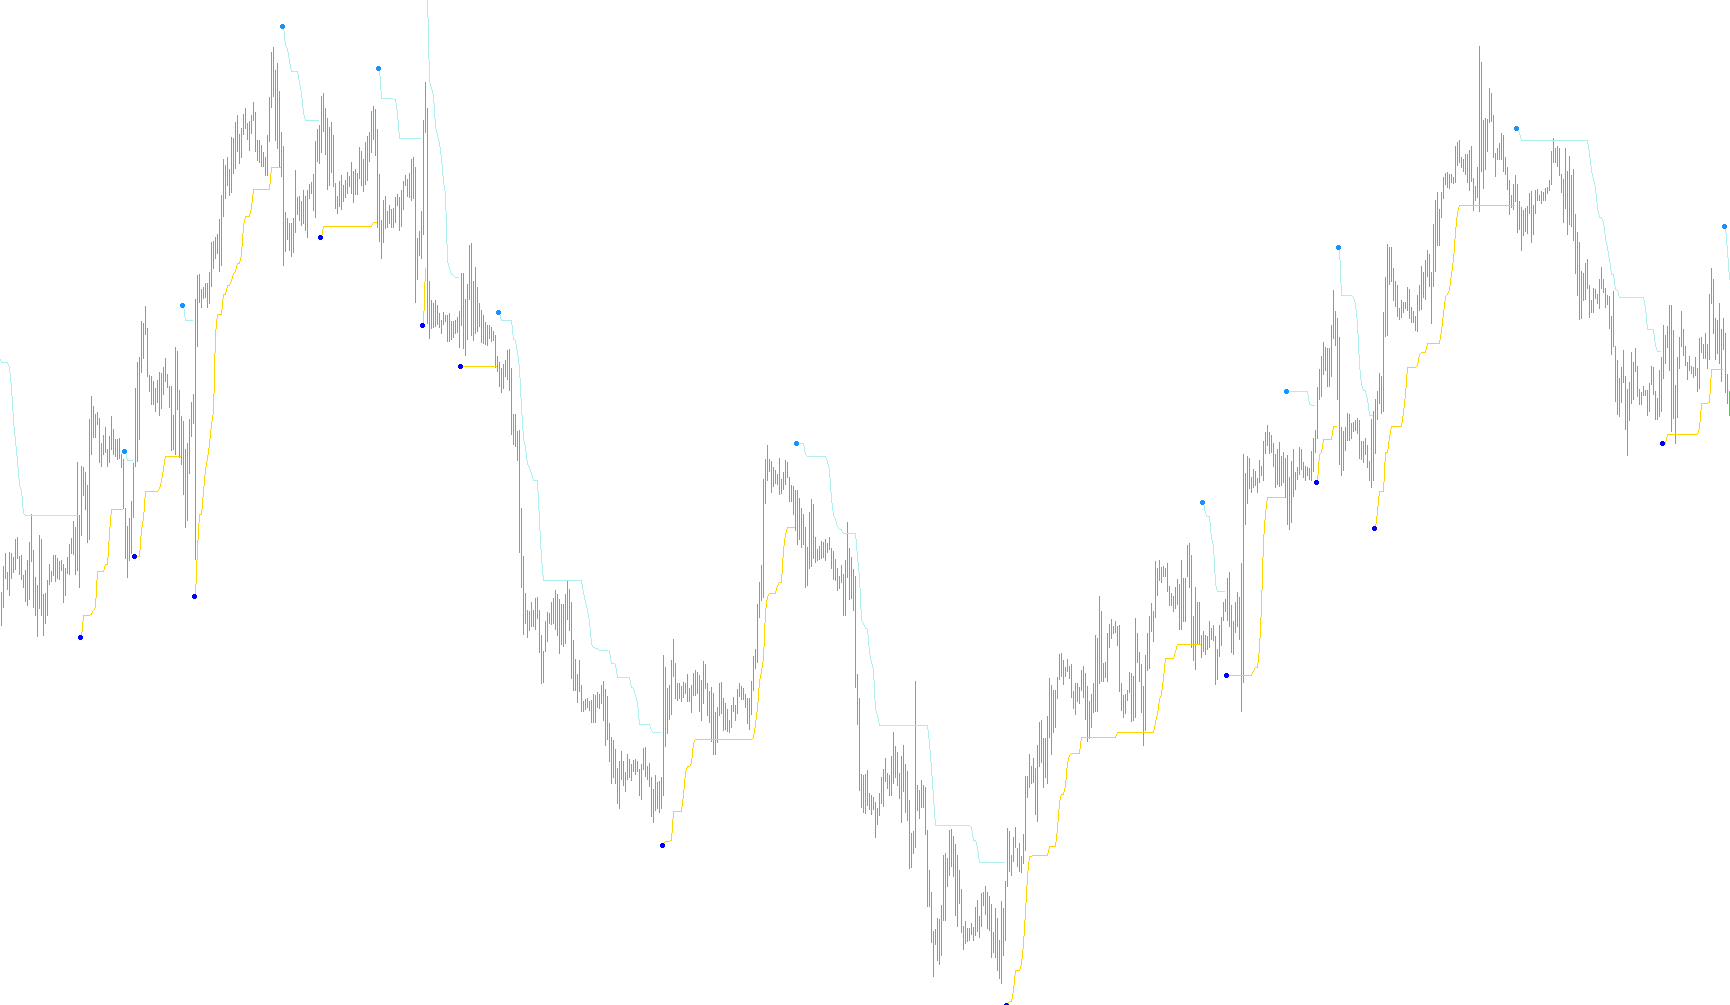
This script is a technical analysis tool designed to help traders identify the prevailing market trend and potential reversal points. It functions by calculating a dynamic "buffer" zone around the current price, which adjusts based on market volatility.
Core Logic Overview
The tool operates by evaluating two primary factors: Volatility and Price Action. By combining these, it determines whether the market is currently in an "uptrend" or a "downtrend."
Rather than just looking at where the price is now, the script looks at how much the price has been fluctuating over a specific period. It uses a volatility measurement (Average True Range) to create a boundary. If the price breaks above this upper boundary, it signals an upward movement; if it drops below the lower boundary, it signals a downward move.
How it Works on Your Chart
The script processes the data in the following sequence:
- Volatility Measurement: It calculates the average range of price movements over a user-defined period. This ensures that the signals are sensitive enough to catch moves but stable enough to ignore minor "noise."
- Boundary Calculation: It establishes two invisible lines—an upper and a lower bound—based on the midpoint of the current candle's high and low prices, adjusted by a multiplier.
- Trend Tracking: The script compares the current closing price against these boundaries.
- When the price stays above the calculated bounds, the trend is considered "Up."
- When the price stays below the calculated bounds, the trend is considered "Down."
- Smart Filtering: To prevent the indicator from flickering or changing signals too rapidly during minor price fluctuations, it includes a logic check that ensures the trend line only moves in the direction of the momentum. This creates a "staircase" effect on the lines, where they hold their level until a significant enough move occurs to break them.
Visual Indicators
For the user, this logic translates into clear visual cues:
- Trend Lines: Smooth lines that follow the price action, acting as dynamic support or resistance levels depending on the trend direction.
- Directional Shifts: The script specifically identifies the moment a trend flips (e.g., from up to down). When these transitions occur, it places specific markers (arrows) on the chart to alert the trader to a potential change in market sentiment.
In summary, this tool acts as a filter that strips away minor market fluctuations to reveal the underlying direction of the price, providing traders with a clearer picture of whether the momentum is currently bullish or bearish.
//+------------------------------------------------------------------+
//|                                        SuperTrend volty like.mq4 |
//|                                                           Mladen |
//| initial idea by jntrader                                         |
//+------------------------------------------------------------------+
#property copyright "mladen"
#property link      "mladenfx@gmail.com"

#property indicator_chart_window
#property indicator_buffers 4
#property indicator_color1 Lime
#property indicator_color2 Lime
#property indicator_color3 Red
#property indicator_color4 Red
#property indicator_width2 1
#property indicator_width4 1


extern int    period       = 10;
extern int    appliedPrice = PRICE_CLOSE;
extern double multiplier   = 3.0;

//
//
//
//
//

double TrendU[];
double TrendUA[];
double TrendD[];
double TrendDA[];
double Direction[];
double Up[];
double Dn[];

//+------------------------------------------------------------------+
//|                                                                  |
//+------------------------------------------------------------------+
//
//
//
//
//

int init()
{
   IndicatorBuffers(7);
      SetIndexBuffer(0, TrendU);
      SetIndexBuffer(1, TrendUA); SetIndexStyle(1,DRAW_ARROW); SetIndexArrow(1,159);
      SetIndexBuffer(2, TrendD);
      SetIndexBuffer(3, TrendDA); SetIndexStyle(3,DRAW_ARROW); SetIndexArrow(3,159);
      SetIndexBuffer(4, Direction);
      SetIndexBuffer(5, Up);
      SetIndexBuffer(6, Dn);

      SetIndexLabel(0,"SuperTrend up");
      SetIndexLabel(1,"SuperTrend start up");
      SetIndexLabel(2,"SuperTrend down");
      SetIndexLabel(3,"SuperTrend start down");
   IndicatorShortName("SuperTrend");
   period = MathMax(1,period);
}
int deinit()
{
   return(0);
}


//+------------------------------------------------------------------+
//|                                                                  |
//+------------------------------------------------------------------+
//
//
//
//
//

int start()
{
   int counted_bars = IndicatorCounted();
   int limit,i;

   if(counted_bars < 0) return(-1);
   if(counted_bars > 0) counted_bars--;
           limit = Bars-counted_bars;

   //
   //
   //
   //
   //

   for(i = limit; i >= 0; i--)
   {
      double atr    = iATR(NULL,0,period,i);
      double cprice = iMA(NULL,0,1,0,MODE_SMA,appliedPrice,i);
      double mprice = (High[i]+Low[i])/2;
             Up[i]  = mprice+multiplier*atr;
             Dn[i]  = mprice-multiplier*atr;

      //
      //
      //
      //
      //

      Direction[i] = Direction[i+1];
         if (cprice > Up[i+1]) Direction[i] =  1;
         if (cprice < Dn[i+1]) Direction[i] = -1;

      TrendU[i]  = EMPTY_VALUE;
      TrendUA[i] = EMPTY_VALUE;
      TrendD[i]  = EMPTY_VALUE;
      TrendDA[i] = EMPTY_VALUE;

         if (Direction[i] > 0) { Dn[i] = MathMax(Dn[i],Dn[i+1]); TrendU[i] = Dn[i]; if (Direction[i] != Direction[i+1]) TrendUA[i] = TrendU[i];}
         else                  { Up[i] = MathMin(Up[i],Up[i+1]); TrendD[i] = Up[i]; if (Direction[i] != Direction[i+1]) TrendDA[i] = TrendD[i];}
   }
   return(0);
}
Comments