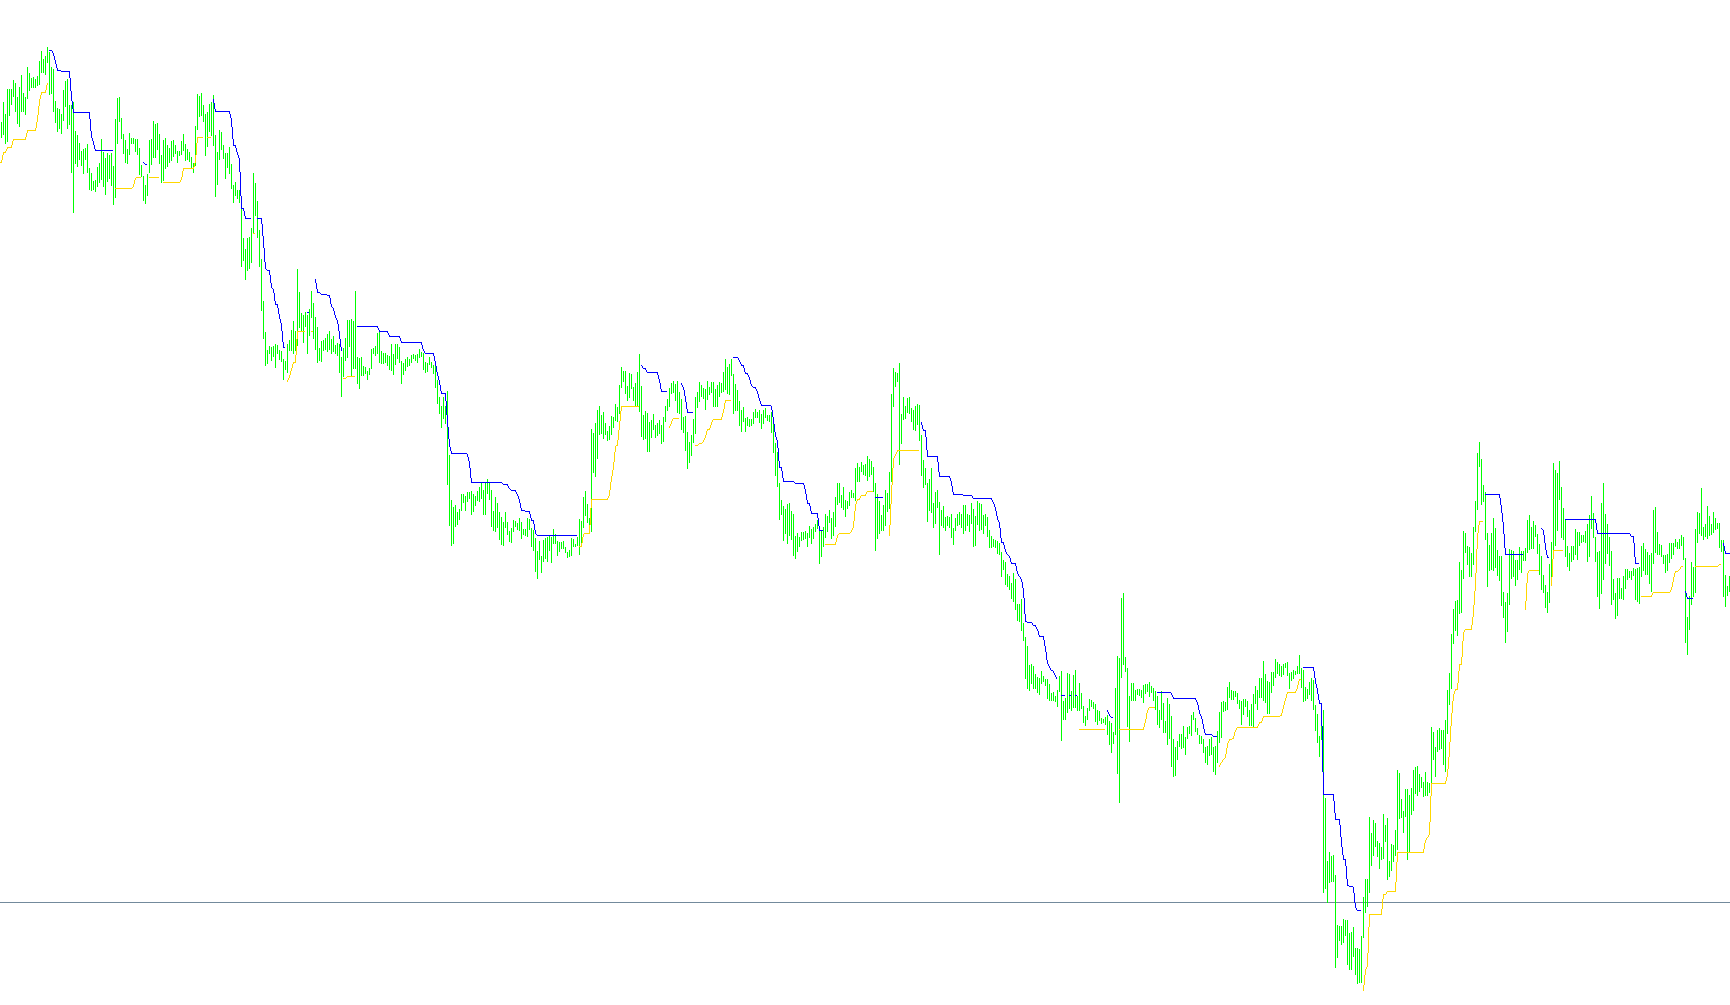
This tool is designed to help traders visually identify and follow market trends by plotting dynamic support and resistance levels. Unlike standard moving averages that simply smooth out price action, this indicator calculates "zones" based on actual market volatility to determine when a trend is likely shifting.
How the Logic Works
1. Volatility-Based Range Calculation The script begins by measuring the market's recent volatility using the Average True Range (ATR). It uses this measurement to create a safety buffer around recent price highs and lows. Instead of looking at a single point in time, it looks back over a specific window of recent candles to find the most significant "floor" (minimum) and "ceiling" (maximum) levels.
2. Trend Detection The core logic relies on price breakouts:
- Bullish Shift: If the current closing price moves above the identified "ceiling," the script recognizes a shift toward an upward trend.
- Bearish Shift: If the current closing price drops below the identified "floor," the script recognizes a shift toward a downward trend.
3. Dynamic Level Tracking Once a trend is established, the indicator doesn't just stay flat; it reacts to new data:
- In an Uptrend: The indicator tracks the "floor" level. If the price creates a new, higher floor, the indicator holds steady on the previous one until the price actually breaks through it. This prevents the indicator from "jittering" and provides a more stable visual guide for trailing stops.
- In a Downtrend: The indicator tracks the "ceiling" level. Similarly, it holds onto the highest resistance level until the market action forces a lower ceiling.
Visual Representation on Your Chart
The tool communicates these shifts through two distinct lines:
- The Upward Trend: Represented by a line tracking the support level below the price.
- The Downward Trend: Represented by a line tracking the resistance level above the price.
By using volatility (ATR) as the foundation, the logic automatically expands these levels during periods of high market activity and tightens them during quieter periods. This allows the tool to adapt to different market conditions—staying wide enough to avoid being "stopped out" by minor noise, but tight enough to react quickly to genuine trend reversals.
//+------------------------------------------------------------------+
//|                                                  ATRStops_v1.mq4 |
//|                                  Copyright © 2006, Forex-TSD.com |
//|                         Written by IgorAD,igorad2003@yahoo.co.uk |
//|            http://finance.groups.yahoo.com/group/TrendLaboratory |
//+------------------------------------------------------------------+
#property copyright "Copyright © 2006, Forex-TSD.com "
#property link      "http://www.forex-tsd.com/"

#property indicator_chart_window
#property indicator_buffers 2
#property indicator_color1 DodgerBlue
#property indicator_color2 Magenta


//---- input parameters
extern int    Length=7;
extern int    ATRperiod=9;
extern double Kv=2.5;

//---- indicator buffers
double UpBuffer1[];
double DnBuffer1[];
double smin[];
double smax[];
double trend[];
//+------------------------------------------------------------------+
//| Custom indicator initialization function                         |
//+------------------------------------------------------------------+
  int init()
  {
   string short_name;
//---- indicator line
   SetIndexStyle(0,DRAW_LINE);
   SetIndexStyle(1,DRAW_LINE);
   IndicatorBuffers(5);
   SetIndexBuffer(0,UpBuffer1);
   SetIndexBuffer(1,DnBuffer1);
   SetIndexBuffer(2,smin);
   SetIndexBuffer(3,smax);
   SetIndexBuffer(4,trend);
//---- name for DataWindow and indicator subwindow label
   short_name="ATRStops("+Length+")";
   IndicatorShortName(short_name);
   SetIndexLabel(0,"Up");
   SetIndexLabel(1,"Dn");
//----
   SetIndexDrawBegin(0,Length);
   SetIndexDrawBegin(1,Length);
//----
   return(0);
  }

//+------------------------------------------------------------------+
//| ATRStops_v1                                                     |
//+------------------------------------------------------------------+
int start()
  {

   int shift,limit, counted_bars=IndicatorCounted();

   if ( counted_bars > 0 )  limit=Bars-counted_bars;
   if ( counted_bars < 0 )  return(0);
   if ( counted_bars ==0 )  limit=Bars-Length-1;

	for(shift=limit;shift>=0;shift--)
   {
      smin[shift] = -100000; smax[shift] = 100000;
      for (int i = Length-1;i>=0;i--)
      {
      smin[shift] = MathMax( smin[shift], High[shift+i] - Kv*iATR(NULL,0,ATRperiod,shift+i));
      smax[shift] = MathMin( smax[shift], Low[shift+i] + Kv*iATR(NULL,0,ATRperiod,shift+i));
      }

	  trend[shift]=trend[shift+1];
	  if ( Close[shift] > smax[shift+1] ) trend[shift] =  1;
	  if ( Close[shift] < smin[shift+1] ) trend[shift] = -1;

	  if ( trend[shift] >0 )
	  {
	  if( smin[shift]<smin[shift+1] ) smin[shift]=smin[shift+1];
	  UpBuffer1[shift]=smin[shift];
	  DnBuffer1[shift] = EMPTY_VALUE;
	  }
	  if ( trend[shift] <0 )
	  {
	  if( smax[shift]>smax[shift+1] ) smax[shift]=smax[shift+1];
	  UpBuffer1[shift]=EMPTY_VALUE;
	  DnBuffer1[shift] = smax[shift];
	  }

	}
	return(0);
 }
Comments