ATRStops_v1.1_001
Download script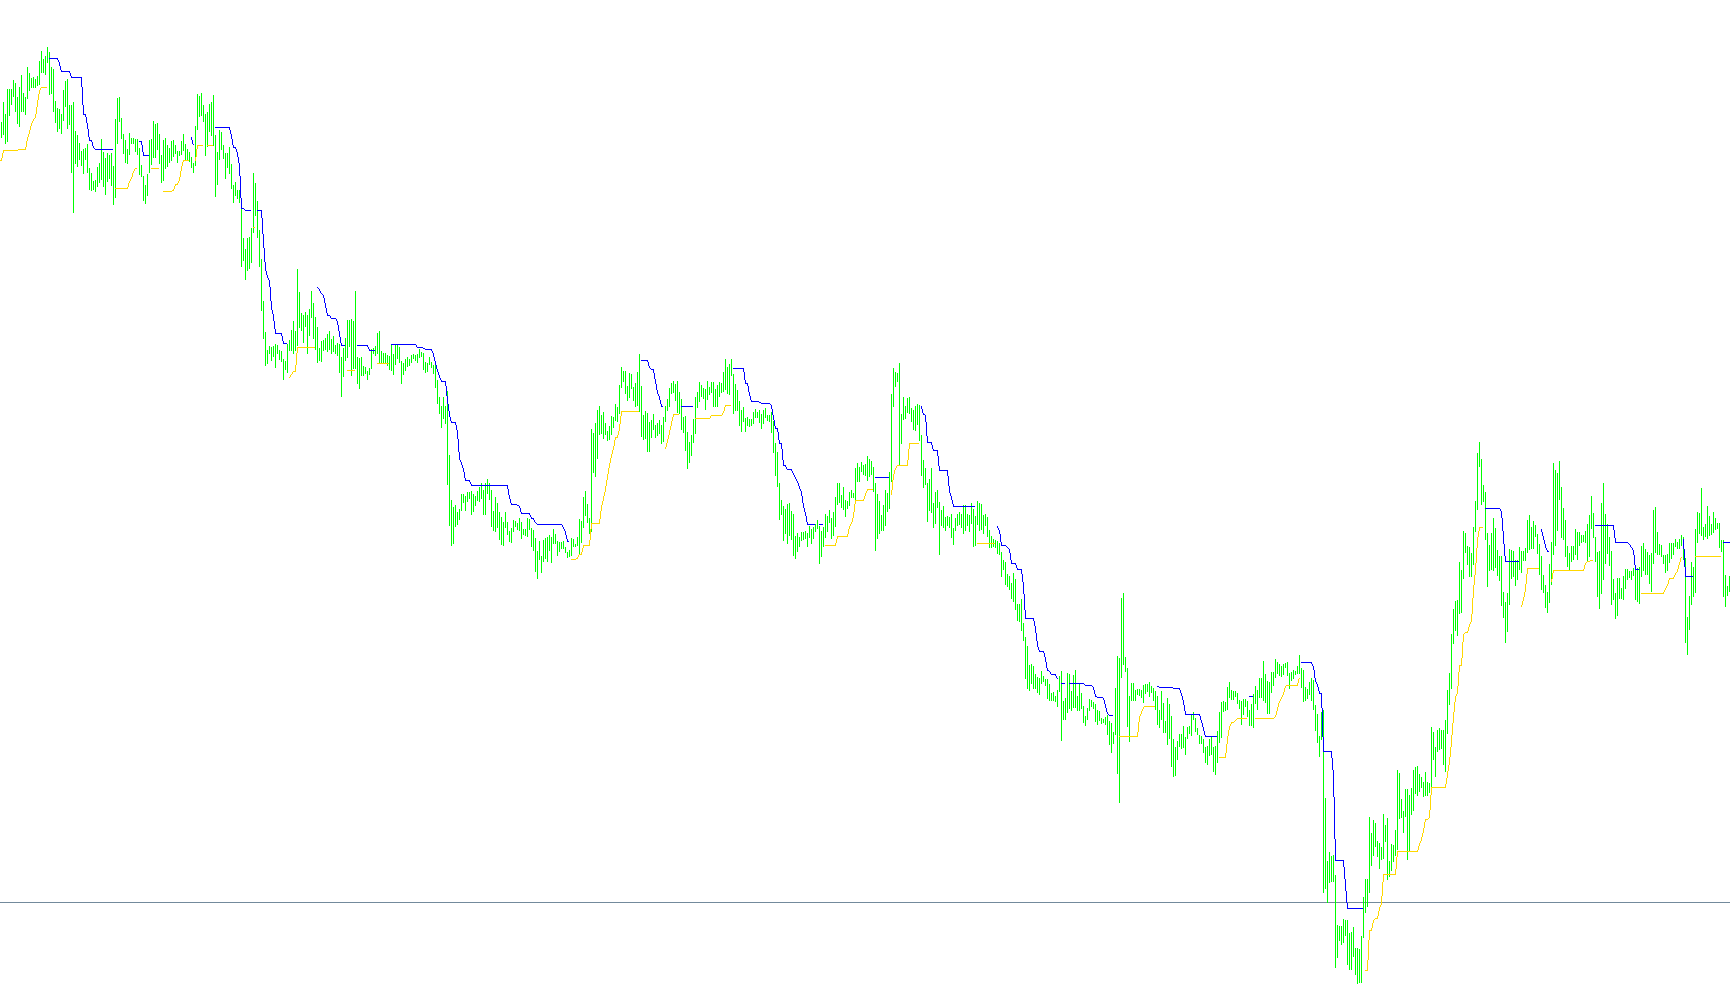
This tool is designed to help traders visualize market trends and identify potential "breakout" points by establishing dynamic support and resistance levels. Unlike static horizontal lines, this indicator adapts to the market's volatility, providing a more responsive way to see where price might encounter resistance or find stability.
Core Logic Overview
The script functions by analyzing price movement over a specific period to create a "floating" boundary. It calculates these boundaries based on two main factors: historical price extremes (the highs and lows of recent candles) and market volatility (how much the price is swinging).
By combining these two elements, the tool creates a protective zone that moves with the market. When the price remains within this zone, it suggests a continuing trend; when the price breaks through these boundaries, it signals a potential shift in market direction.
How the Boundaries are Calculated
To determine where the "top" and "bottom" of the current trend lie, the script performs the following steps:
- Volatility Adjustment: It looks at the average range of recent price movements (Average True Range). It then multiplies this by a specific sensitivity factor. This ensures that in a high-volatility market, the boundaries are wider, and in a calm market, they tighten.
- Price Extremes: It examines the highest highs and lowest lows over a user-defined lookback period. It subtracts or adds the volatility measurement to these points to establish a "safe" boundary.
- Trend Detection: The script compares the current closing price against the boundaries established in the previous candle. If the price closes above the upper boundary, it identifies an upward trend. If it closes below the lower boundary, it identifies a downward trend.
Visual Behavior on the Chart
The indicator provides clear visual feedback to help you navigate different market phases:
- Upward Trend: When the market is in a confirmed bullish state, a blue line appears on your chart. This represents the dynamic floor of the price action. A key feature here is that the line is "sticky"—it will only move up, never down, until a trend reversal is confirmed.
- Downward Trend: When the market shifts into a bearish state, a red line appears, representing the dynamic ceiling. Similar to the bullish side, this line will only move downward as the price descends, providing a visual limit for the selling pressure.
Key Takeaways for Traders
The primary goal of this logic is to filter out "market noise." By using volatility-adjusted boundaries, it helps traders avoid entering trades too early during minor fluctuations. It emphasizes sustained moves, showing you where the price has established new territory and providing a clear visual cue for when the trend might be exhausting or reversing.
//+------------------------------------------------------------------+
//|                                                  ATRStops_v1.mq4 |
//|                                  Copyright © 2006, Forex-TSD.com |
//|                         Written by IgorAD,igorad2003@yahoo.co.uk |
//|            http://finance.groups.yahoo.com/group/TrendLaboratory |
//+------------------------------------------------------------------+
#property copyright "Copyright © 2006, Forex-TSD.com "
#property link      "http://www.forex-tsd.com/"

#property indicator_chart_window
#property indicator_buffers 2
#property indicator_color1 Blue
#property indicator_color2 Red


//---- input parameters
extern int    Length=10;
extern int    ATRperiod=5;
extern double Kv=2.5;

//---- indicator buffers
double UpBuffer1[];
double DnBuffer1[];
double smin[];
double smax[];
double trend[];
//+------------------------------------------------------------------+
//| Custom indicator initialization function                         |
//+------------------------------------------------------------------+
  int init()
  {
   string short_name;
//---- indicator line
   SetIndexStyle(0,DRAW_LINE);
   SetIndexStyle(1,DRAW_LINE);
   IndicatorBuffers(5);
   SetIndexBuffer(0,UpBuffer1);
   SetIndexBuffer(1,DnBuffer1);
   SetIndexBuffer(2,smin);
   SetIndexBuffer(3,smax);
   SetIndexBuffer(4,trend);
//---- name for DataWindow and indicator subwindow label
   short_name="ATRStops("+Length+")";
   IndicatorShortName(short_name);
   SetIndexLabel(0,"Up");
   SetIndexLabel(1,"Dn");
//----
   SetIndexDrawBegin(0,Length);
   SetIndexDrawBegin(1,Length);
//----
   return(0);
  }

//+------------------------------------------------------------------+
//| ATRStops_v1                                                     |
//+------------------------------------------------------------------+
int start()
  {

   int shift,limit, counted_bars=IndicatorCounted();

   if ( counted_bars > 0 )  limit=Bars-counted_bars;
   if ( counted_bars < 0 )  return(0);
   if ( counted_bars ==0 )  limit=Bars-Length-1;

	for(shift=limit;shift>=0;shift--)
   {
      smin[shift] = -100000; smax[shift] = 100000;
      for (int i = Length-1;i>=0;i--)
      {
      smin[shift] = MathMax( smin[shift], High[shift+i] - Kv*iATR(NULL,0,ATRperiod,shift+i));
      smax[shift] = MathMin( smax[shift], Low[shift+i] + Kv*iATR(NULL,0,ATRperiod,shift+i));
      }

	  trend[shift]=trend[shift+1];
	  if ( Close[shift] > smax[shift+1] ) trend[shift] =  1;
	  if ( Close[shift] < smin[shift+1] ) trend[shift] = -1;

	  if ( trend[shift] >0 )
	  {
	  if( smin[shift]<smin[shift+1] ) smin[shift]=smin[shift+1];
	  UpBuffer1[shift]=smin[shift];
	  DnBuffer1[shift] = EMPTY_VALUE;
	  }
	  if ( trend[shift] <0 )
	  {
	  if( smax[shift]>smax[shift+1] ) smax[shift]=smax[shift+1];
	  UpBuffer1[shift]=EMPTY_VALUE;
	  DnBuffer1[shift] = smax[shift];
	  }

	}
	return(0);
 }
Comments