ma_cross_alert_once_b
Indicator

ma_cross_alert_once_b

iATRiMA

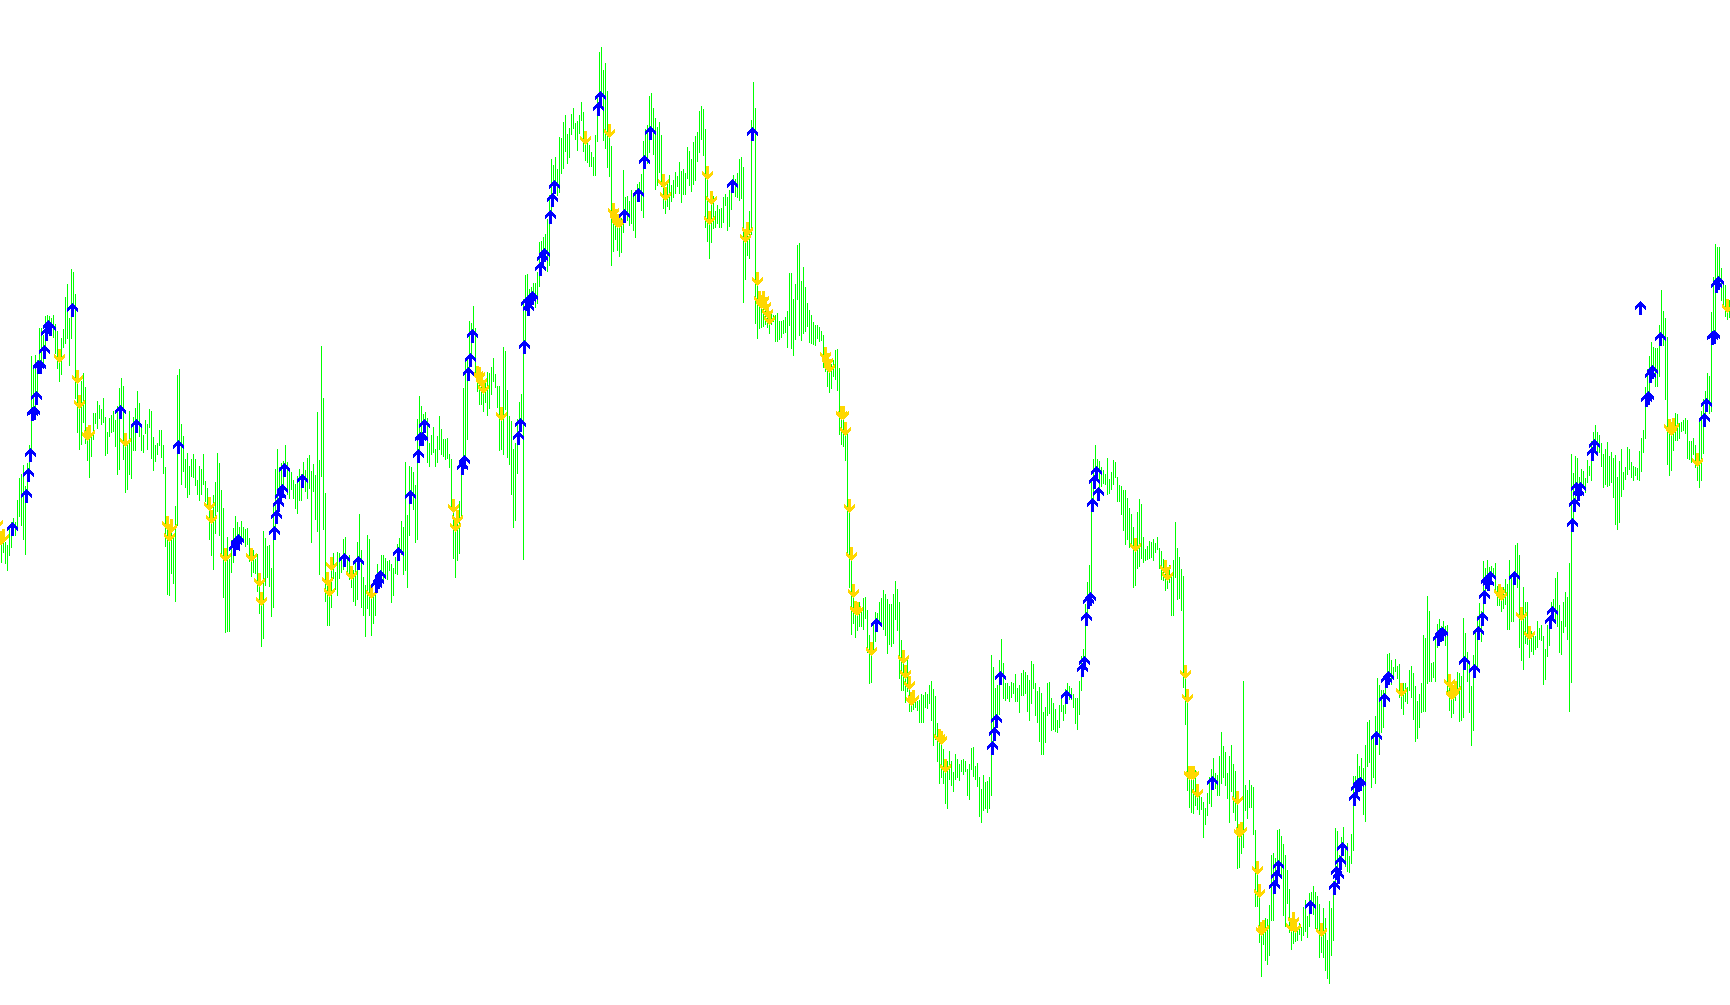
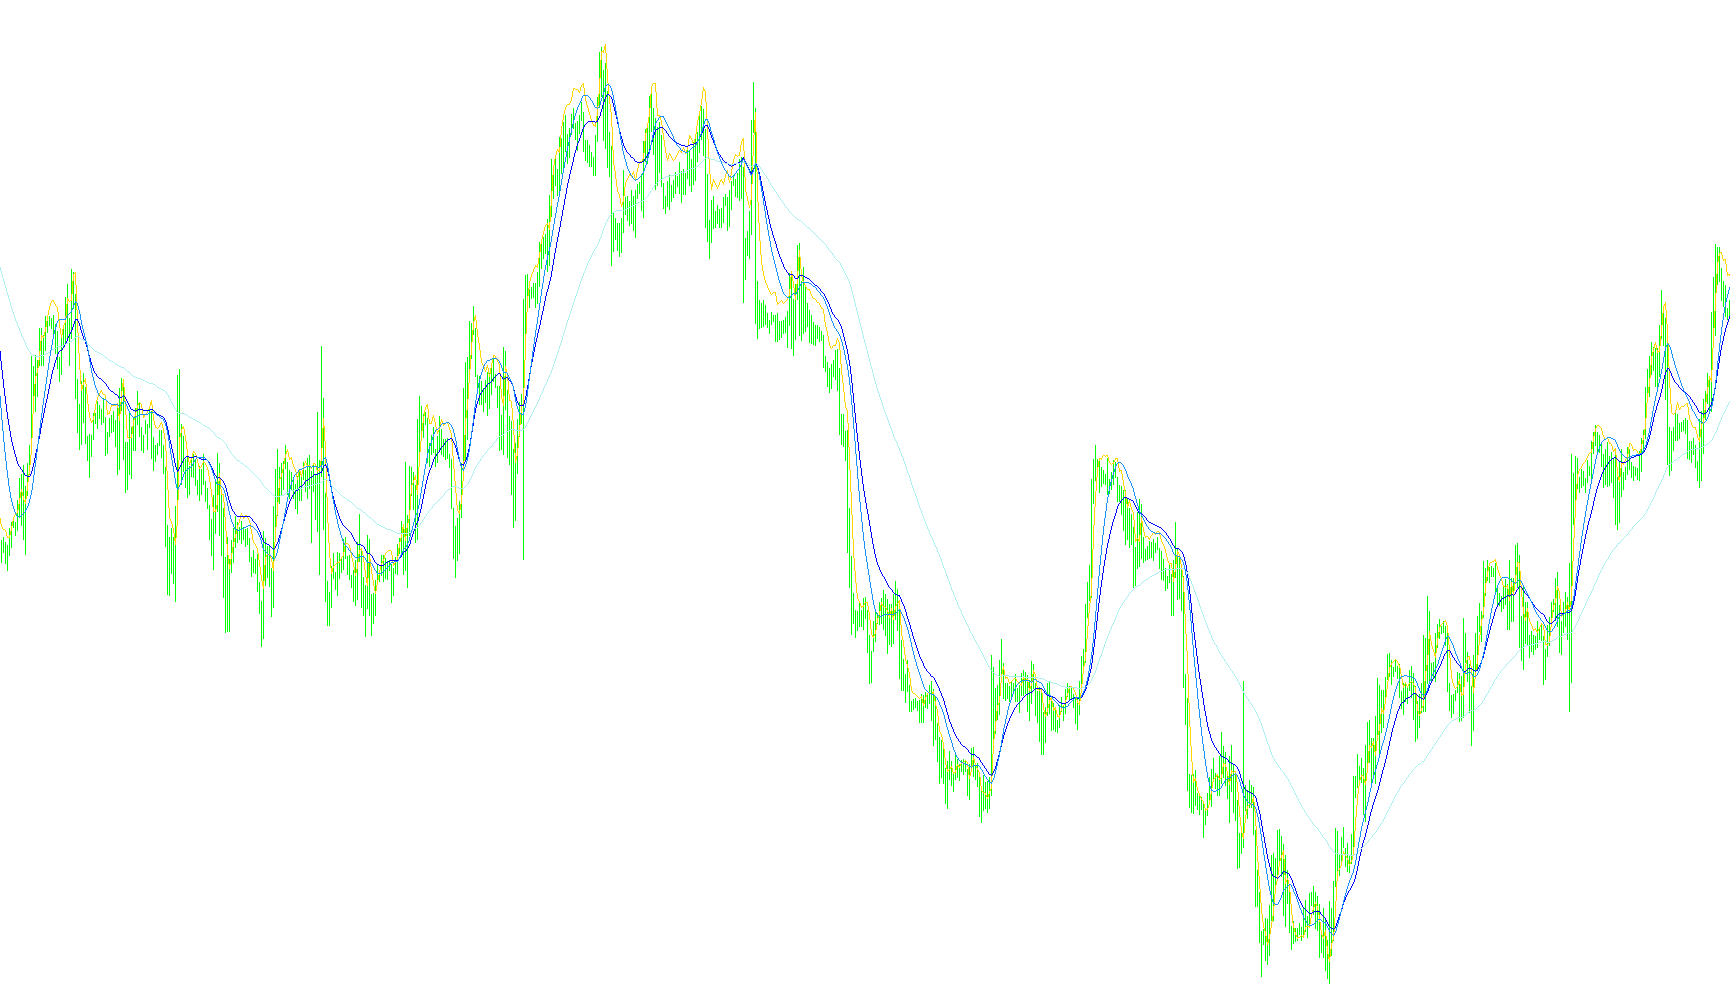
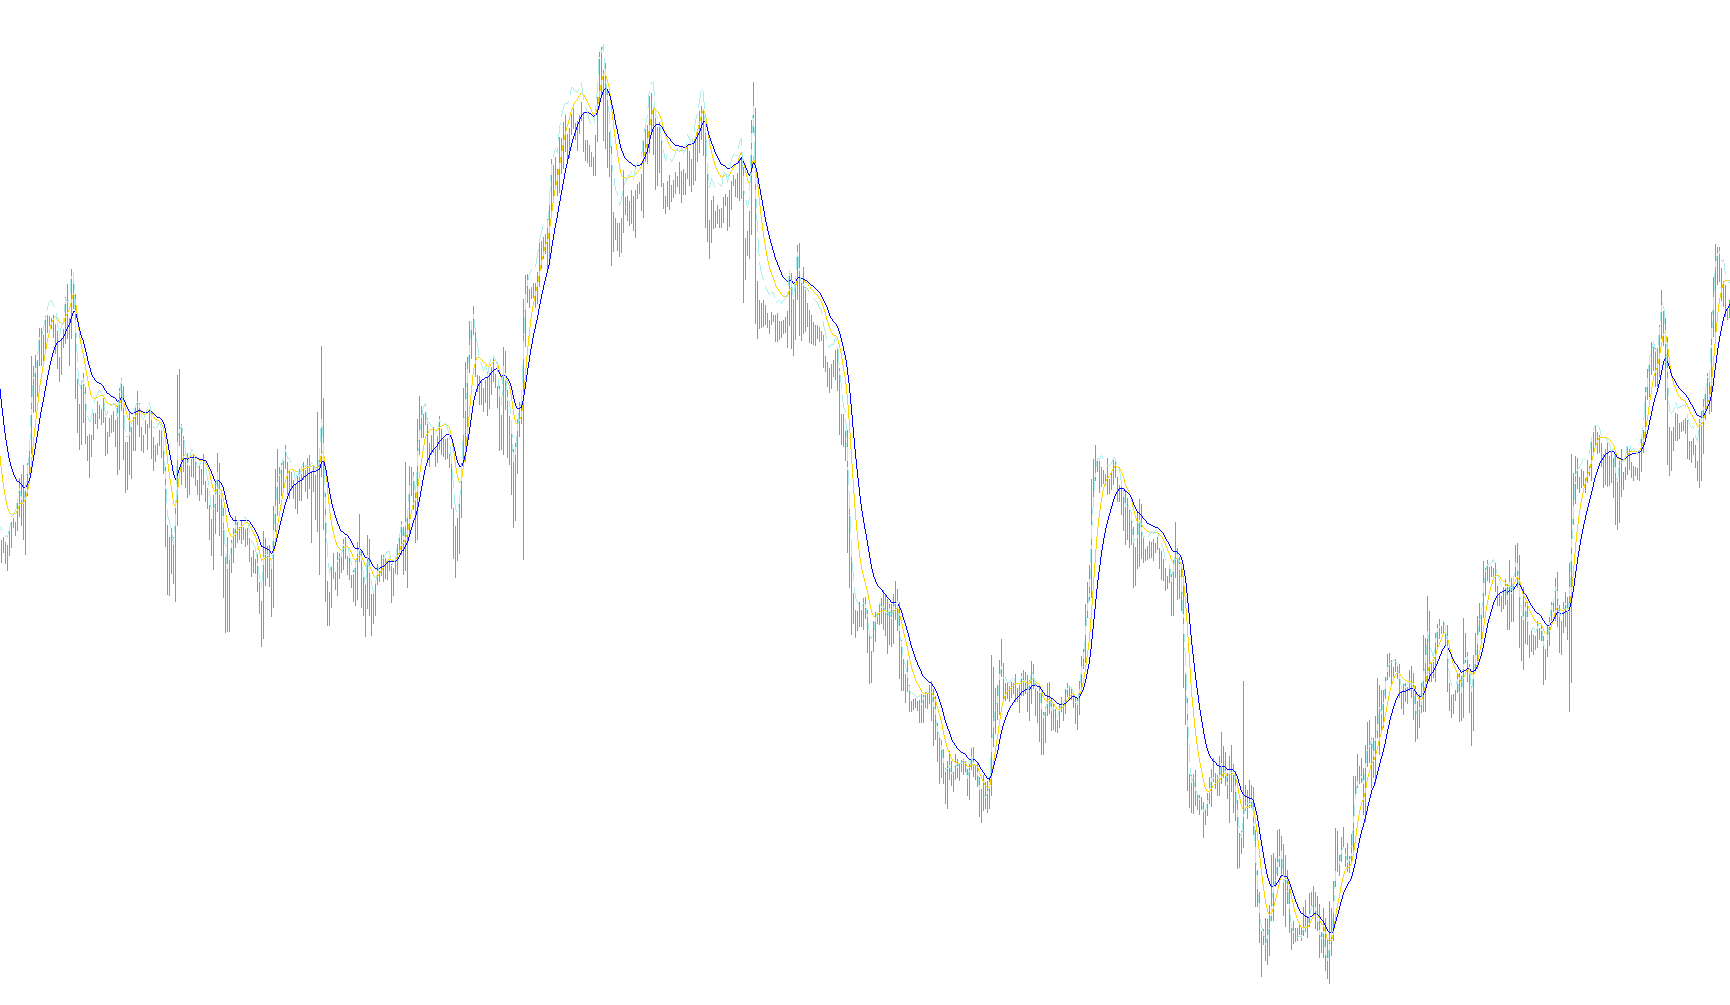
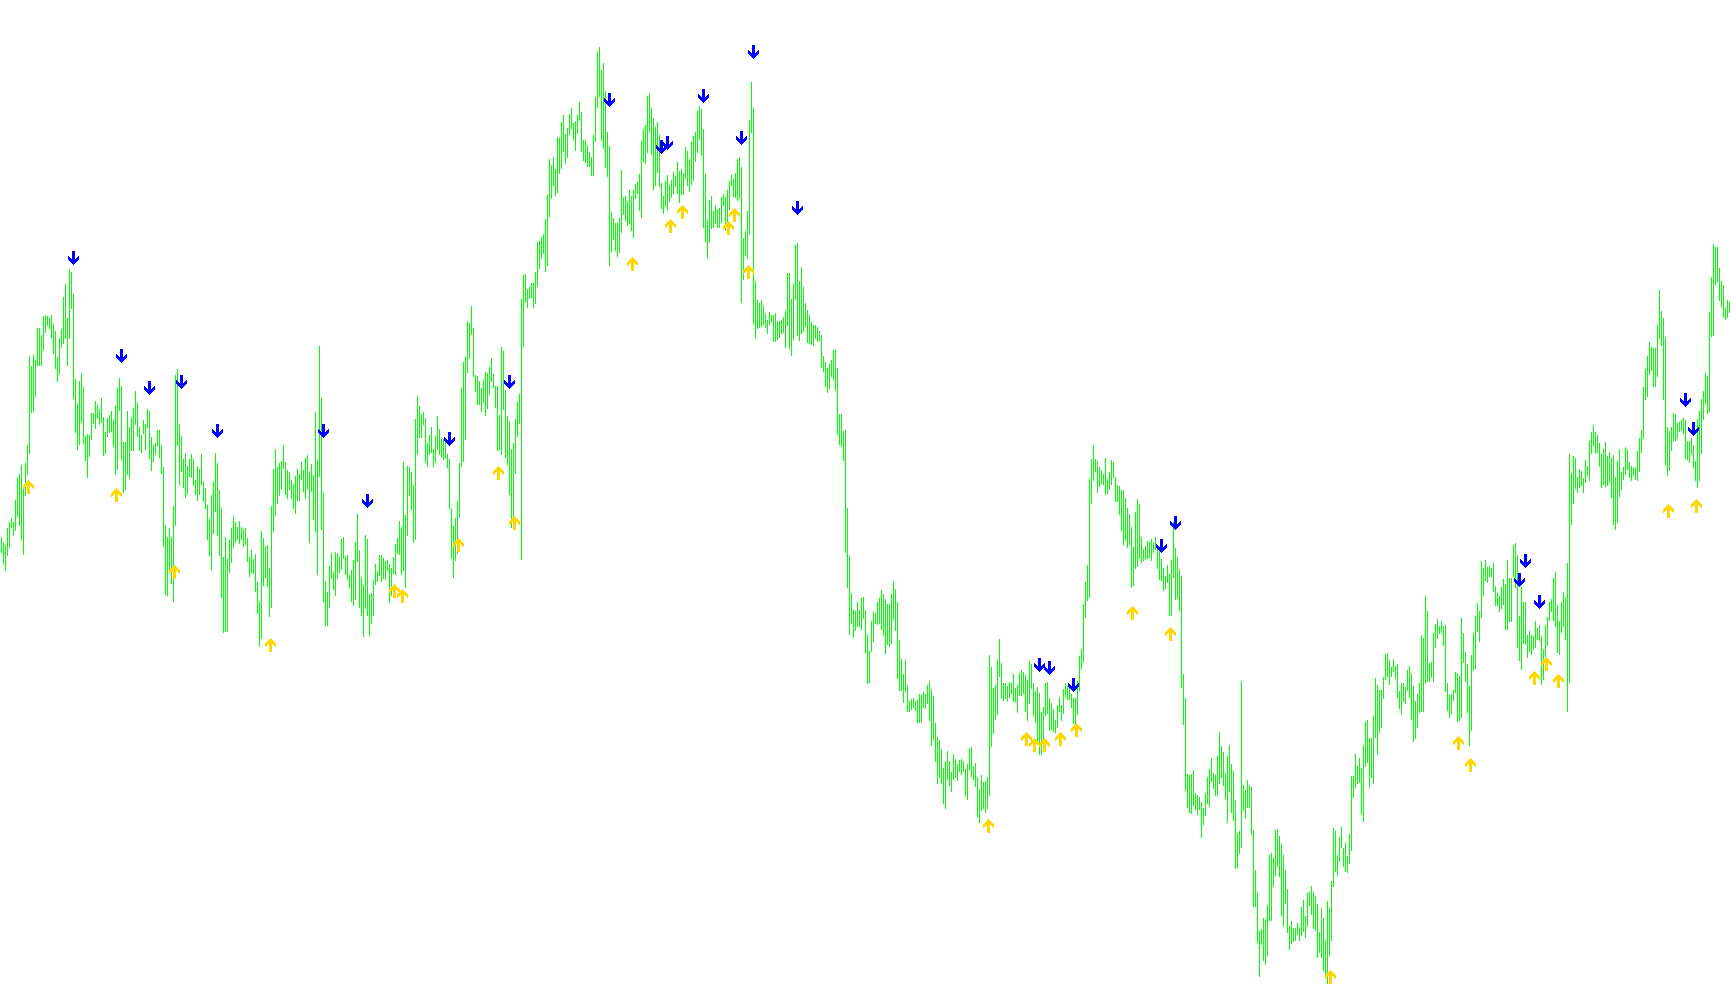
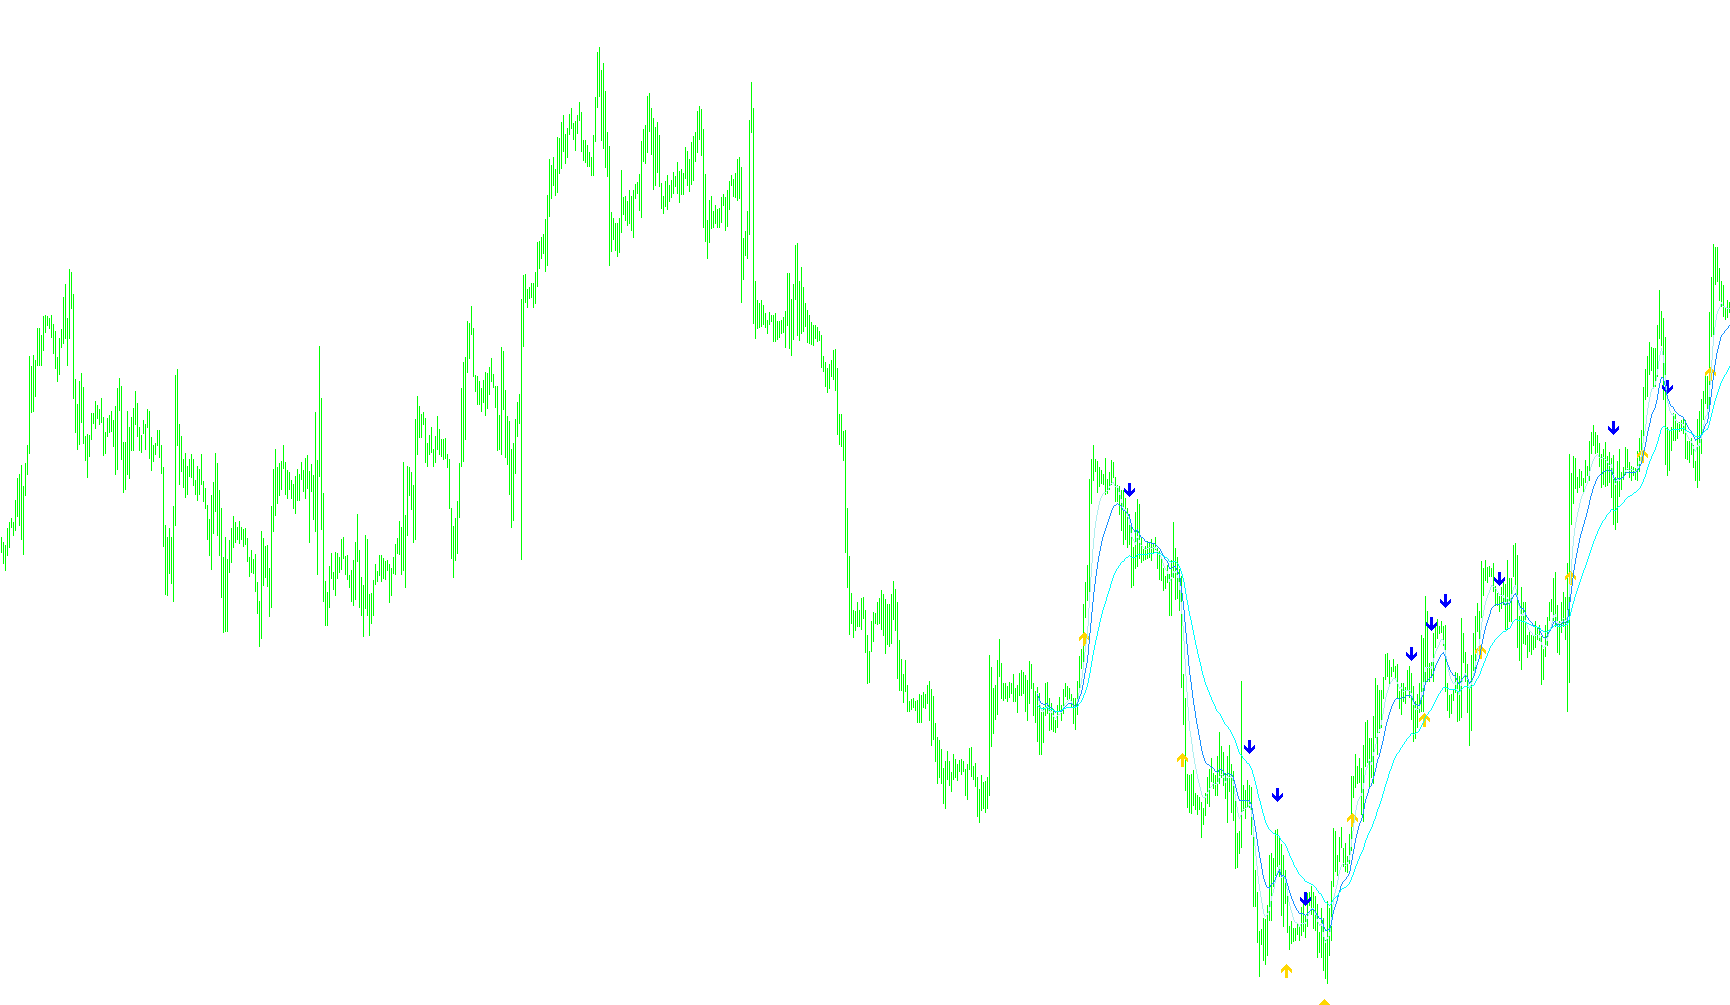
This indicator detects momentum shifts by identifying the intersection of two moving averages and triggers a single visual arrow and multi-channel notification for each unique crossover event.
MA_Dash_Cobra
Indicator

MA_Dash_Cobra

iMA

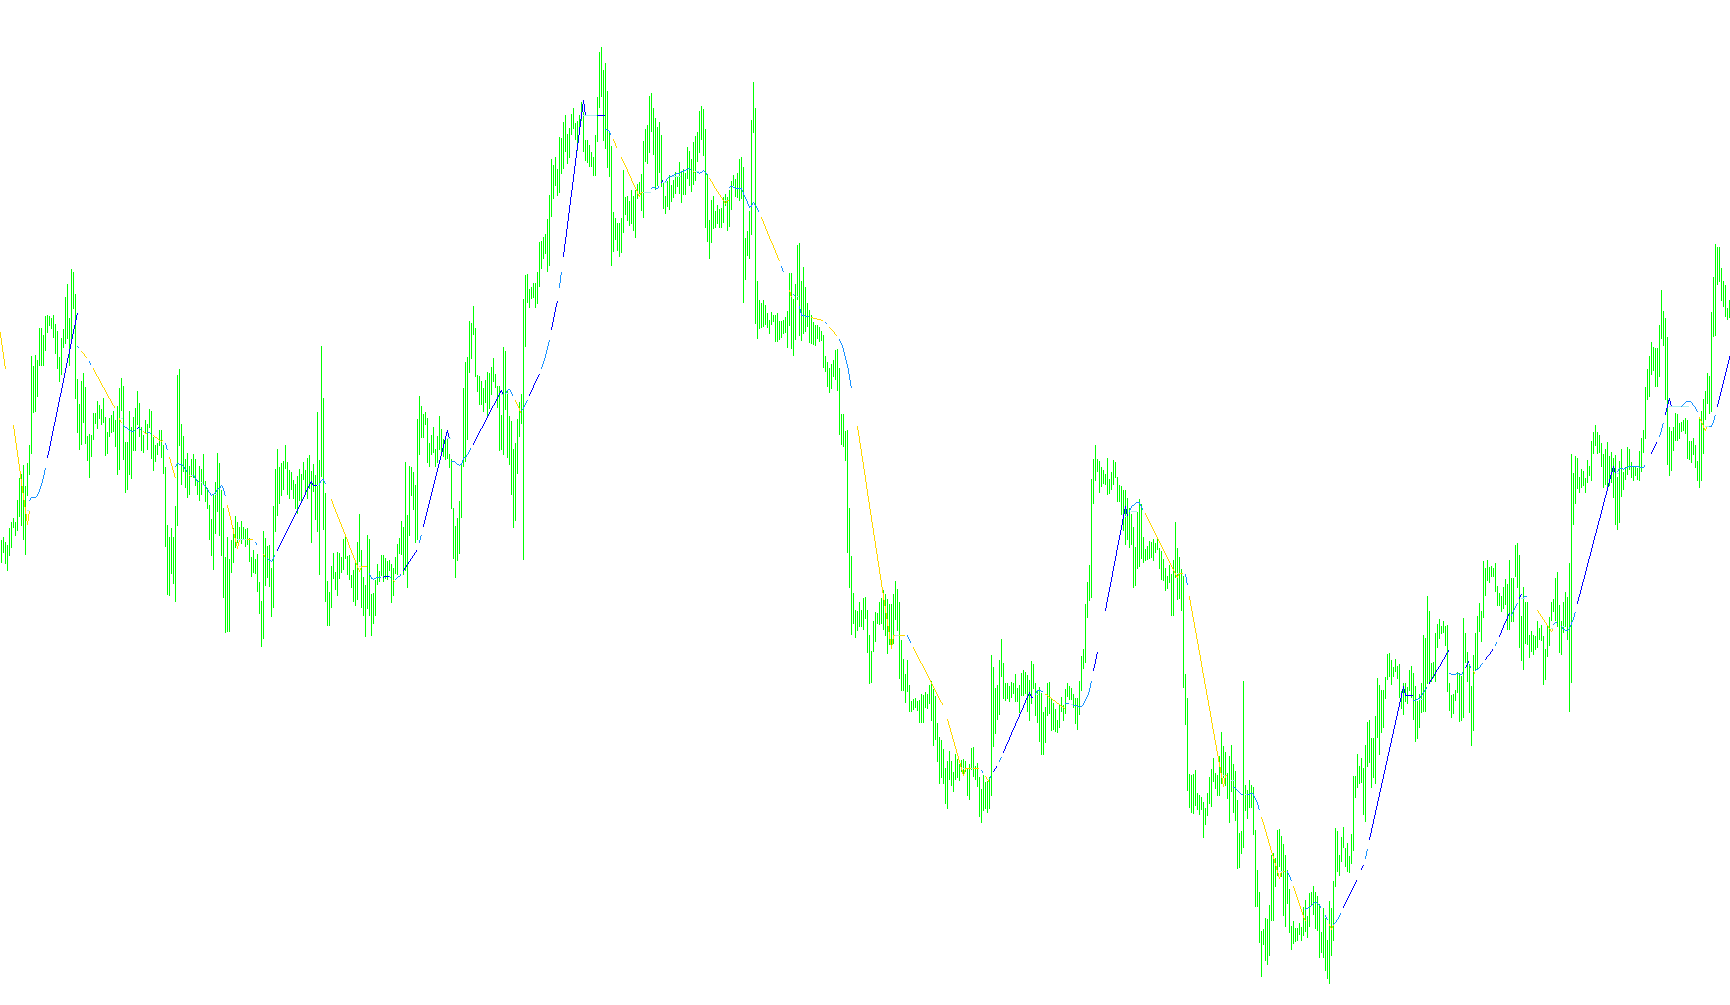
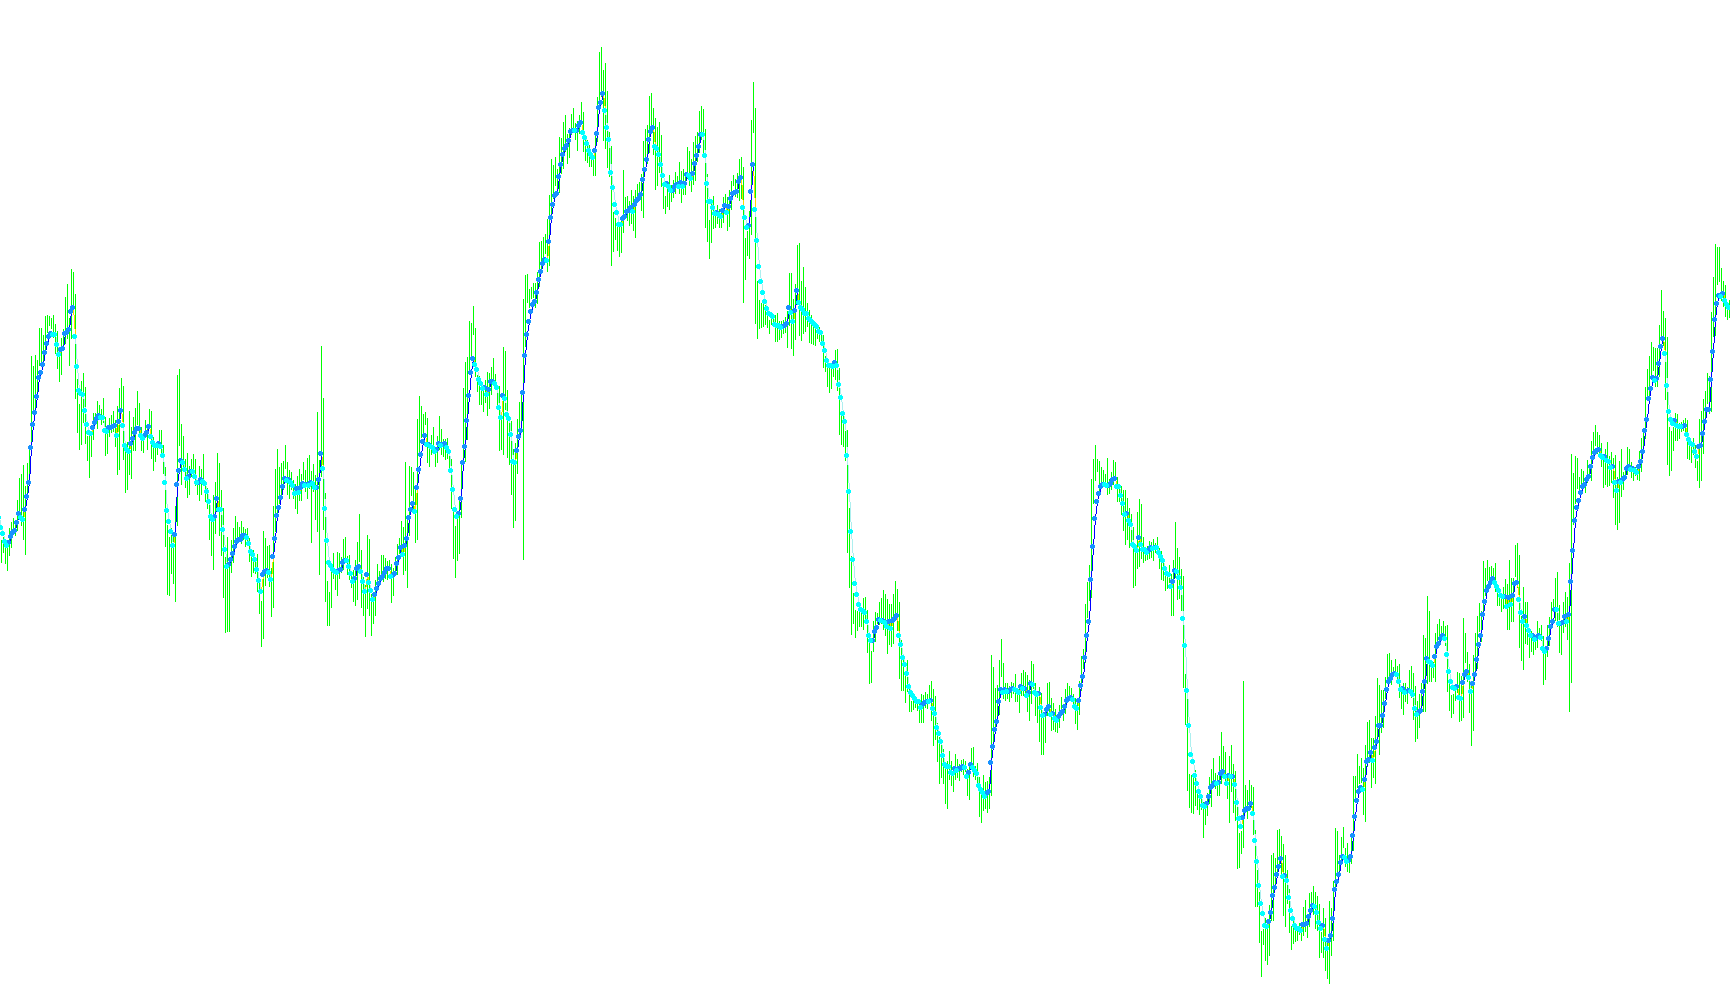
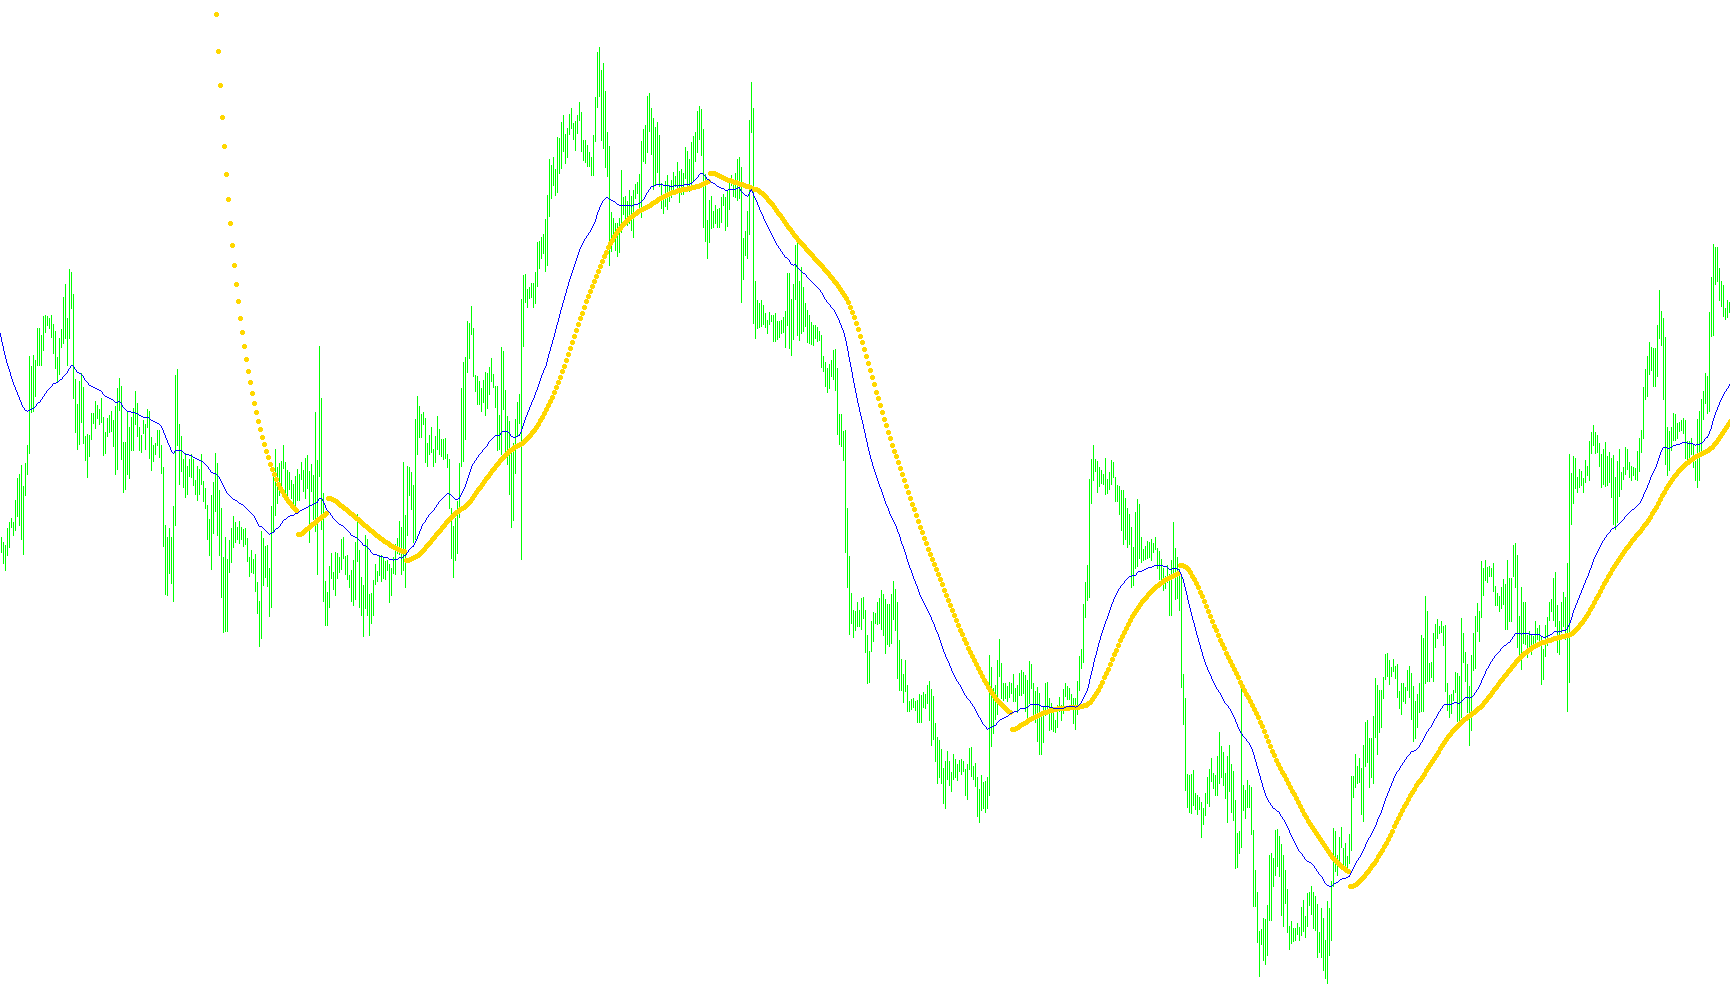
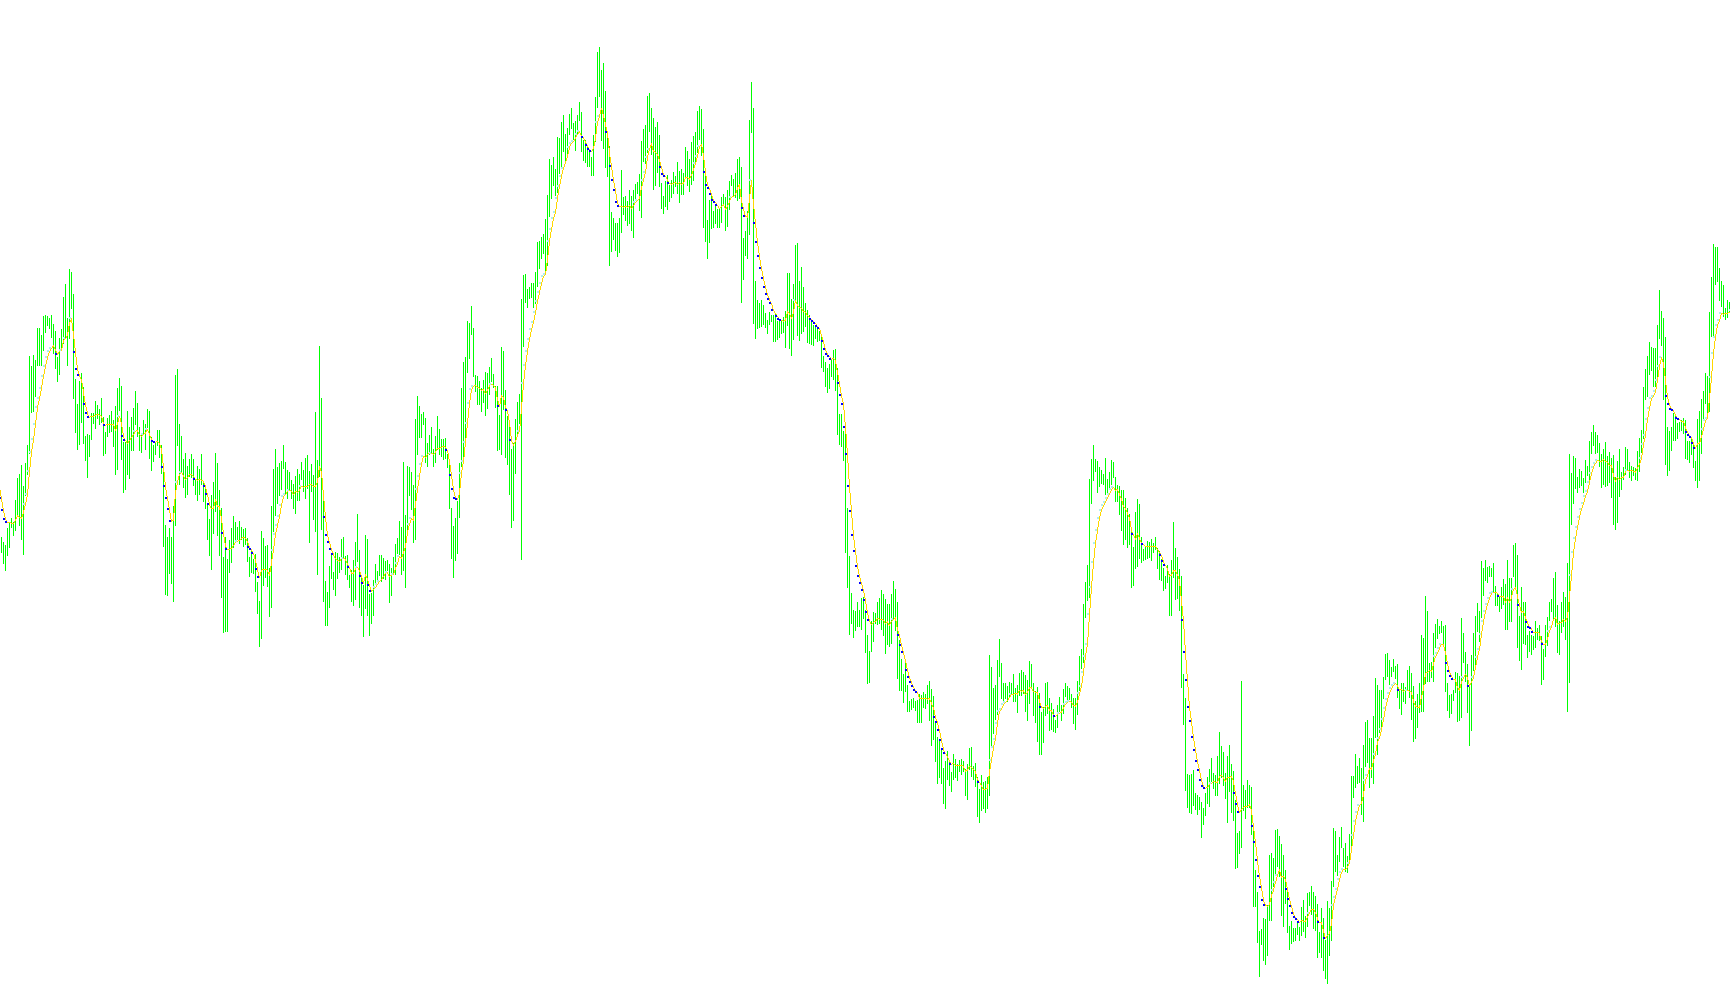
This indicator identifies structural shifts by rendering a moving average line only when it maintains continuity without immediate subsequent data points, effectively highlighting trend breaks.

MA_Dash_Cobra_v1
Indicator

MA_Dash_Cobra_v1

iMA

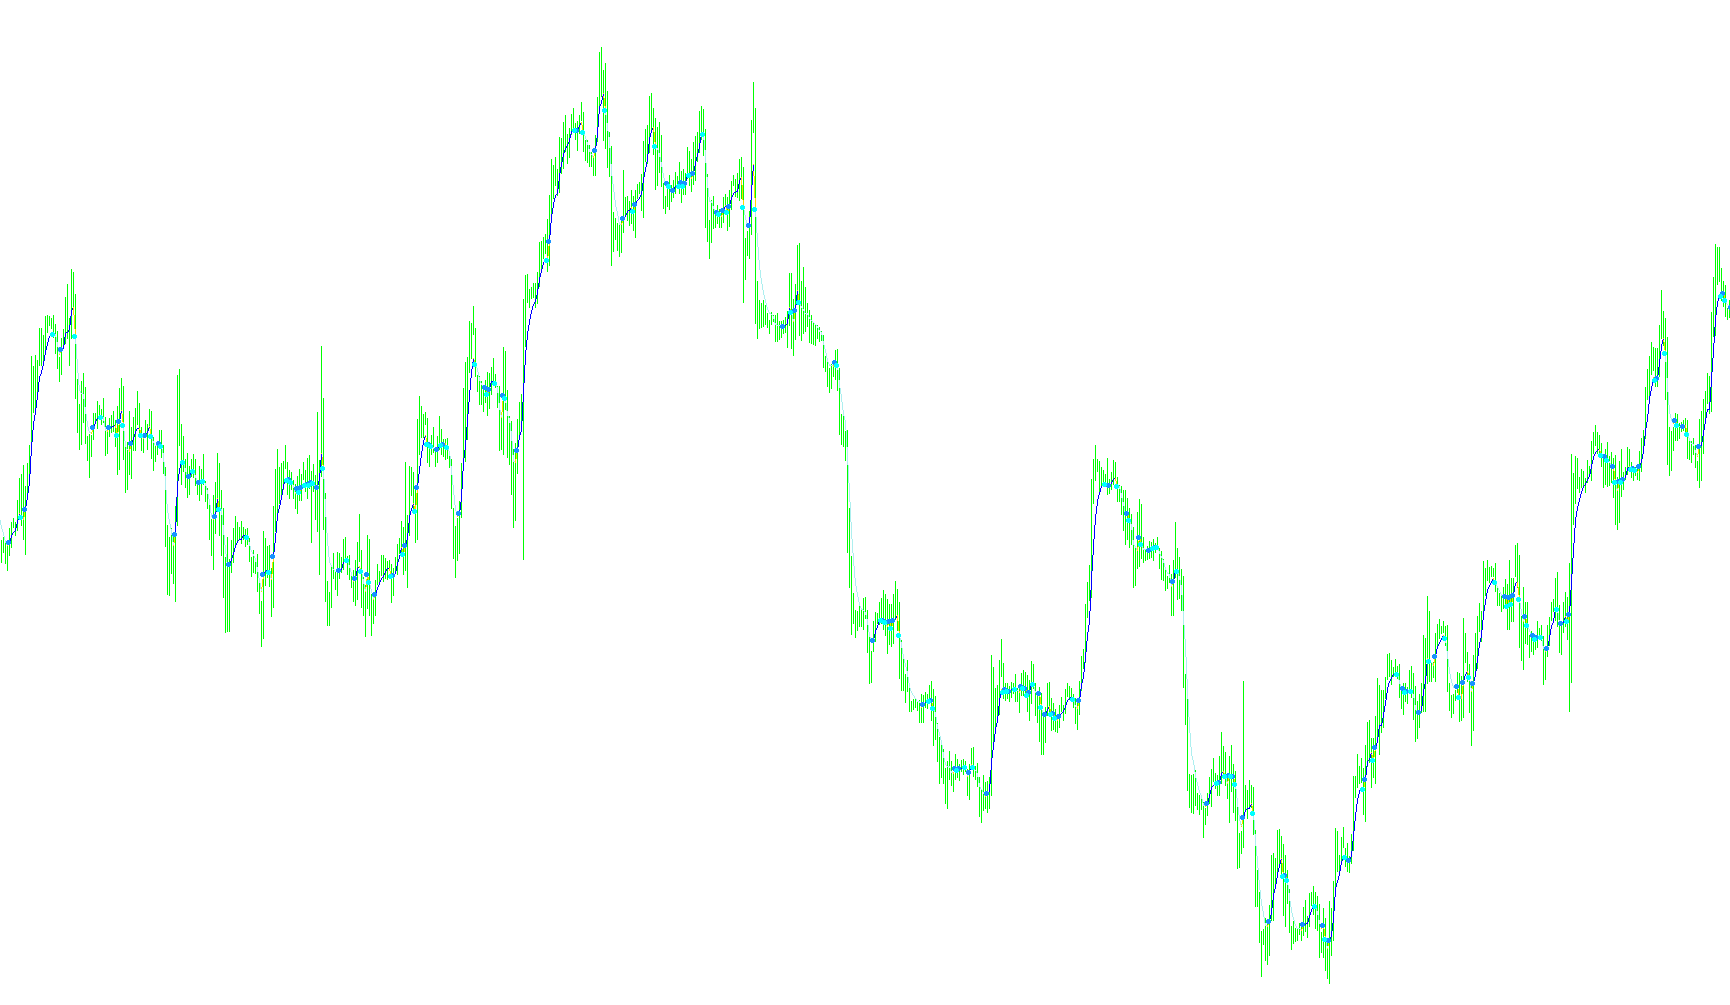
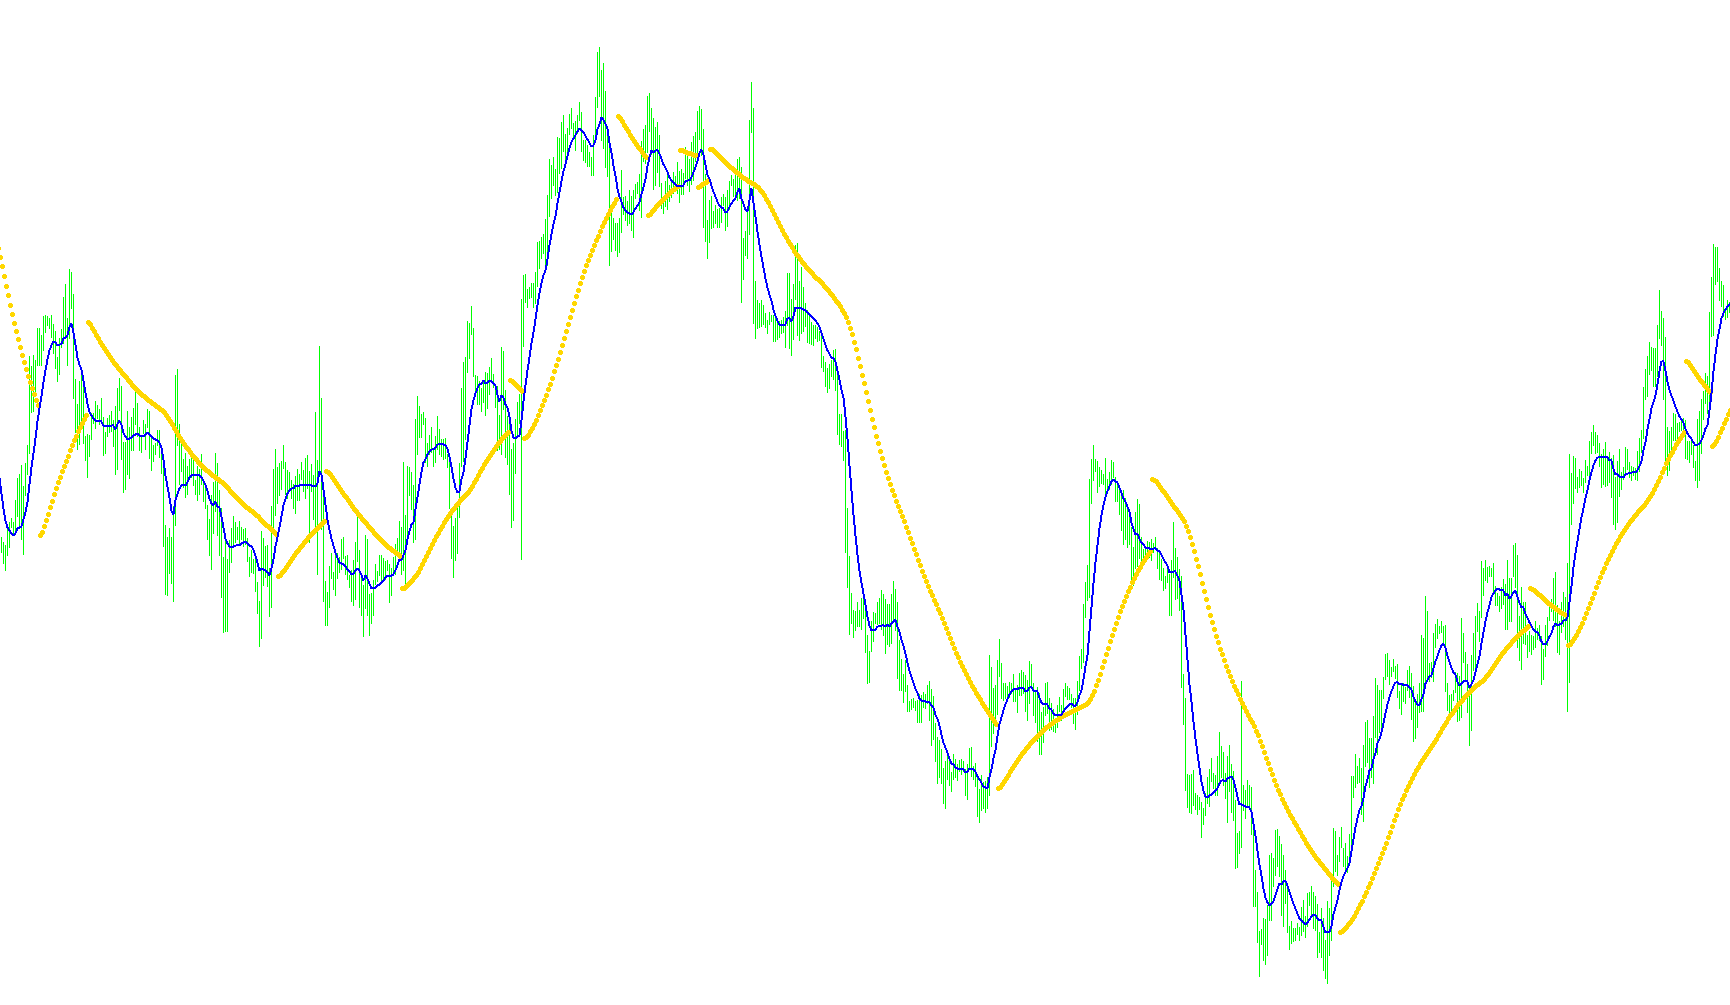
This indicator identifies and highlights specific structural breaks or gaps in the moving average progression by filtering out consecutive continuous data points.

MA_Details
Indicator

MA_Details

iMA

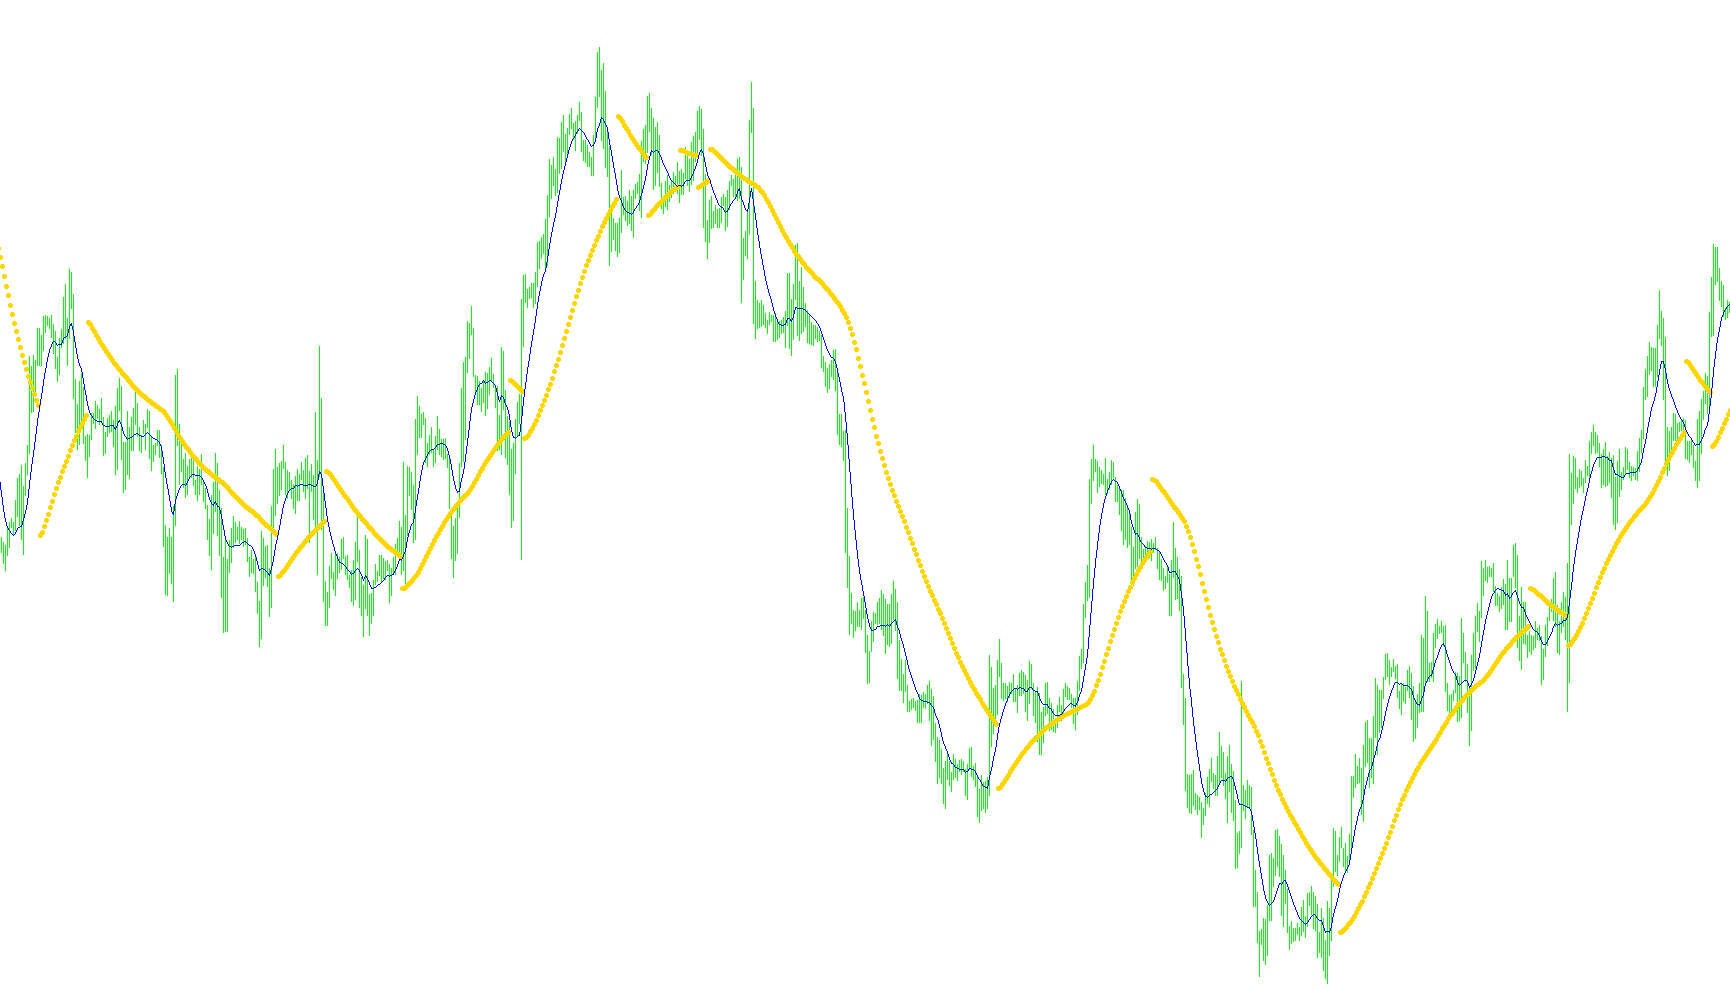
This indicator computes and visualizes real-time moving averages using selectable smoothing algorithms and price source inputs with a dynamic text overlay.

ma_dex_Angle_MA_v3
Indicator

ma_dex_Angle_MA_v3

iMA

This indicator dynamically tracks moving average momentum by projecting linear trajectories based on slope velocity and locking into horizontal plateaus upon price crossovers.

MA_directionALERT3
Indicator

MA_directionALERT3

iMA

Identifies momentum shifts by detecting localized peaks and troughs in moving average values to trigger real-time trend reversals.

Ma_Distance_From_Price
Indicator

Ma_Distance_From_Price

iMA

This indicator identifies significant price-to-moving-average deviations by plotting directional arrows when the current price exceeds a specified pip buffer from the calculated moving average.

Ma_Distance_From_Price_v1
Indicator

Ma_Distance_From_Price_v1

iMA

Identifies potential trend exhaustion by signaling when the moving average deviates beyond a specific pip-based threshold from the price extremes.

Ma_Distance_From_Price_v2
Indicator

Ma_Distance_From_Price_v2

iMA

This indicator plots directional arrows when the price action establishes a significant spatial divergence from its moving average by exceeding a predefined pip threshold.

MA_filter_6MA_FlatTrend_direct
Indicator

MA_filter_6MA_FlatTrend_direct

iMA

This indicator visualizes market bias by evaluating the concurrent bullish or bearish alignment of six distinct moving averages to identify high-probability trend persistence.

MA_Gideon
Indicator

MA_Gideon

iMAiMAOnArray

The indicator generates trend dynamics by applying nested smoothing techniques including SMMA and LWMA layers over an initial EMA trigger signal.

MA_Gideon2
Indicator

MA_Gideon2

iMAiMAOnArray

This indicator generates momentum signals by applying sequential Smoothed Moving Averages and Linear Weighted Moving Averages over an initial Exponential Moving Average of opening prices.

ma_hl_sw
Indicator

ma_hl_sw

iMA

This indicator identifies bullish and bearish market shifts by detecting when high and low smoothed moving average bounds cross or align relative to a predefined threshold.

Indicator

ma_i-CA

iMAiStdDev
MA_In_Color
Indicator

MA_In_Color

iMA

This indicator dynamically renders a multi-modal moving average where the line color transitions visually to signal bullish or bearish momentum shifts based on price velocity.

MA_in_Color_001
Indicator

MA_in_Color_001

iMA

This indicator dynamically shifts the visual color of a selected moving average based on its directional slope to highlight real-time trend momentum.

MA_in_color_d
Indicator

MA_in_color_d

iMA

This indicator dynamically shifts the visual color of a customizable moving average to reflect real-time bullish and bearish slope transitions.

MA_in_color_ld
Indicator

MA_in_color_ld

iMA

This indicator visualizes momentum shifts by dynamically changing the color and shape of a multi-mode moving average line based on its slope trajectory.

MA_kanal
Indicator

MA_kanal

iEnvelopesiMA

This indicator plots dynamic trend envelopes based on varying Fibonacci ratios and SMA averages to project multi-layered support and resistance zones.

ma_kino_Price-4MA
Indicator

ma_kino_Price-4MA

iMA

Quantifies the relative variance between current price action and a multi-layered moving average matrix to identify momentum strength and trend sustainability.

Indicator

MA_Lmtf

iMA
Indicator

MA_Lmtf_001

iMA
Indicator

MA_Lmtf_sw

iMA
ma_MA_Slope_SigMA_roc
Indicator

ma_MA_Slope_SigMA_roc

iMAiMAOnArray

This indicator calculates the percentage change of a moving average relative to its previous period and applies a secondary smoothing filter to identify momentum trends.

MA_Mirror
Indicator

MA_Mirror

iMA

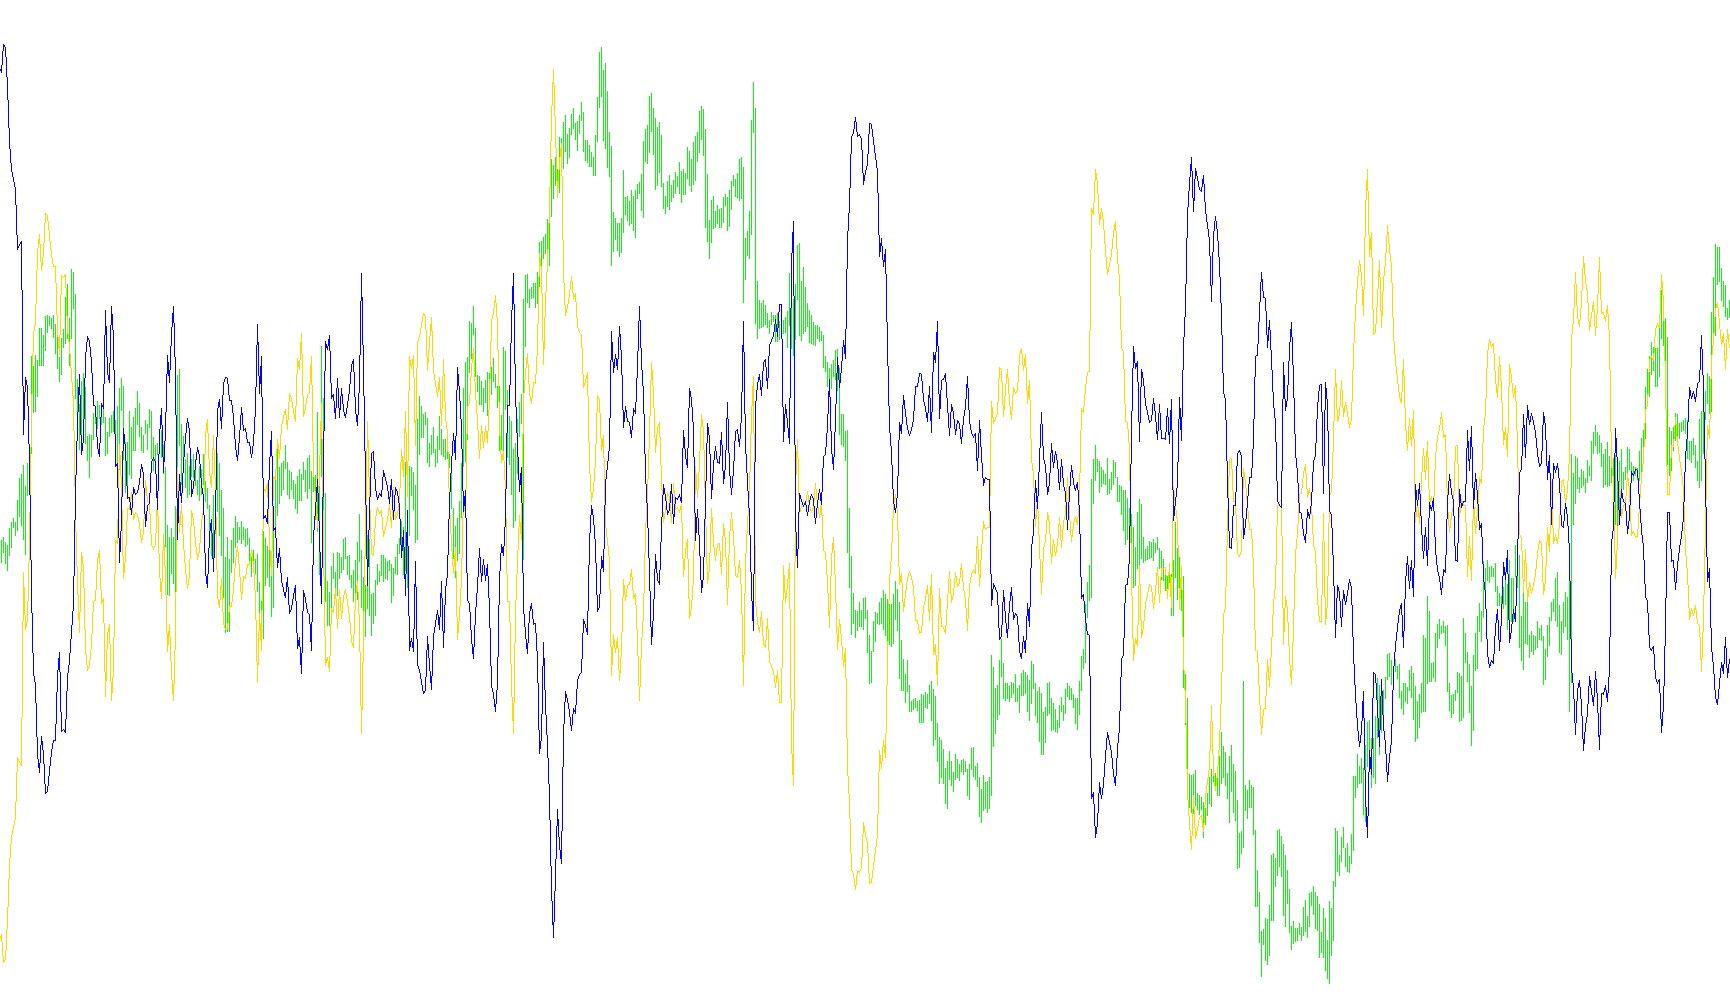
The indicator quantifies price momentum by calculating the differential between Simple Moving Average values derived from closing prices versus those derived from opening prices.

Indicator

MA_Money_Grub_grab_grid_or_whatever_v1

iMA
MA_monika_SAR
Indicator

MA_monika_SAR

iMAiSAR

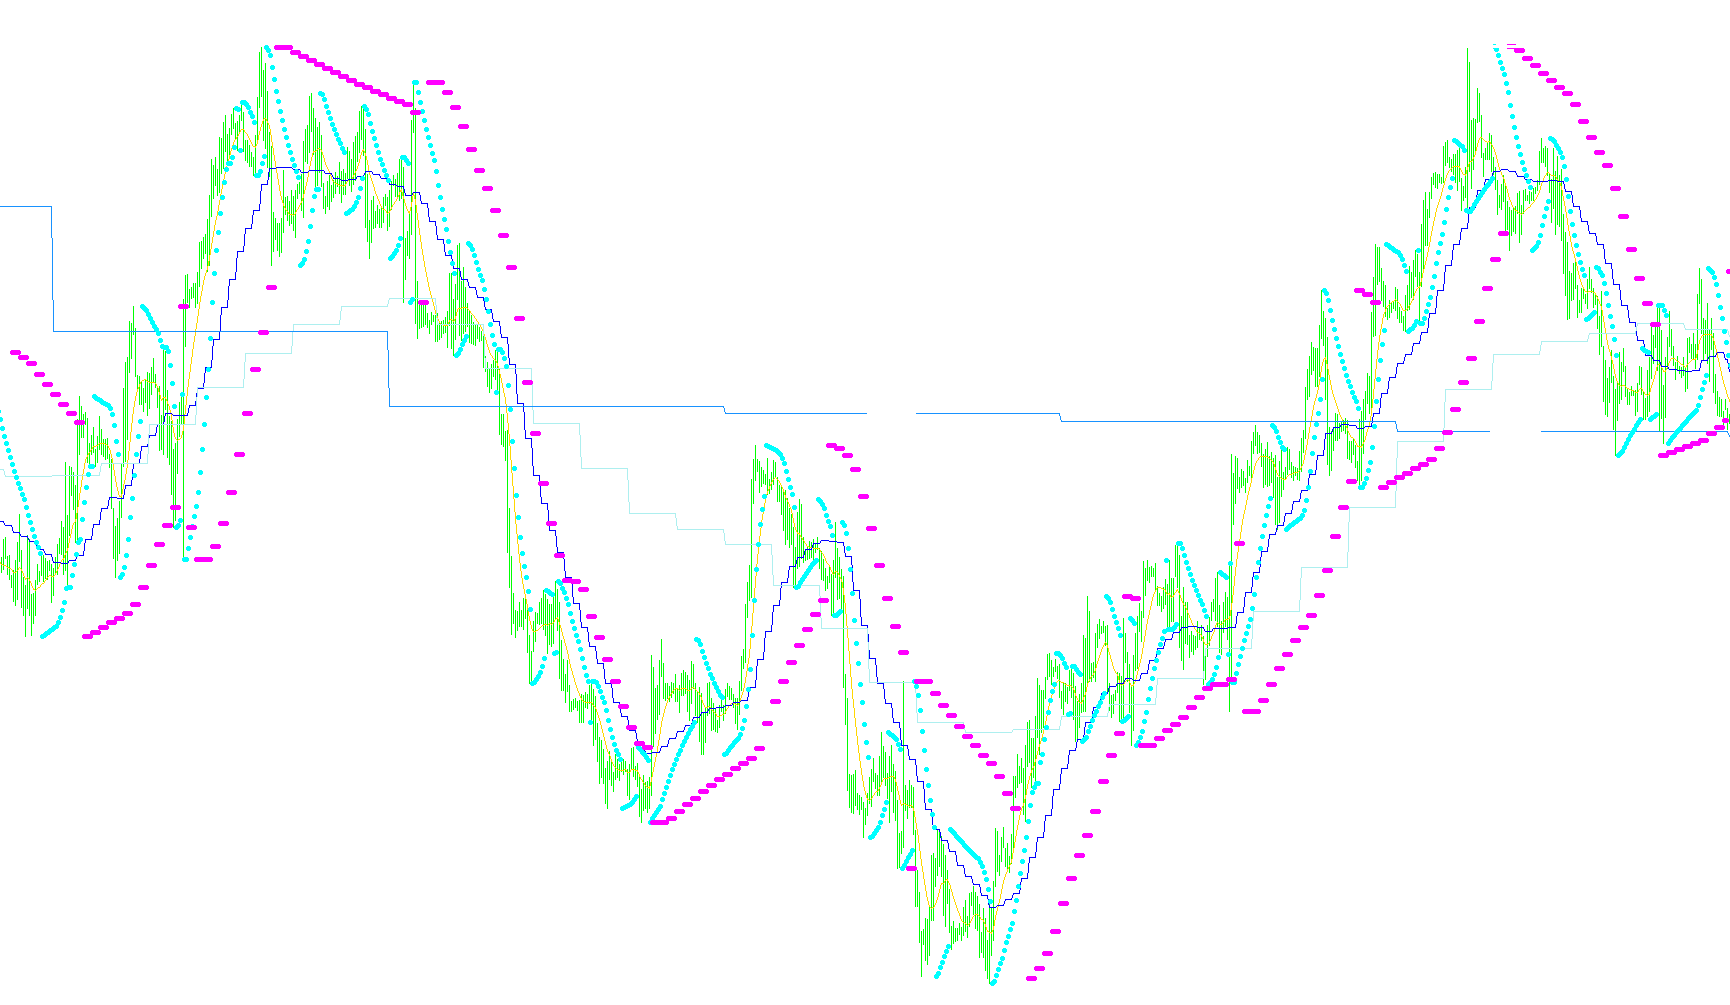
This indicator synchronizes Moving Average dynamics and Parabolic SAR reversal signals across four nested temporal horizons to provide a unified view of overarching market momentum.

MA_MTF_MovingAverage_v1.1_HrzLn+Dev+Lv
Indicator

MA_MTF_MovingAverage_v1.1_HrzLn+Dev+Lv

iMA

This indicator projects moving average calculations from higher timeframes onto the current chart, incorporating custom price deviations and horizontal level offsets for multi-layered trend analysis.

MA_MTF_MovingAverage_v1.1_HrzLn
Indicator

MA_MTF_MovingAverage_v1.1_HrzLn

iMA

This indicator projects and visualizes moving average calculations from higher timeframes onto the current chart to identify long-term trends across different periodicities.

MA_MTF_MovingAverage_v1.1_HrzLn1.1
Indicator

MA_MTF_MovingAverage_v1.1_HrzLn1.1

iMA

This indicator projects smoothed moving average values from higher temporal frames onto the current chart to identify overarching trend biases and structural pivots.

ma_Navel_price
Indicator

ma_Navel_price

iMAiMAOnArray

Calculates a moving average based on a weighted fusion of open, high, low, and close prices to identify structural equilibrium points.

MA_of_MA
Indicator

MA_of_MA

iMAiMAOnArray

This indicator calculates a multi-layered moving average by deriving two distinct smoothing signals from a primary smoothed price baseline.

Ma_Parabolic_Alert_2
Indicator

Ma_Parabolic_Alert_2

iMA

This indicator identifies trend exhaustion and structural reversals by calculating a dynamic parabolic trajectory based on moving average price deviations.

Ma_Parabolic_Alert_2_v1
Indicator

Ma_Parabolic_Alert_2_v1

iMA

This indicator identifies market trend shifts by calculating a parabolic acceleration curve based on moving average price extremes and triggering alerts when price breaches the dynamic reversal boundary.

Ma_Parabolic_st2.1
Indicator

Ma_Parabolic_st2.1

iMA

This indicator identifies trend exhaustion and potential price reversals by calculating a parabolic Sar value based on Moving Average extremes and dynamic acceleration steps.

Ma_Parabolic_st2
Indicator

Ma_Parabolic_st2

iMA

This indicator identifies trend reversals by synchronizing a moving average with an adaptive parabolic SAR logic that adjusts sensitivity based on price extremities.

Ma_Parabolic_st2_2
Indicator

Ma_Parabolic_st2_2

iMA

The algorithm identifies trend shifts by dynamically adjusting a parabolic step multiplier based on the interaction between smoothed moving average price action and rolling high/low extremes.

Indicator

MA_PriceCcross

iMA
MA_PriceCcross2BcloseD
Indicator

MA_PriceCcross2BcloseD

iMA

Identifies trend reversals and momentum shifts by evaluating price position relative to moving average continuity over a multi-bar lookback window.

MA_PriceCcrossClose
Indicator

MA_PriceCcrossClose

iMA

The indicator visualizes market sentiment by plotting distinct signals based on whether the closing price maintains a position above or below a dynamic moving average baseline.

MA_PriceCcrossHiLo
Indicator

MA_PriceCcrossHiLo

iMA

This indicator identifies price action volatility by plotting a moving average line and marking specific instances where candle extremes fail to cross the mean threshold.

MA_PriceCrossover_Alert
Indicator

MA_PriceCrossover_Alert

iMA

This indicator detects price crossovers between dual moving averages—supporting SMA, EMA, SMMA, LWMA, and LSMA types—while providing real-time audio and email notifications based on specific price action dynamics.

MA_PriceCrossover_Email_Alert
Indicator

MA_PriceCrossover_Email_Alert

iMA

This indicator identifies trend reversals by detecting price breaches of dual moving average envelopes, supporting SMA, EMA, SMMA, LWMA, and LSMA calculations across various price types.

MA_Price_Cross1.1
Indicator

MA_Price_Cross1.1

iMA

This indicator identifies instantaneous price-to-moving-average crossovers by validating trend shifts across three consecutive data points and generating real-time multi-channel notifications.

MA_Price_Cross1.1m_alert
Indicator

MA_Price_Cross1.1m_alert

iMA

This indicator detects real-time price breaches of customizable moving averages and triggers multi-channel notifications including pop-ups, audio signals, and emails.

MA_RangeAlert
Indicator

MA_RangeAlert

iMA

This indicator monitors the expansion and contraction of a multi-moving average ribbon to trigger alerts when price volatility exceeds defined structural thresholds.

MA_ribbon
Indicator

MA_ribbon

iMA

This indicator visualizes the relative positioning of two moving averages by dynamically switching buffer assignments based on their crossover state to highlight trend momentum.

MA_ribbon_filled
Indicator

MA_ribbon_filled

iMA

This indicator visualizes the dynamic spread and convergence between two distinct moving average periods to identify shifting momentum and structural trend transitions.

MA_RSI_BB
Indicator

MA_RSI_BB

iMA

This indicator calculates a smoothed Relative Strength Index (RSI) derived from moving average price fluctuations and overlays it with Bollinger Bands to identify overextended momentum and volatility boundaries.

MA_Segments
Indicator

MA_Segments

iMA

This indicator projects horizontal segments and labels for various moving averages from multiple timeframes onto the current chart to maintain visual clarity.