MAcrosses
Indicator

MAcrosses

iMA

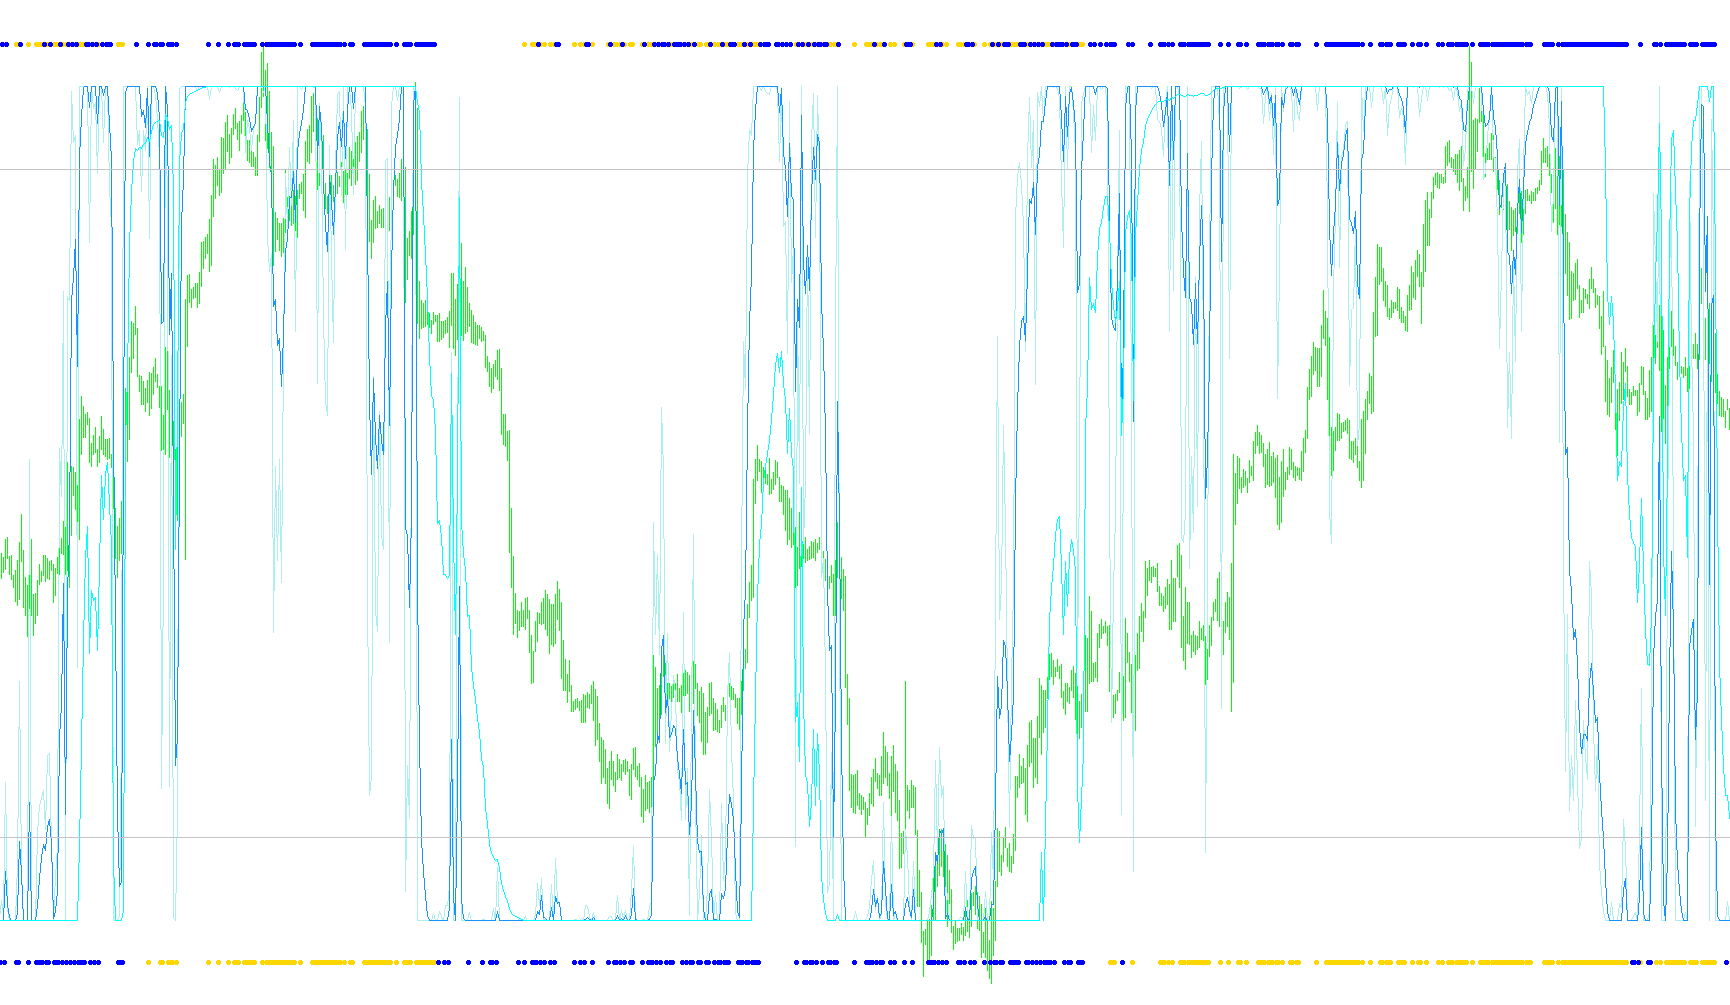
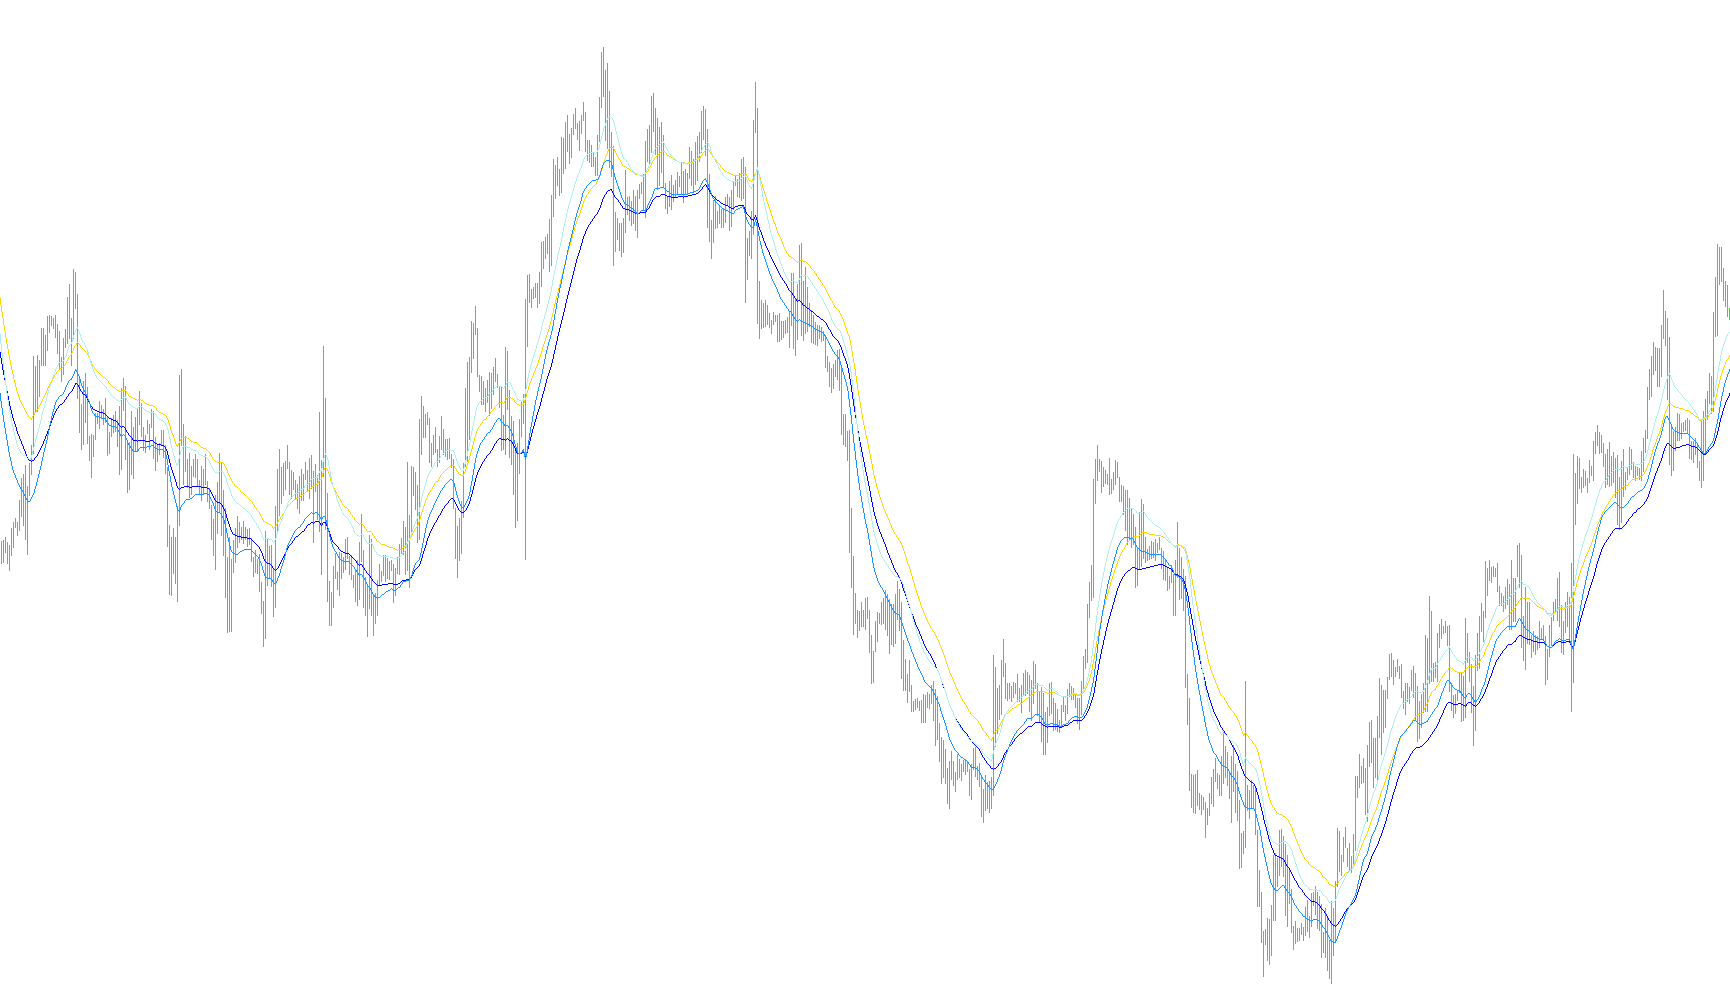
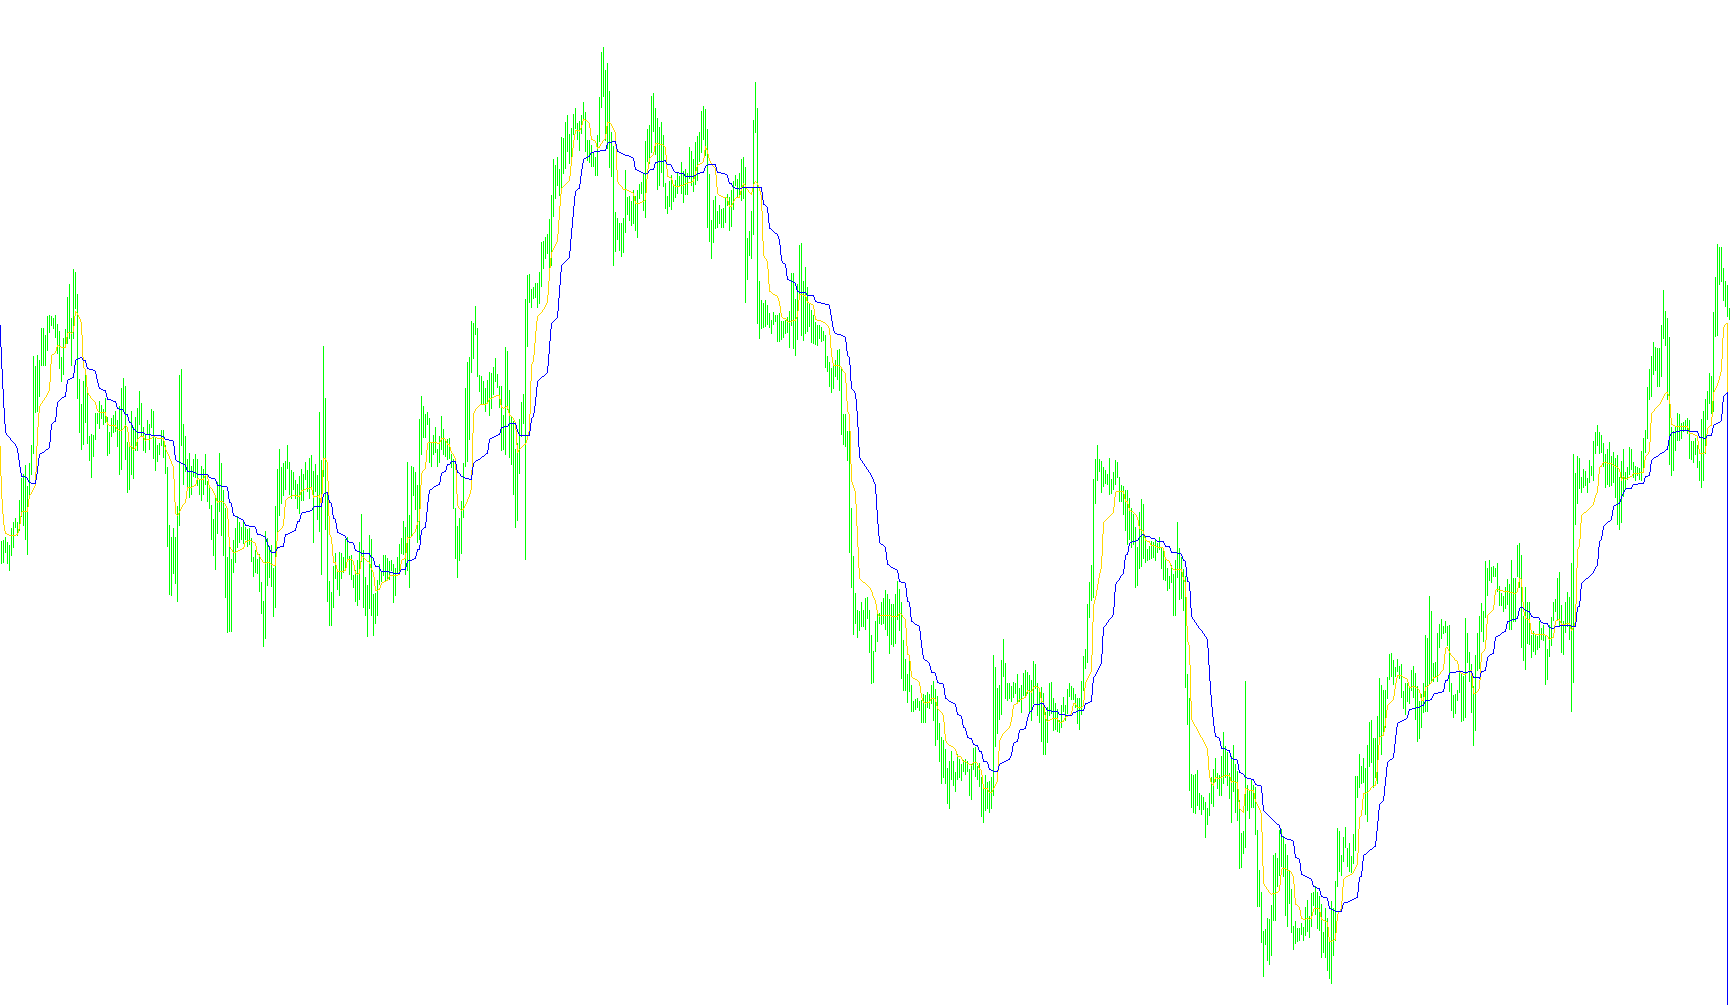
This indicator quantifies bullish and bearish momentum by calculating the percentage of faster moving averages trending above or below slower periods within a defined multi-period hierarchy.

Indicator

MACrossIndicator

iMA
Indicator

MACrossIndicator_v1

iMA
MAcross_OpenBarSig
Indicator

MAcross_OpenBarSig

iMA

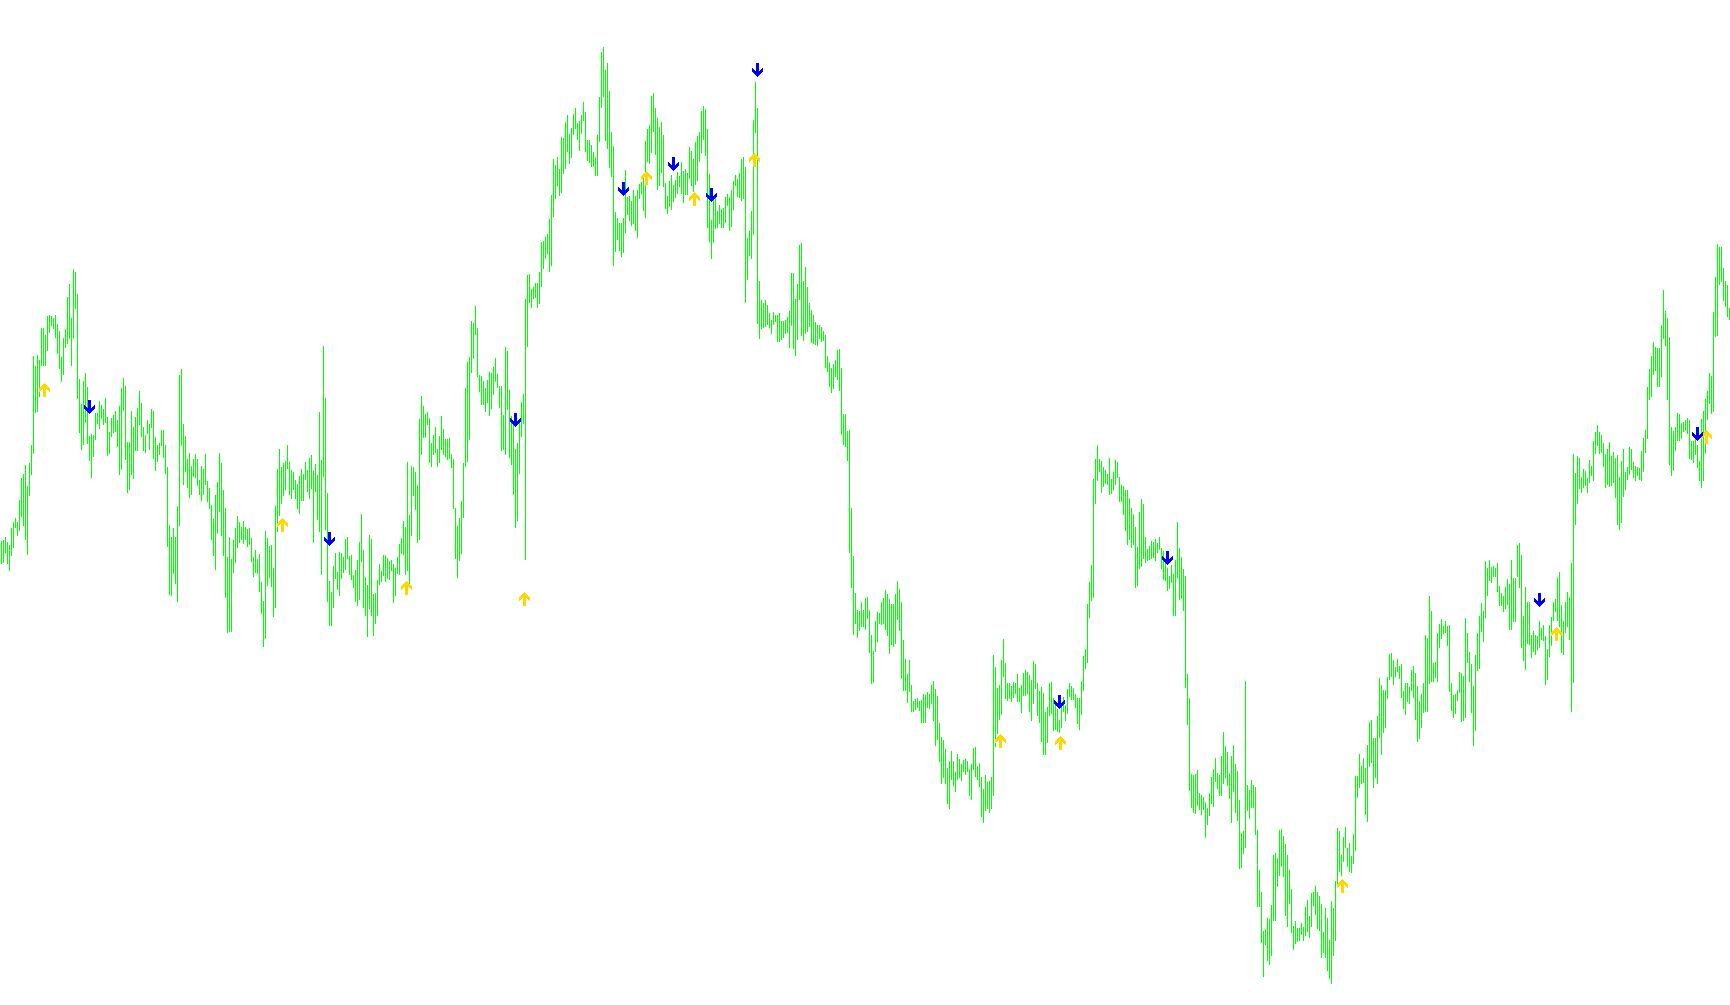
This indicator detects trend reversals by identifying precise crossover points between two distinct moving average periods while calculating price volatility to offset visual signals.

MAcross_Rsi_Sto_Macd_Fx10SetupTM
Indicator

MAcross_Rsi_Sto_Macd_Fx10SetupTM

iMACDiMAiRSIiStochastic

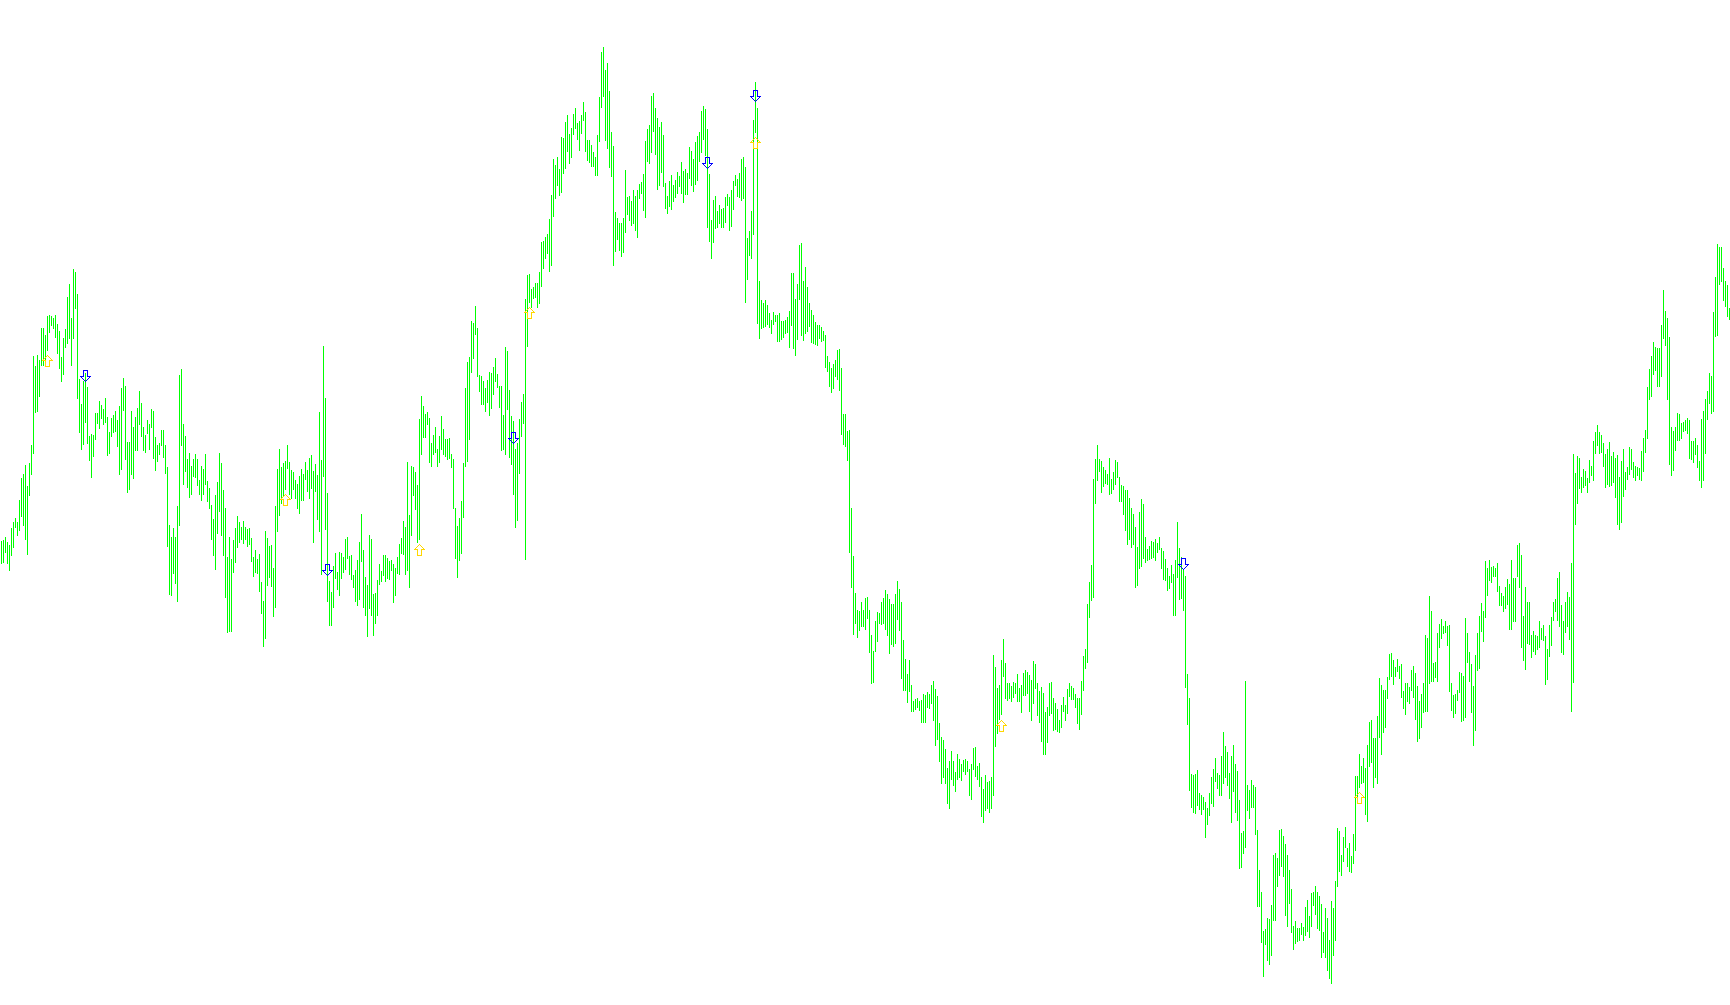
This indicator identifies trend reversal entries by synchronizing Moving Average crossovers with RSI strength thresholds, Stochastic oscillator positioning, and MACD signal line dynamics.

mad
Indicator

mad

iMA

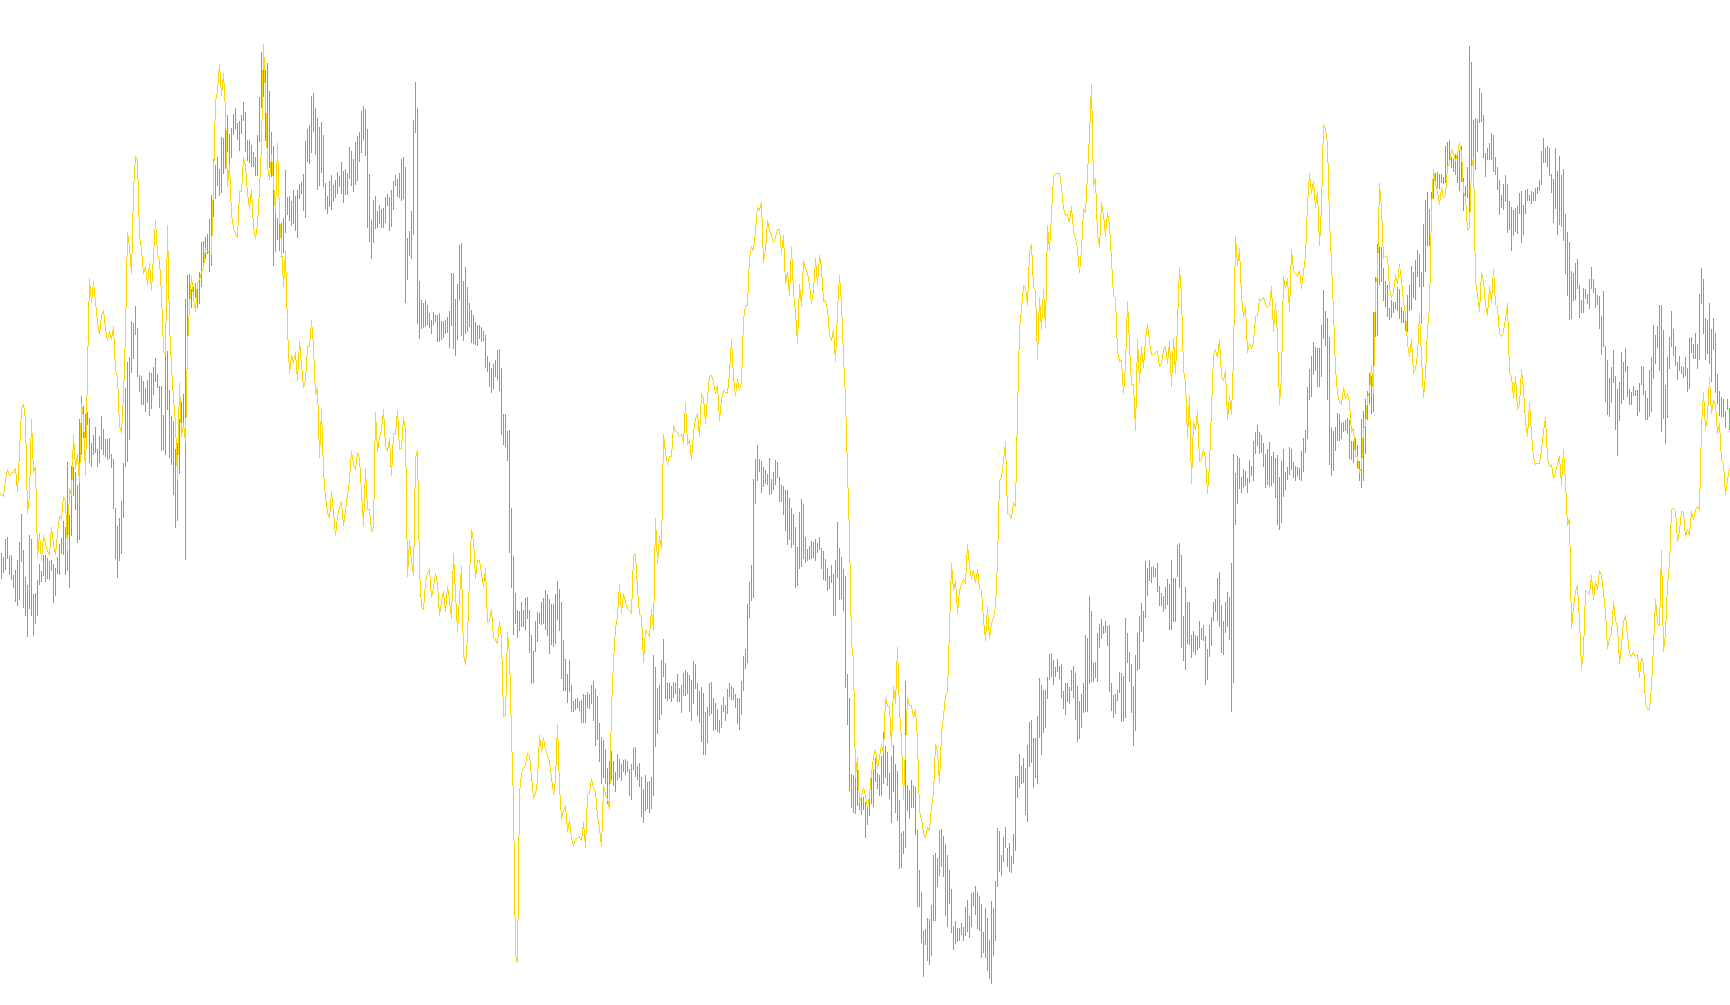
This indicator quantifies the instantaneous rate of change by calculating the point-based delta between consecutive Simple Moving Average values.

Indicator

MADistance

iMA
Indicator

MADistancewAlerts

iMA
Indicator

MADistance_002

iMA
Indicator

MADistance_TRO_MODIFIED_VERSION

iMA
madnessMA
Indicator

madnessMA

iMA

This indicator quantifies market momentum by calculating the weighted spatial relationship and relative sorting degrees between a multi-layered array of Fibonacci-based moving averages.

MadroGoldenFilter
Indicator

MadroGoldenFilter

iMACDiADXiMAiRSI
maEMA_Trend_Indicator
Indicator

maEMA_Trend_Indicator

iMA

This indicator maps momentum by plotting dual Exponential Moving Averages across both high and low price points to define structural volatility boundaries.

MaEnv_02B_v2
Indicator

MaEnv_02B_v2

iMA

This indicator generates a dynamic multi-band envelope centered on a weighted average of three Linear Weighted Moving Averages, utilizing specific Fibonacci numerical offsets to define price volatility boundaries.

MaEnv_02B_v3a
Indicator

MaEnv_02B_v3a

iMA

This indicator calculates a composite Linear Weighted Moving Average and projects multiple symmetrical price channels based on time-frame sensitive volatility coefficients and Fibonacci retracement levels.

MAFRACTALS
Indicator

MAFRACTALS

iMA

Identifies local price extremes by detecting directional reversals in the moving average curvature relative to specific historical shifts.

MagicOscillator1.22
Indicator

MagicOscillator1.22

iMA

This indicator identifies directional shifts by comparing multi-bar price delta variances against Awesome Oscillator trends to pinpoint momentum reversals.

MagicOscillator2.00
Indicator

MagicOscillator2.00

iMA

This indicator identifies trend reversals by synthesizing smoothed average oracle values with recursive price delta breaches across multiple historical lookback candles.

malock
Indicator

malock

iMA

This indicator dynamically scales the Moving Average period based on a fixed higher timeframe anchor to maintain consistent signal velocity across different chart resolutions.

maloma`s`enter
Indicator

maloma`s`enter

iMAiMAOnArray

Identifies potential entry points by detecting when the scaled MACD histogram crosses a specific volatility threshold from either side.

MALRFast
Indicator

MALRFast

iMA

This indicator calculates a weighted differential between Linear Weighted Moving Averages and Simple Moving Averages to identify momentum shifts.

MAMA_v1
Indicator

MAMA_v1

iATRiMA

This indicator utilizes a recursive detrending algorithm to calculate an adaptive moving average that dynamically adjusts its smoothing factor based on the instantaneous cycle period and phase of price action.

MAMA_v1MTFsig_alert
Indicator

MAMA_v1MTFsig_alert

iATRiMA

This indicator utilizes a complex detrending algorithm and adaptive alpha smoothing to generate dynamic trend lines that adjust to market periodicity and velocity.

MAMA_v1mtf_alert_001
Indicator

MAMA_v1mtf_alert_001

iATRiMA

This indicator utilizes a dual-layer moving average system derived from Laguerre functions to dynamically calculate price momentum and provide adaptive trend identification based on phase changes.

MAMA_v1_osc_MTF_alert
Indicator

MAMA_v1_osc_MTF_alert

iMA

This indicator employs an adaptive filtering mechanism that utilizes a multi-stage detrending process and dynamic phase calculations to identify momentum shifts across diverse price types, including Heiken Ashi dynamics.

MAMy v[1].3
Indicator

MAMy v[1].3

iMA

This indicator identifies trend momentum by calculating the relative spread between multi-shifted moving averages and detecting specific price-action crossovers.

MAMy
Indicator

MAMy

iMA

The algorithm quantifies price velocity by calculating the net differential between smoothed opening, weighted midpoints, and closing values to identify trend momentum shifts.

MAMy3
Indicator

MAMy3

iMA

This indicator analyzes the relative positioning of moving average price components to identify directional momentum shifts and structural trend reversals.

MAMy_Cross(AM)
Indicator

MAMy_Cross(AM)

iMA

This indicator identifies directional shifts by calculating dual momentum vectors based on the deviation between weighted moving averages and price action relative to local volatility ranges.

MAM_Crossover
Indicator

MAM_Crossover

iMA

Identifies structural trend reversals by detecting specific alternating fluctuations in Simple Moving Average gaps between open and close prices.

MAonMA
Indicator

MAonMA

iMAiMAOnArray

This indicator calculates a hierarchical smoothing effect by applying subsequent moving averages onto the results of previous ones to filter out high-frequency price noise.

MAProfit
Indicator

MAProfit

iMAiSARiRSI

This indicator identifies trend reversals by monitoring the interaction between fast and slow moving averages across multiple price points while providing automated backtesting for optimal parameter selection.

MAProfit2
Indicator

MAProfit2

iMA

This indicator quantifies the price distance between two moving averages in points to visualize momentum expansion and trend strength.

MAProfitSingle
Indicator

MAProfitSingle

iMA

This indicator simulates historical trades based on moving average price crossovers and features an automated optimization engine to identify the highest profit parameters.

Marketvision
Indicator

Marketvision

iMA

This system performs multi-dimensional statistical decomposition including linear regression, skewness, and kurtosis while monitoring real-time volatility thresholds and cross-asset momentum.

Indicator

master_info

iCCIiMACDiRSIiStochastic
Indicator

MaStillWorks

iMA
Indicator

MasTrend

iMA
MATimeAuto
Indicator

MATimeAuto

iMA

The algorithm identifies bullish and bearish momentum shifts by detecting specific crossovers between a price-range adjusted SMA and a high-inertia baseline average.

MATWO
Indicator

MATWO

iMA

This indicator quantifies the cumulative spread between Simple Moving Averages and Exponential Moving Averages across multiple time scales to visualize momentum velocity.

MAxMAhilo_cross
Indicator

MAxMAhilo_cross

iMA

This indicator identifies momentum shifts by detecting when a primary moving average crosses above or below the high and low boundaries of a secondary volatility-based moving average.

ma_2c
Indicator

ma_2c

iMA

This indicator identifies structural shifts by detecting consecutive downward movements in a moving average to highlight trend reversals or momentum breaks.

ma_2MACross_shift_SigAlert_mtf
Indicator

ma_2MACross_shift_SigAlert_mtf

iMA

Detects trend reversals by identifying the intersection of two movable moving averages across custom timeframes with dynamic visual offset labeling.

ma_2MAcross_yt_sig_alert
Indicator

ma_2MAcross_yt_sig_alert

iMA

This indicator identifies trend reversals by detecting precise crossover points between two moving averages and plotting visual signals with real-time alerts.

ma_2MAGoodCooked
Indicator

ma_2MAGoodCooked

iMA

The indicator identifies trend reversal points by detecting specific local price exhaustion and inflection movements relative to the crossover of two moving averages.

ma_2MA_Slope_SigMA_roc
Indicator

ma_2MA_Slope_SigMA_roc

iMAiMAOnArray

This indicator calculates the relative rate of change for two distinct moving averages and applies a secondary smoothing pass to identify momentum velocity.

ma_2xMAcross_alert_satop
Indicator

ma_2xMAcross_alert_satop

iMA

This indicator identifies bullish and bearish momentum shifts by detecting precise crossover points between two distinct moving average periods.

ma_2xMA_yt_sig_alert
Indicator

ma_2xMA_yt_sig_alert

iMA

This indicator identifies trend reversals by detecting precise crossover points between two distinct moving averages and plots visual directional signals with real-time alerts.

ma_3MA_separation_P
Indicator

ma_3MA_separation_P

iMA

Quantifies the relative distance between fast-moving average components and a long-term baseline to identify trend momentum and overextended price action.

ma_4MAs_histo_cw
Indicator

ma_4MAs_histo_cw

iMA

This indicator visualizes price momentum by simultaneously plotting four distinct moving average histograms based on various price types and periods to identify trend crossovers.