VininI_RVI_FOm
Indicator

VininI_RVI_FOm

iMAOnArrayiRVI

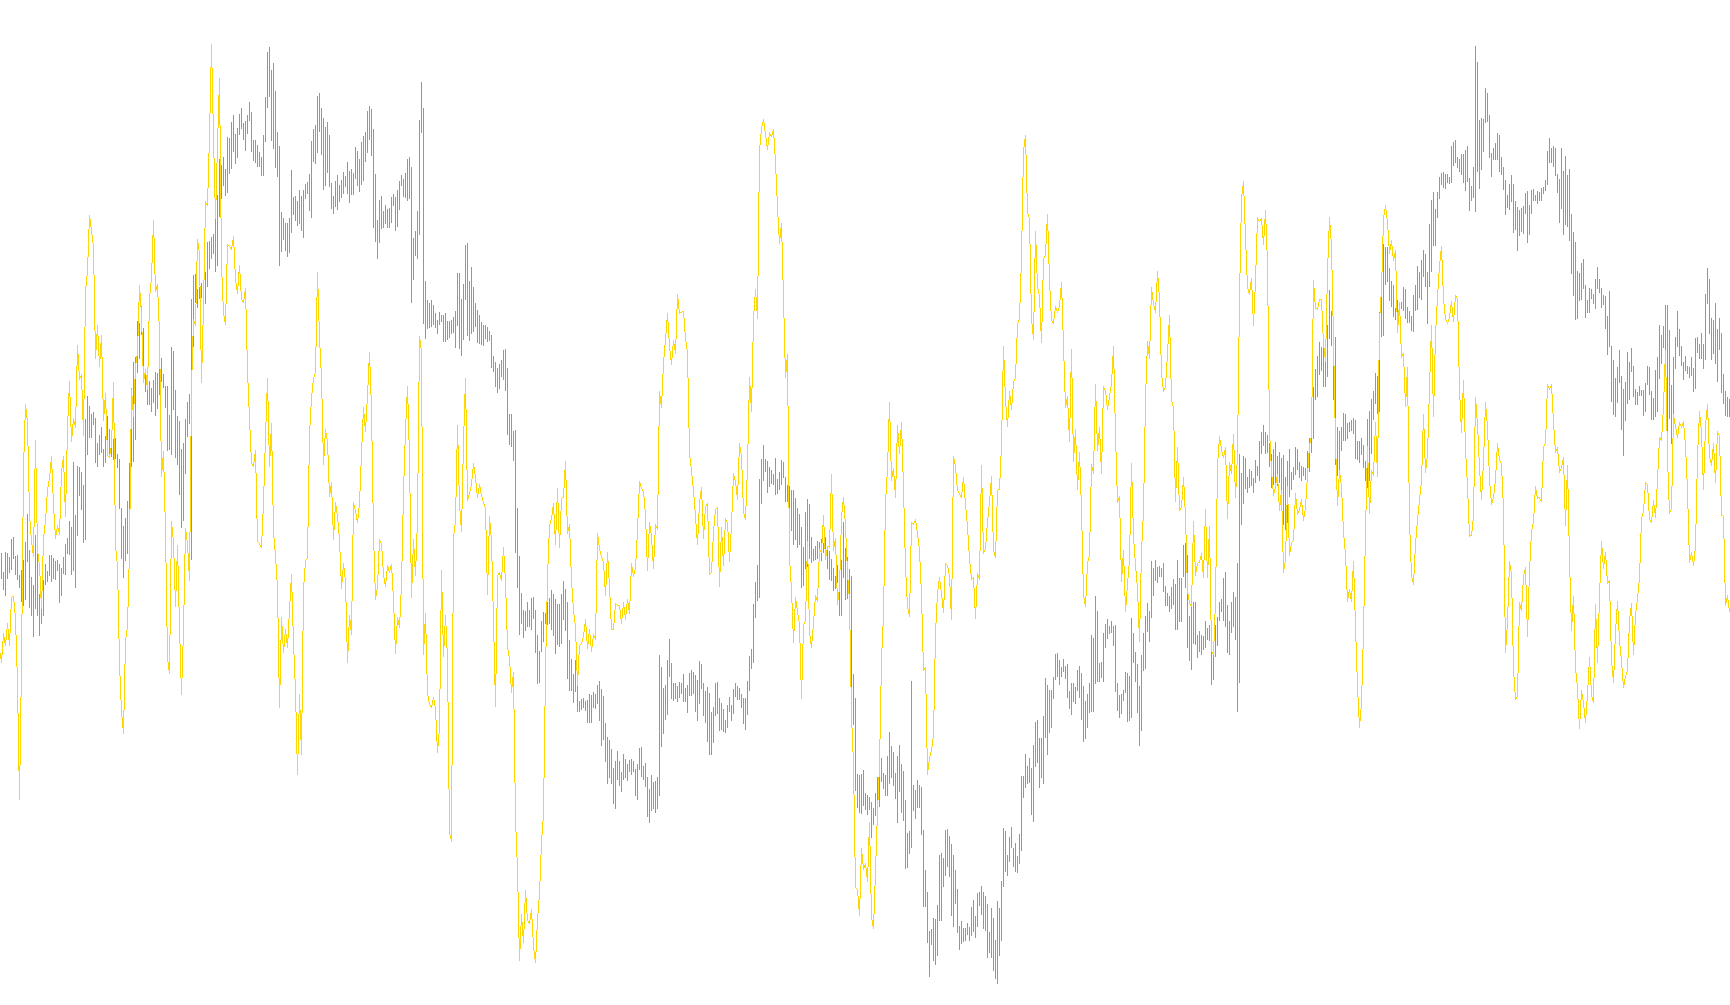
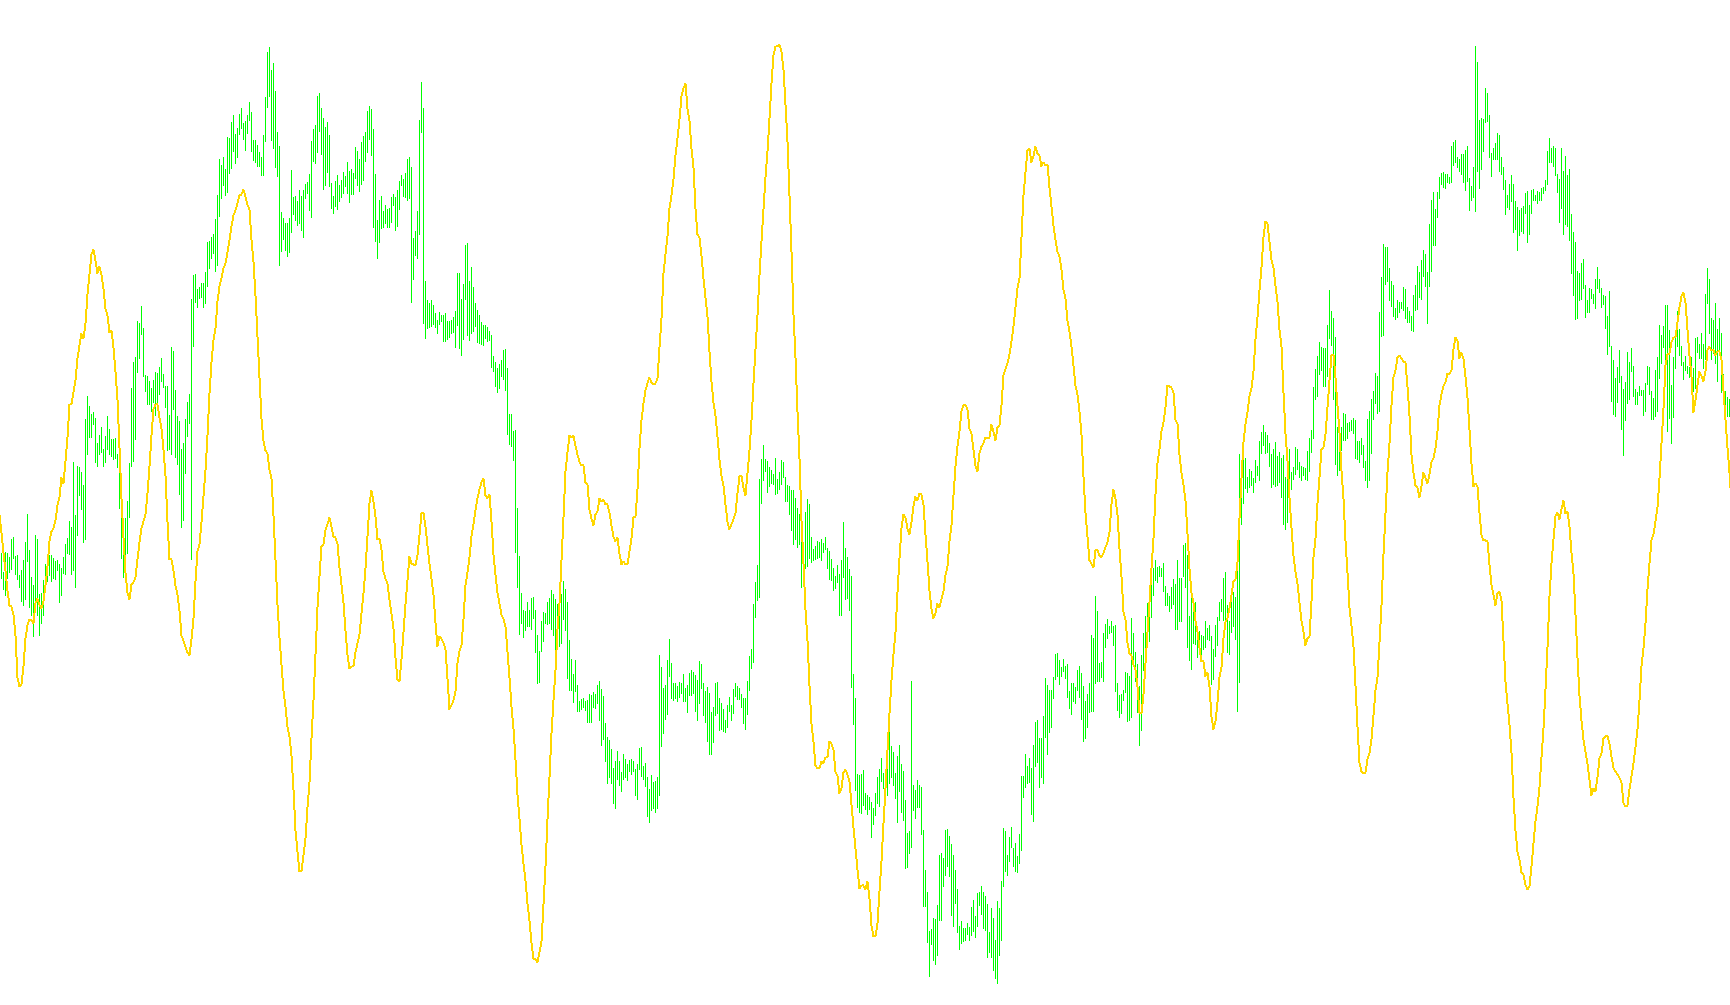
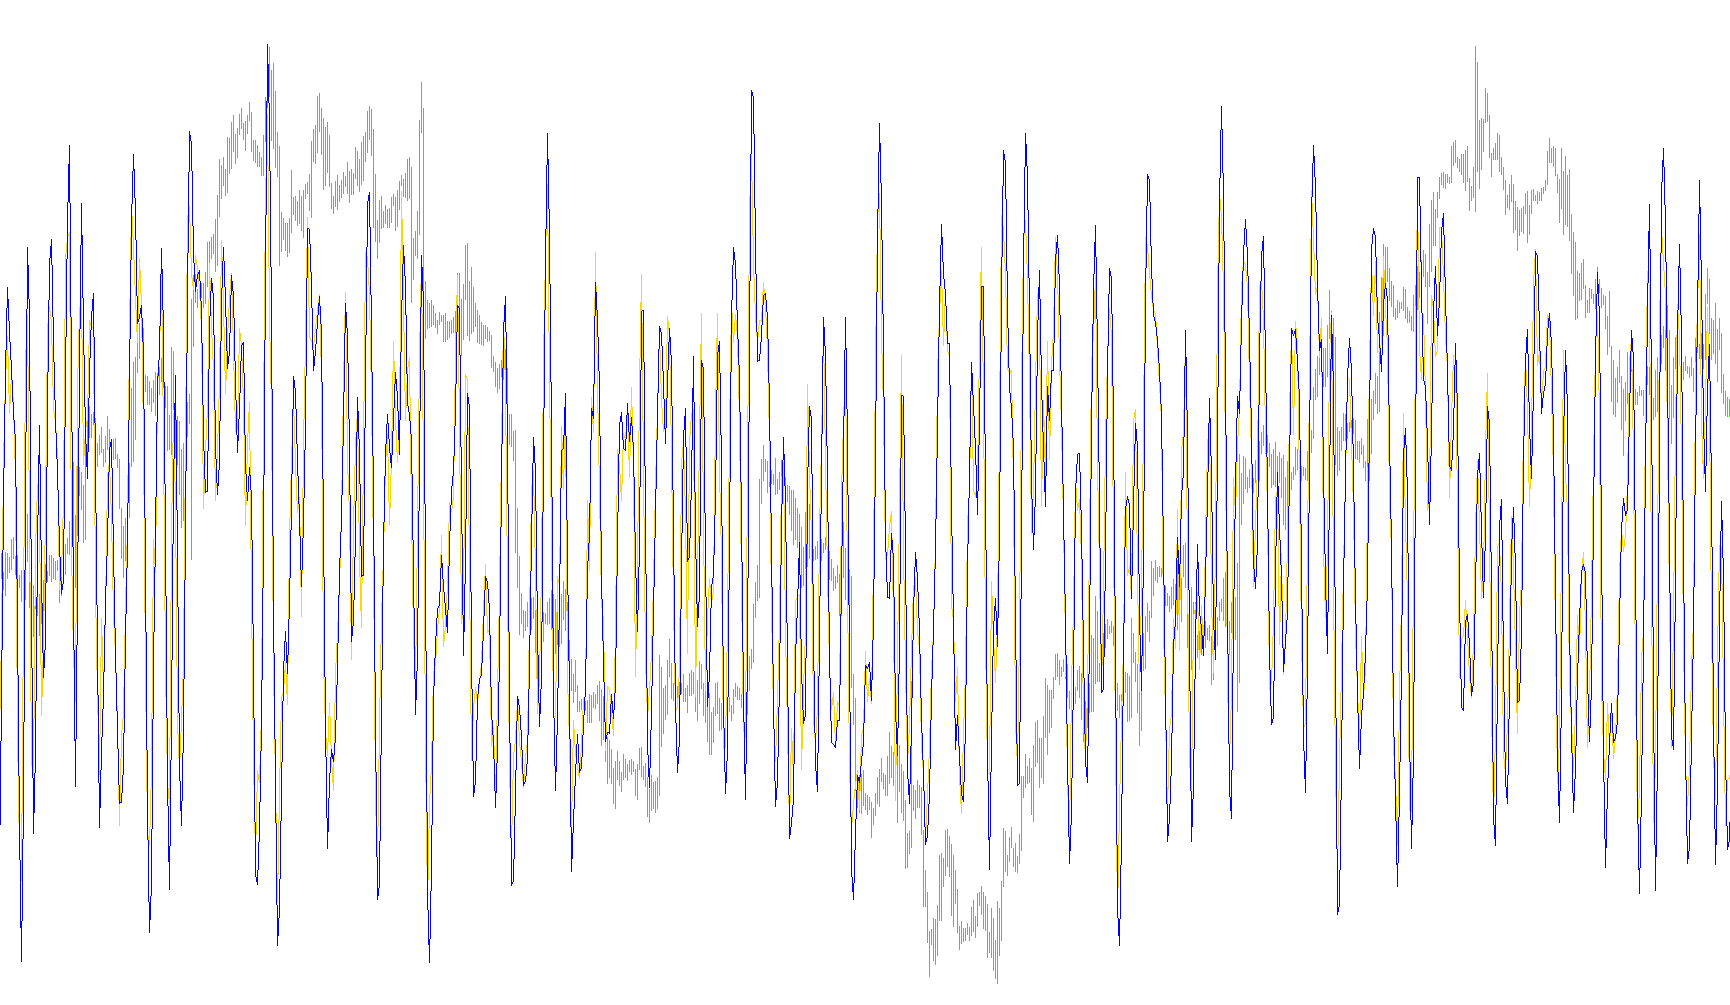
This indicator synthesizes RVI data from two distinct currency pairs into normalized hyperbolic tangent signals to visualize relative momentum divergence.

VininI_STO_FO
Indicator

VininI_STO_FO

iMAOnArrayiStochastic

This indicator applies a sigmoid activation function to a smoothed stochastic oscillator to normalize momentum into distinct bullish and bearish zones.

VininI_Trend_MA_WPR
Indicator

VininI_Trend_MA_WPR

iWPRiMAOnArray

The logic evaluates the relative frequency of Williams %R values exceeding a multi-step moving average to quantify momentum distribution strength.

VininI_Trend_V7
Indicator

VininI_Trend_V7

iMAOnArray

The algorithm calculates a weighted price distance gradient and applies a secondary moving average to detect directional shifts in trend velocity.

VininI_Trend_WPR
Indicator

VininI_Trend_WPR

iWPRiMAOnArray

This indicator calculates the Root Mean Square Deviation of normalized Williams Percent Range values to quantify volatility and trend stability.

VininI_Trend_WPR_MA
Indicator

VininI_Trend_WPR_MA

iWPRiMAOnArray

This indicator quantifies the prevalence of WillRogers Price Range values relative to a multi-point moving average array to identify momentum distribution trends.

VininI_WPR_FO
Indicator

VininI_WPR_FO

iWPRiMAOnArray

The logic transforms Williams Percent Range data into a smoothed hyperbolic tangent oscillation to identify extreme bullish and bearish momentum thresholds.

VininI_WPR_FOhisto
Indicator

VininI_WPR_FOhisto

iWPRiMAOnArray

This indicator transforms Williams Percent Range data into a smoothed hyperbolic tangent oscillator to identify overextended momentum extremes and directional shifts.

VKW Bands V2
Indicator

VKW Bands V2

iFractalsiMAOnArray

This indicator identifies trend exhaustion by calculating smoothed dynamic envelopes from METRO data and generating visual signals when price breaches these boundaries in coordination with fractal structures.

VKW Bands
Indicator

VKW Bands

iMAOnArray

This indicator calculates smoothed moving averages of the highest highs and lowest lows over a specific rolling window to identify price boundaries.

VKW_Bands_-_IBS
Indicator

VKW_Bands_-_IBS

iMAOnArray

This indicator identifies price extremes by extracting maximum and minimum values from a nested Input Basis Signal, applying smoothing filters to generate volatility boundaries.

VKW_Bands_-_IBS2
Indicator

VKW_Bands_-_IBS2

iMAOnArray

The logic identifies price position relative to the high-low range and projects smoothed upper and lower boundaries based on historical maximums and minimums.

VKW_Bands_modified
Indicator

VKW_Bands_modified

iMAOnArray

This indicator identifies price extremes by extracting high and low values from a custom METRO source and applying moving average smoothing to establish dynamic volatility boundaries.

Volatility Pivot
Indicator

Volatility Pivot

iATRiMAOnArray

This indicator calculates a responsive price boundary by dynamically adjusting an offset based on smoothed ATR values or fixed point increments to track market structural shifts.

Volatility.Pivot
Indicator

Volatility.Pivot

iATRiMAOnArray

The indicator tracks market equilibrium by dynamically adjusting a trailing stop based on the product of smoothed Average True Range and a multiplier factor.

Volatility.Pivot_002
Indicator

Volatility.Pivot_002

iATRiMAOnArray

This indicator calculates a reactive price boundary that adjusts based on smoothed ATR fluctuations and price momentum to define trailing liquidity zones.

Volatility.Pivot_v1
Indicator

Volatility.Pivot_v1

iATRiMAOnArray

This indicator calculates a reactive trailing stop by adjusting price levels based on an Exponential Moving Average of the Average True Range to dynamically capture momentum shifts.

Volatility.Pivot_v3
Indicator

Volatility.Pivot_v3

iATRiMAOnArray

This indicator dynamically projects a trailing price threshold by calculating a variable offset based on smoothed Average True Range fluctuations and price breakout polarity.

Volatility_Pivot
Indicator

Volatility_Pivot

iATRiMAOnArray

The algorithm calculates a price-action buffer based on smoothed Average True Range to establish an adaptive trailing stop level that reacts to price fluctuations and volatility shifts.

Indicator

Volatility_Pivot_mtf

iATRiMAOnArray
VolATR
Indicator

VolATR

iATRiMAOnArray

This indicator calculates a moving average of the Average True Range to identify underlying market volatility trends.

Volume JMA Option
Indicator

Volume JMA Option

iMAOnArray

This indicator identifies volume expansion and contraction by comparing price-action momentum against multiple moving average models, featuring a customizable Jurik Moving Average (JMA) to filter noise.

VolumeAverage_v1
Indicator

VolumeAverage_v1

iMAOnArray

This indicator identifies significant price-action shifts by correlating real-time trading volume against a moving average threshold to highlight high-intensity volatility spikes.

Volume_JMA_OptionZeroCheck
Indicator

Volume_JMA_OptionZeroCheck

iMAOnArray

This indicator analyzes volume flow by applying a Jurik Moving Average (JMA) to identify high-precision momentum shifts and dynamic trading thresholds.

VSAc BAR TEXT SIGNALS
Indicator

VSAc BAR TEXT SIGNALS

iMAOnArray

This indicator identifies market sentiment by correlating price action spreads, relative volume surges, and bar closing positions to detect supply/demand exhaustion and institutional activity.

Indicator

VSAc WSD HISTOGRAM

iMAOnArray
VSI
Indicator

VSI

iMAOnArray

Normalizes trading activity by calculating the rate of volume distribution per unit of time to enable consistent comparison across varying chart intervals.

VSI_v1
Indicator

VSI_v1

iMAOnArray

This indicator normalizes trading activity by calculating volume per second to provide a consistent liquidity flow metric across disparate timeframes.

VSI_v2
Indicator

VSI_v2

iMAOnArray

This indicator normalizes trading activity by calculating the volume distribution per elapsed second to ensure consistent data comparability across disparate timeframes.

w35260
Indicator

w35260

iMAOnArray

This indicator quantifies the divergence between two distinct slope velocity gradients to identify momentum shifts, smoothed by a moving average signal.

w35260_Colored
Indicator

w35260_Colored

iMAOnArray

This indicator calculates the differential of dual slope direction lines to generate a momentum histogram with directional state switching and a smoothed signal overlay.

Waddah Attar Def RSI
Indicator

Waddah Attar Def RSI

iMAOnArrayiRSI

This indicator calculates the numerical spread between two distinct Relative Strength Index periods and applies a Simple Moving Average to smooth the resulting momentum variance.

Waddah_Attar_Def_RSI
Indicator

Waddah_Attar_Def_RSI

iMAOnArrayiRSI

This indicator quantifies price velocity by calculating the spread between two distinct RSI periods and applying a Simple Moving Average to smooth the resulting volatility.

Will-Spread
Indicator

Will-Spread

iMAOnArray

This indicator quantifies the relative pricing gap between two correlated financial instruments by applying an Exponential Moving Average crossover to their normalized ratio.

Indicator

xedginves@yahoo.com__Neutral_Hedge_osc_v4.5

iMAOnArrayiStdDevOnArray
Indicator

xedginves@yahoo.com__Neutral_Hedge_osc_v4.5~

iMAOnArrayiStdDevOnArray
XprofuterDD
Indicator

XprofuterDD

iMAOnArray

This indicator quantifies price velocity by accumulating the sum of candle body deviations over a specific period to identify directional momentum.

xpVolume
Indicator

xpVolume

iMAOnArray

This indicator detects significant bullish expansion by identifying instances where the short-term volume moving average exceeds the long-term baseline by a specific numerical threshold.

YangTrader
Indicator

YangTrader

iMAOnArray

This indicator calculates a smoothed percentage of the current closing price relative to the highest highs and lowest lows over a defined window using a Linear Weighted Moving Average.

ytg_Def_RSI
Indicator

ytg_Def_RSI

iMAOnArrayiRSI

This indicator calculates the spread between two Relative Strength Index values of differing periods and applies a moving average filter to the resulting delta.

ytg_Def_RSI_3_Symbol
Indicator

ytg_Def_RSI_3_Symbol

iMAOnArrayiRSI

This indicator calculates the smoothed difference between two distinct Relative Strength Index periods across three separate currency pairs to identify multi-symbol momentum correlations.

ZeroLag Stochs_true
Indicator

ZeroLag Stochs_true

iMAOnArray

This indicator applies a dual-layer subtraction logic to standard stochastic calculations to eliminate price lag and provide instantaneous momentum sensitivity.

Zerolagstochs_true
Indicator

Zerolagstochs_true

iMAOnArray

This indicator applies a double-smoothing arithmetic algorithm to traditional stochastic values to eliminate price lag while maintaining momentum sensitivity.

ZLSA
Indicator

ZLSA

iMAOnArray

This indicator computes a momentum value by applying a zero-lag smoothing algorithm to the standard stochastic %K and %D lines, minimizing price lag while preserving trend responsiveness.

^L_Correlation
Indicator

^L_Correlation

iMAOnArray

Quantifies the statistical linear relationship between two financial assets by calculating covariation and dispersion over a dynamic rolling window.

^L_Correlation_v2
Indicator

^L_Correlation_v2

iMAOnArray

This indicator calculates and visualizes the Pearson correlation coefficient between two distinct symbols or an asset's auto-correlation by analyzing various price data modes including relative volatility, high-low spreads, and weighted average bar values.

_!DivStochv5
Indicator

_!DivStochv5

iMAOnArrayiStochastic

This indicator synthesizes multiple stochastic periods into a single weighted momentum stream to identify trend exhaustion and precise reversal points via smoothed moving average crossovers.

_!DivStochv5onchart
Indicator

_!DivStochv5onchart

iMAOnArrayiStochastic

This indicator synthesizes weighted stochastic oscillators across multiple timeframes to identify structural trend exhaustion and project visual entry signals via zigzag mapping.

_Fast2
Indicator

_Fast2

iMAOnArray

This indicator identifies trend reversals by calculating a weighted multi-candle price variance and detecting specific crossover patterns between dual linear weighted moving averages.

Indicator

_Fast3

iMAOnArray