TDI
Indicator

TDI

iMAOnArray

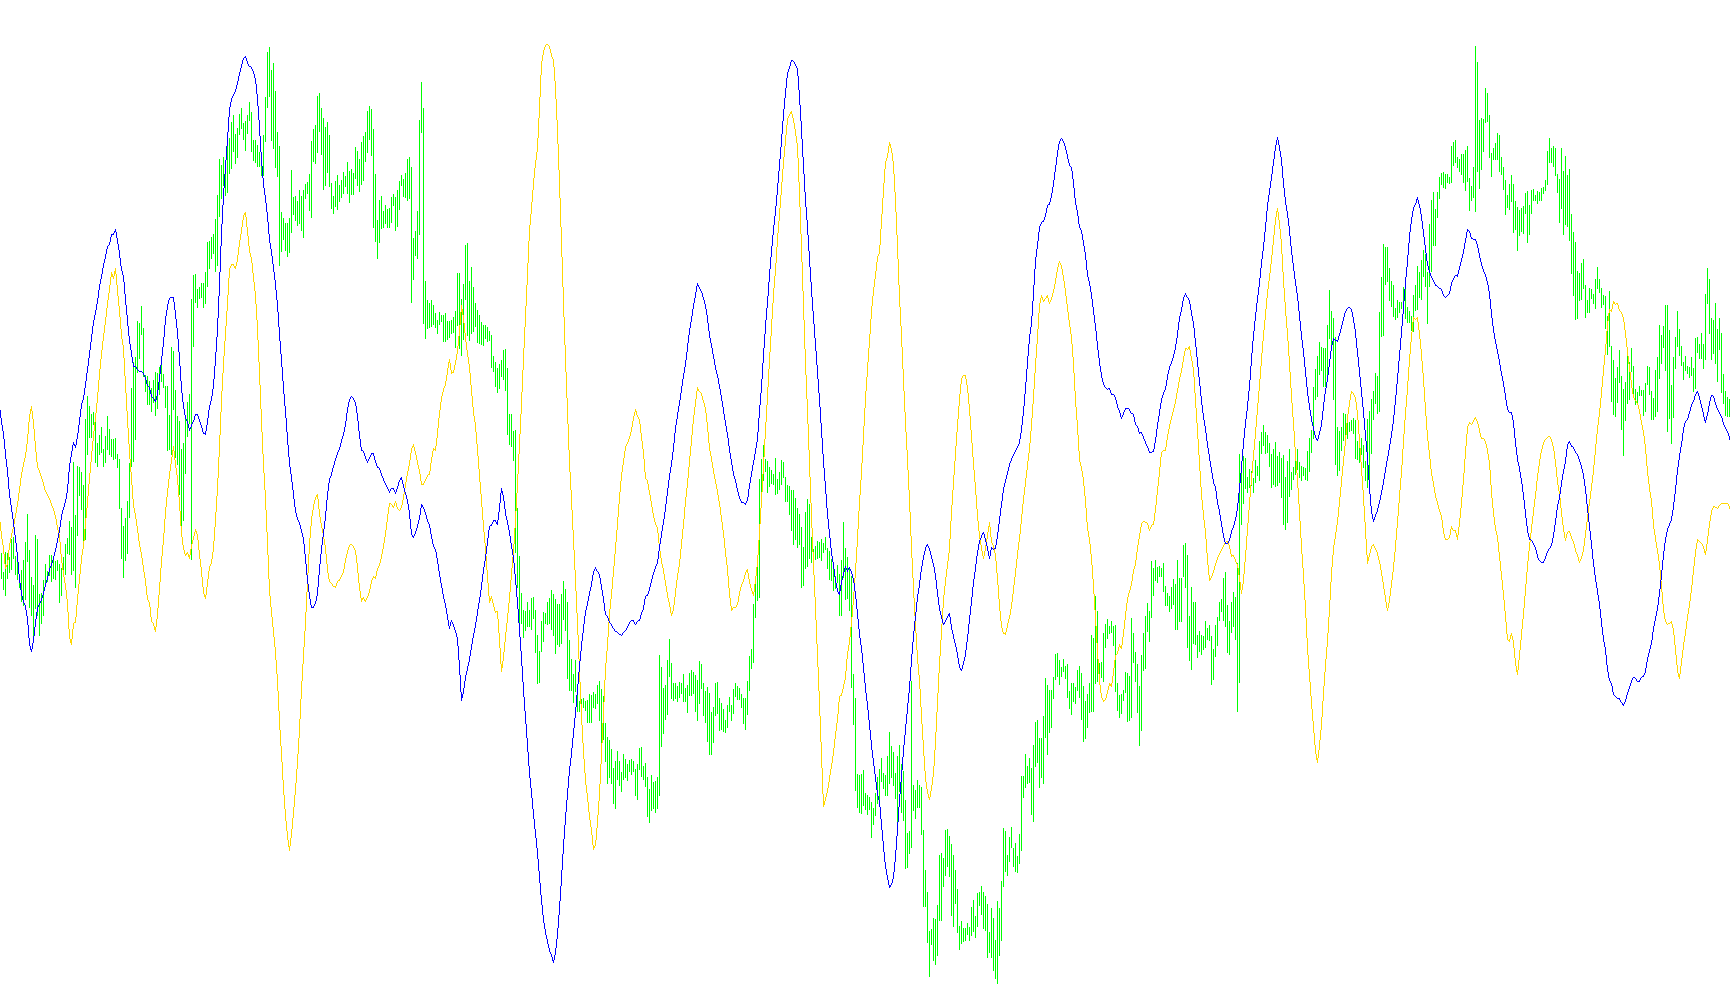
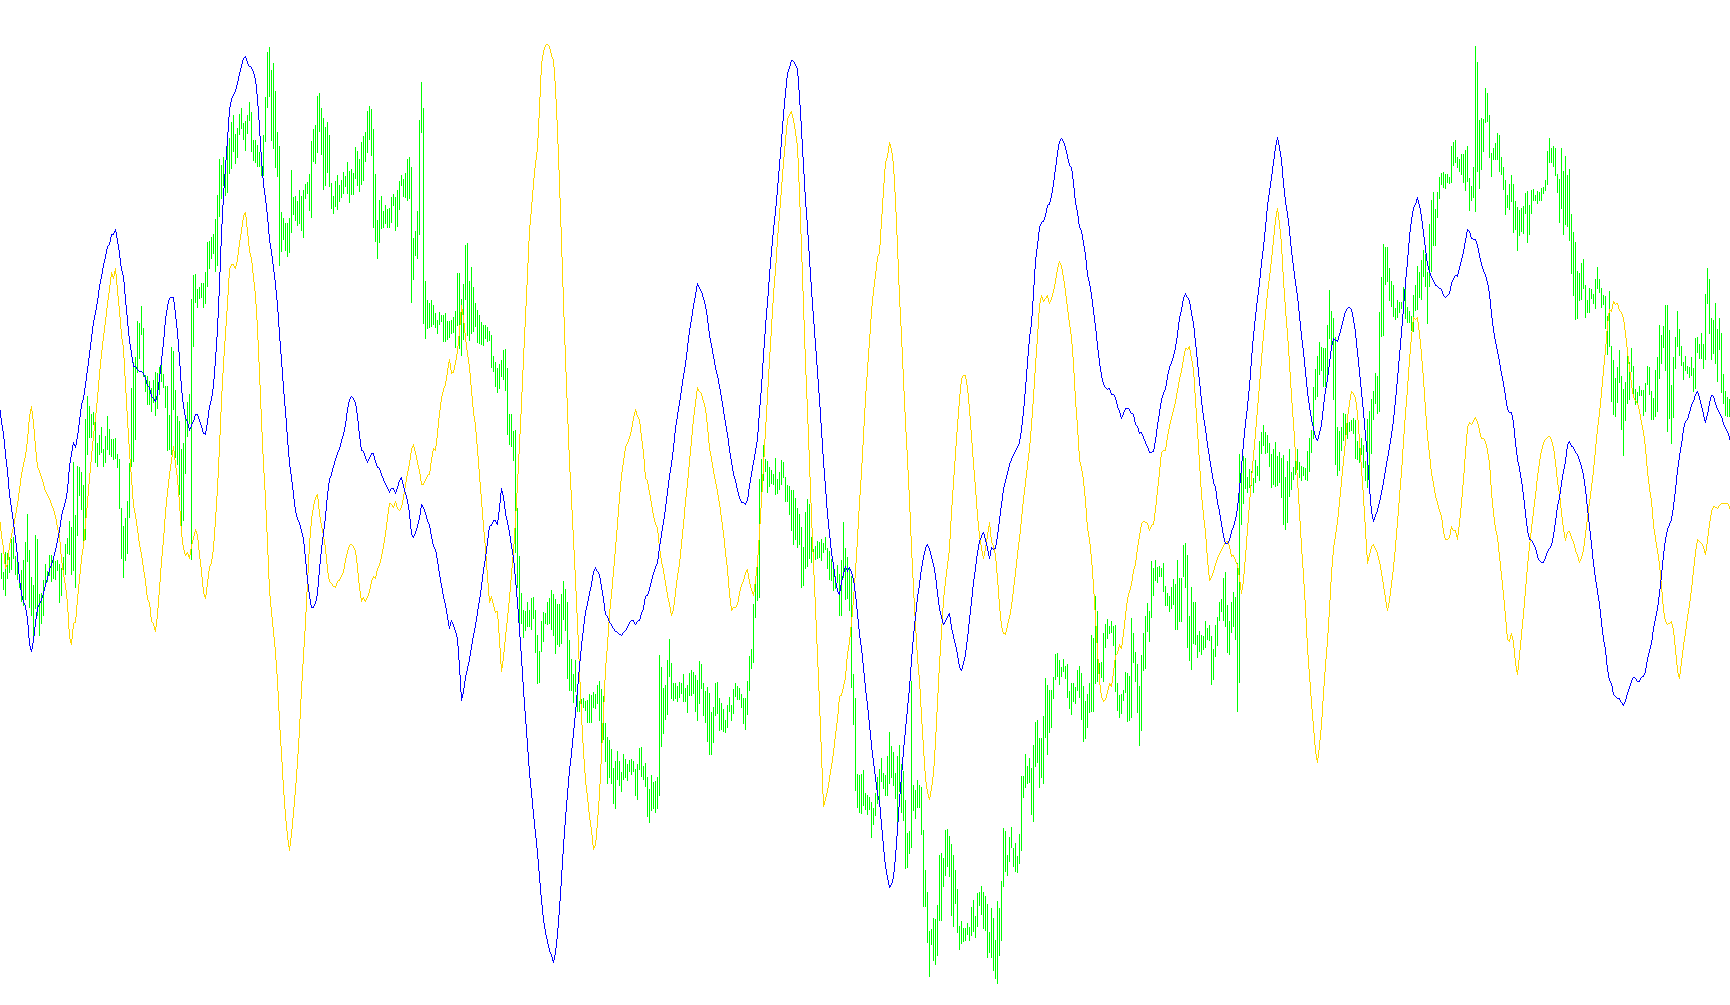
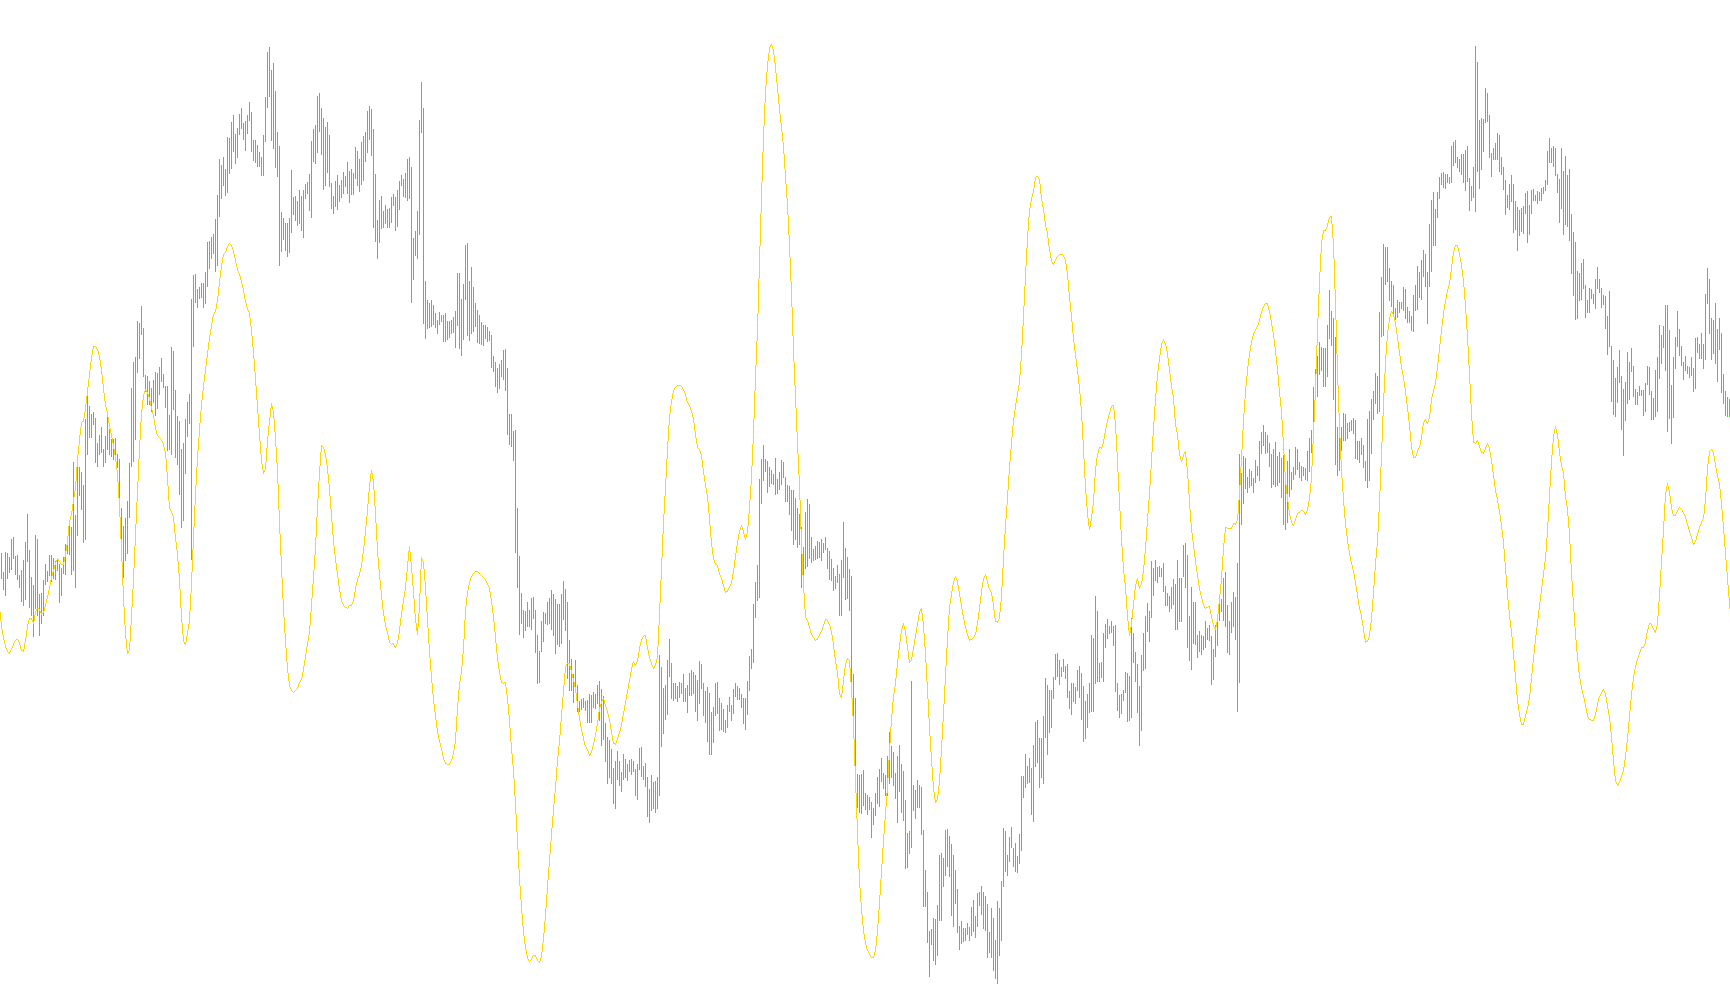
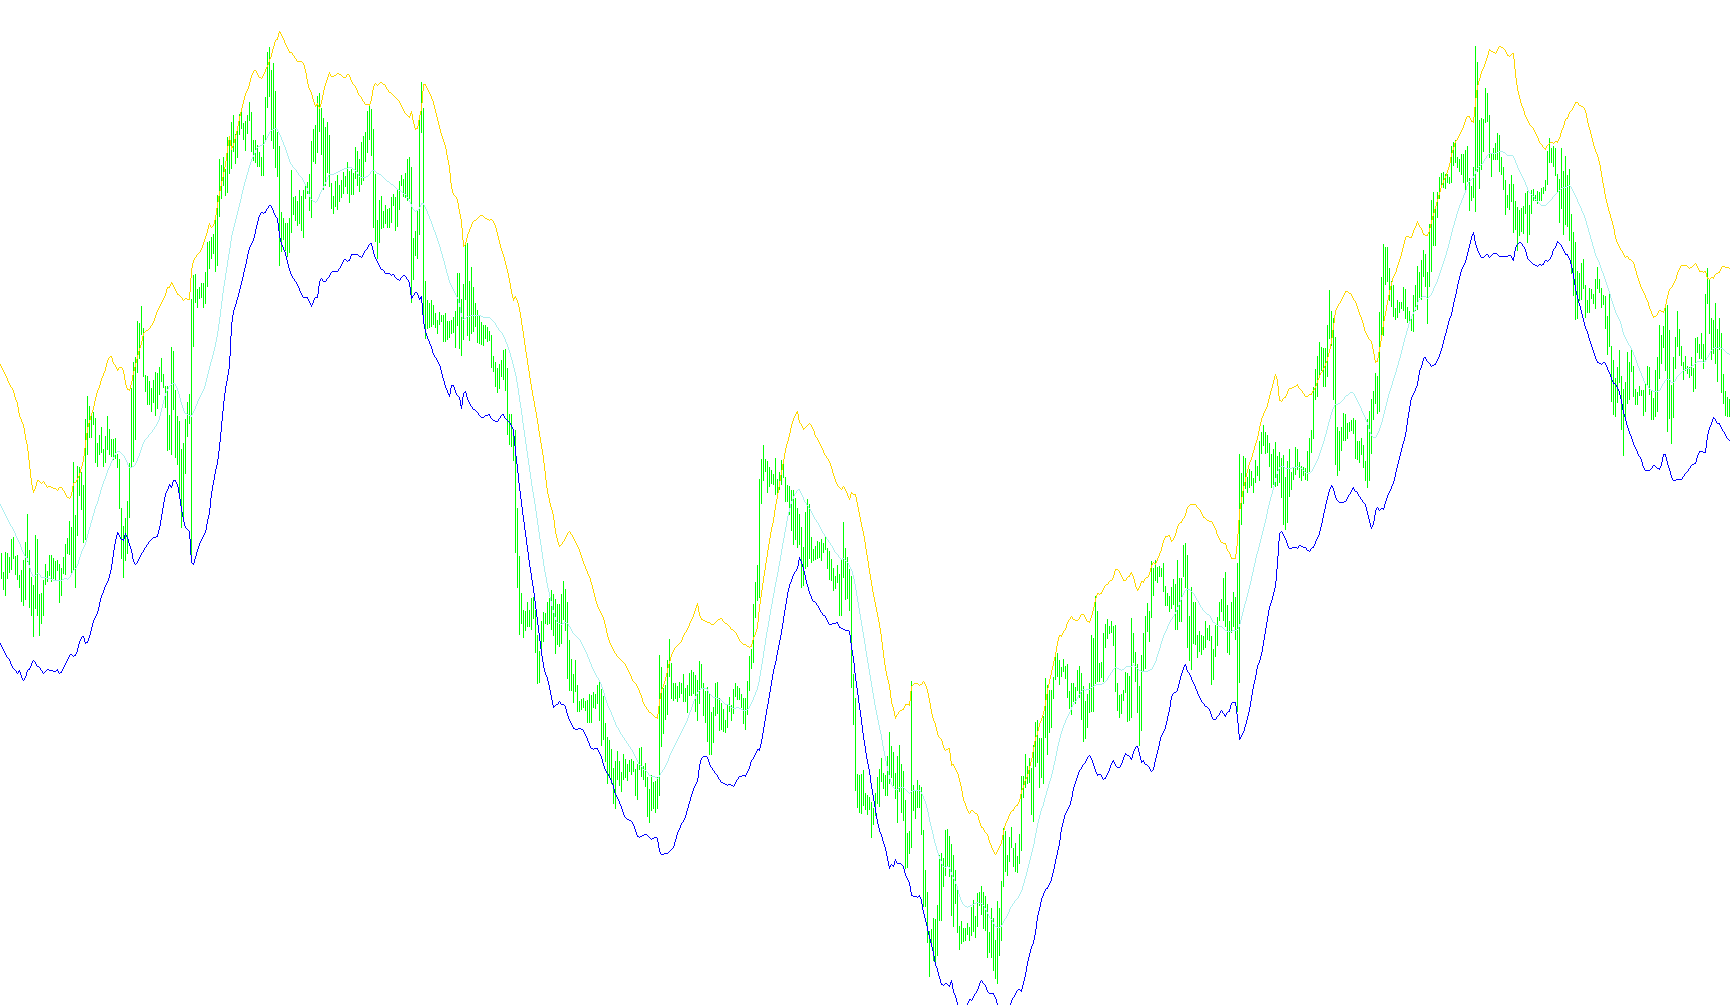
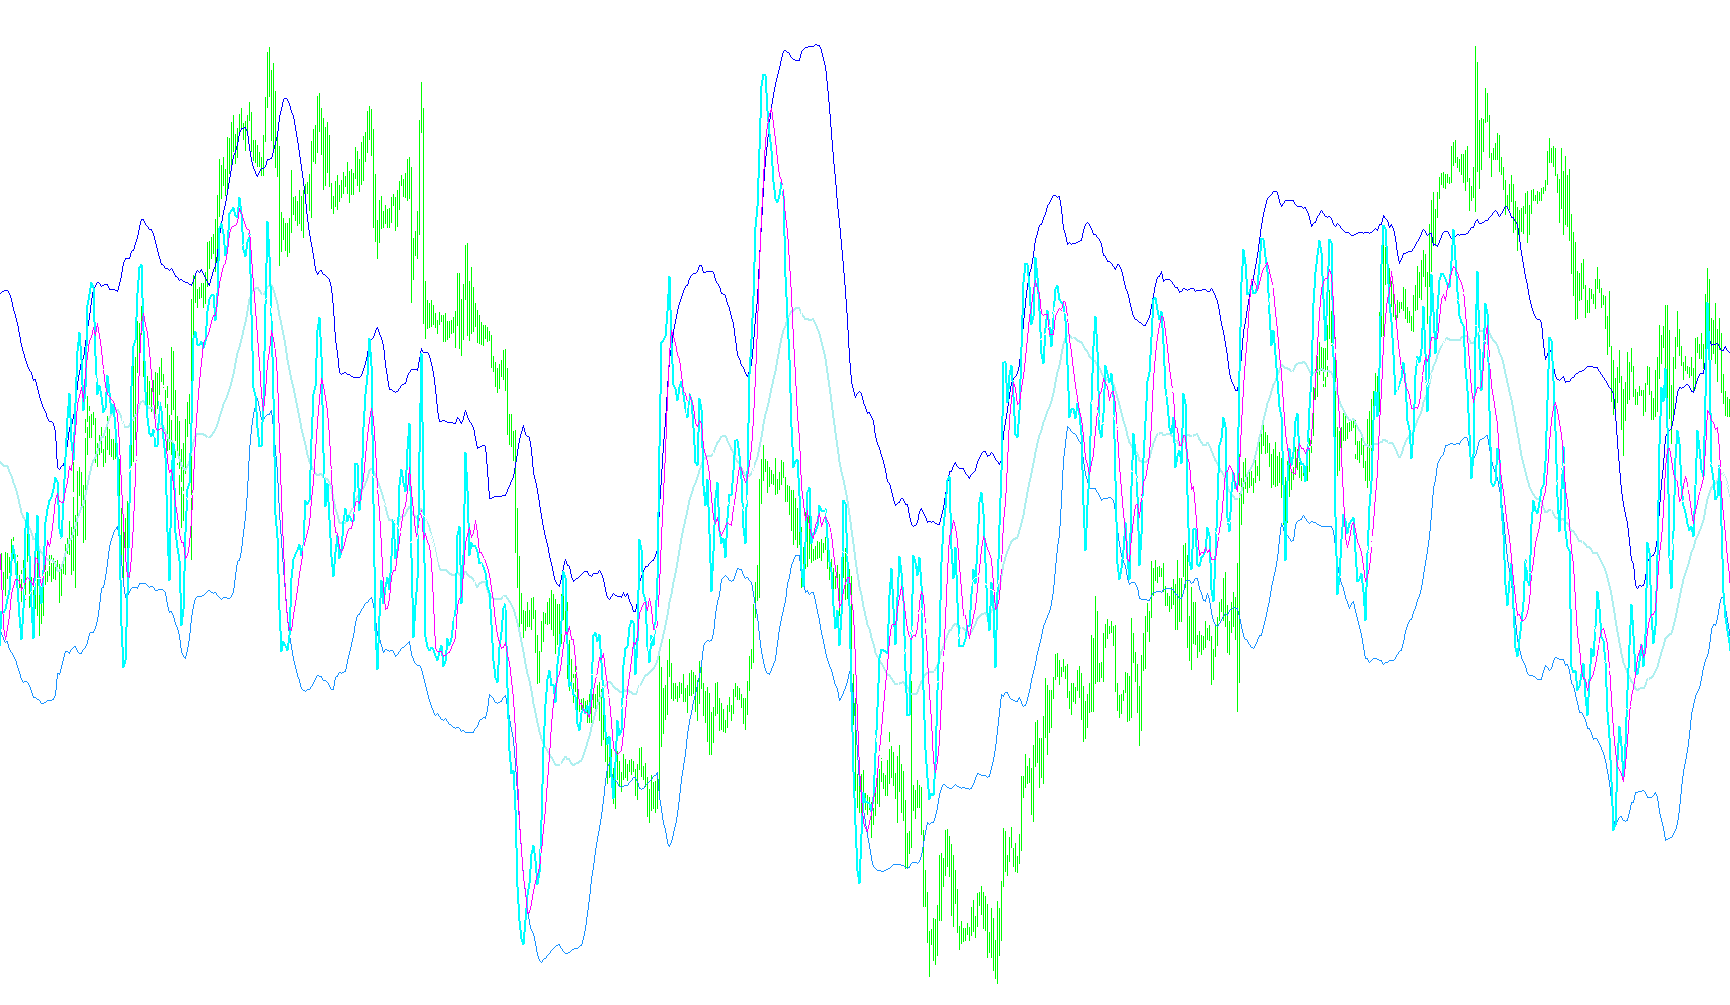
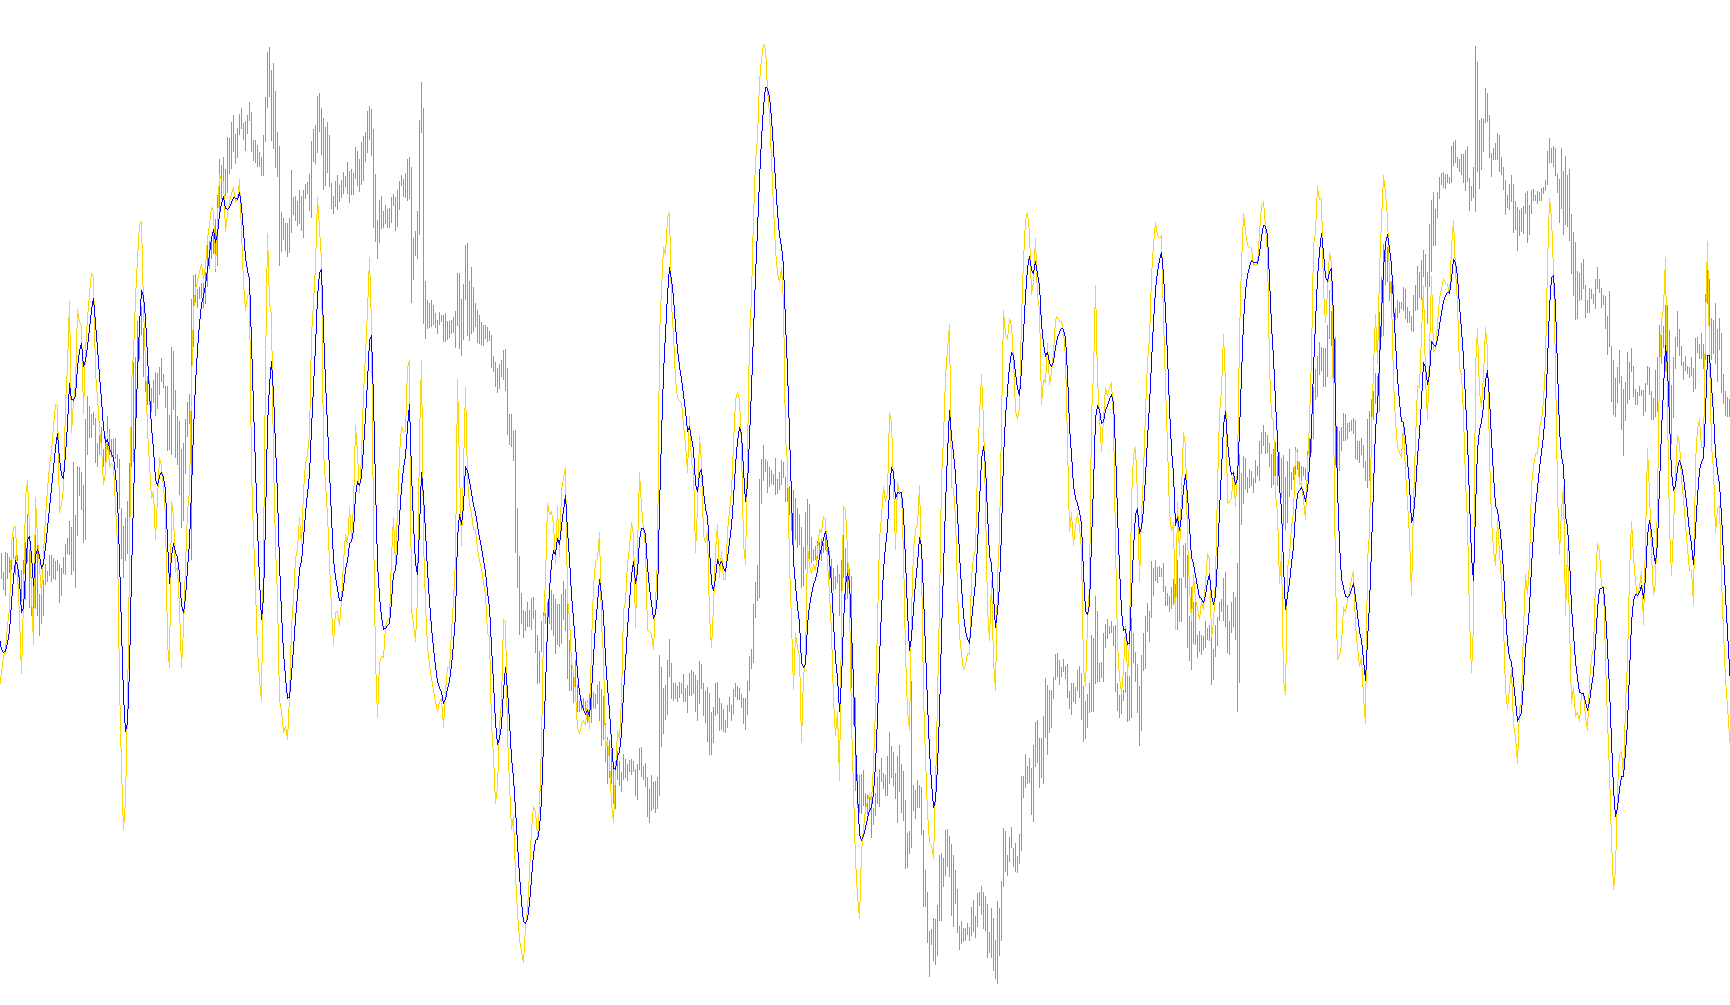
Calculates a smoothed directional trend by isolating and subtracting the accelerated component of price momentum fluctuations.

TDIVA cja
Indicator

TDIVA cja

iMAOnArrayiRSI

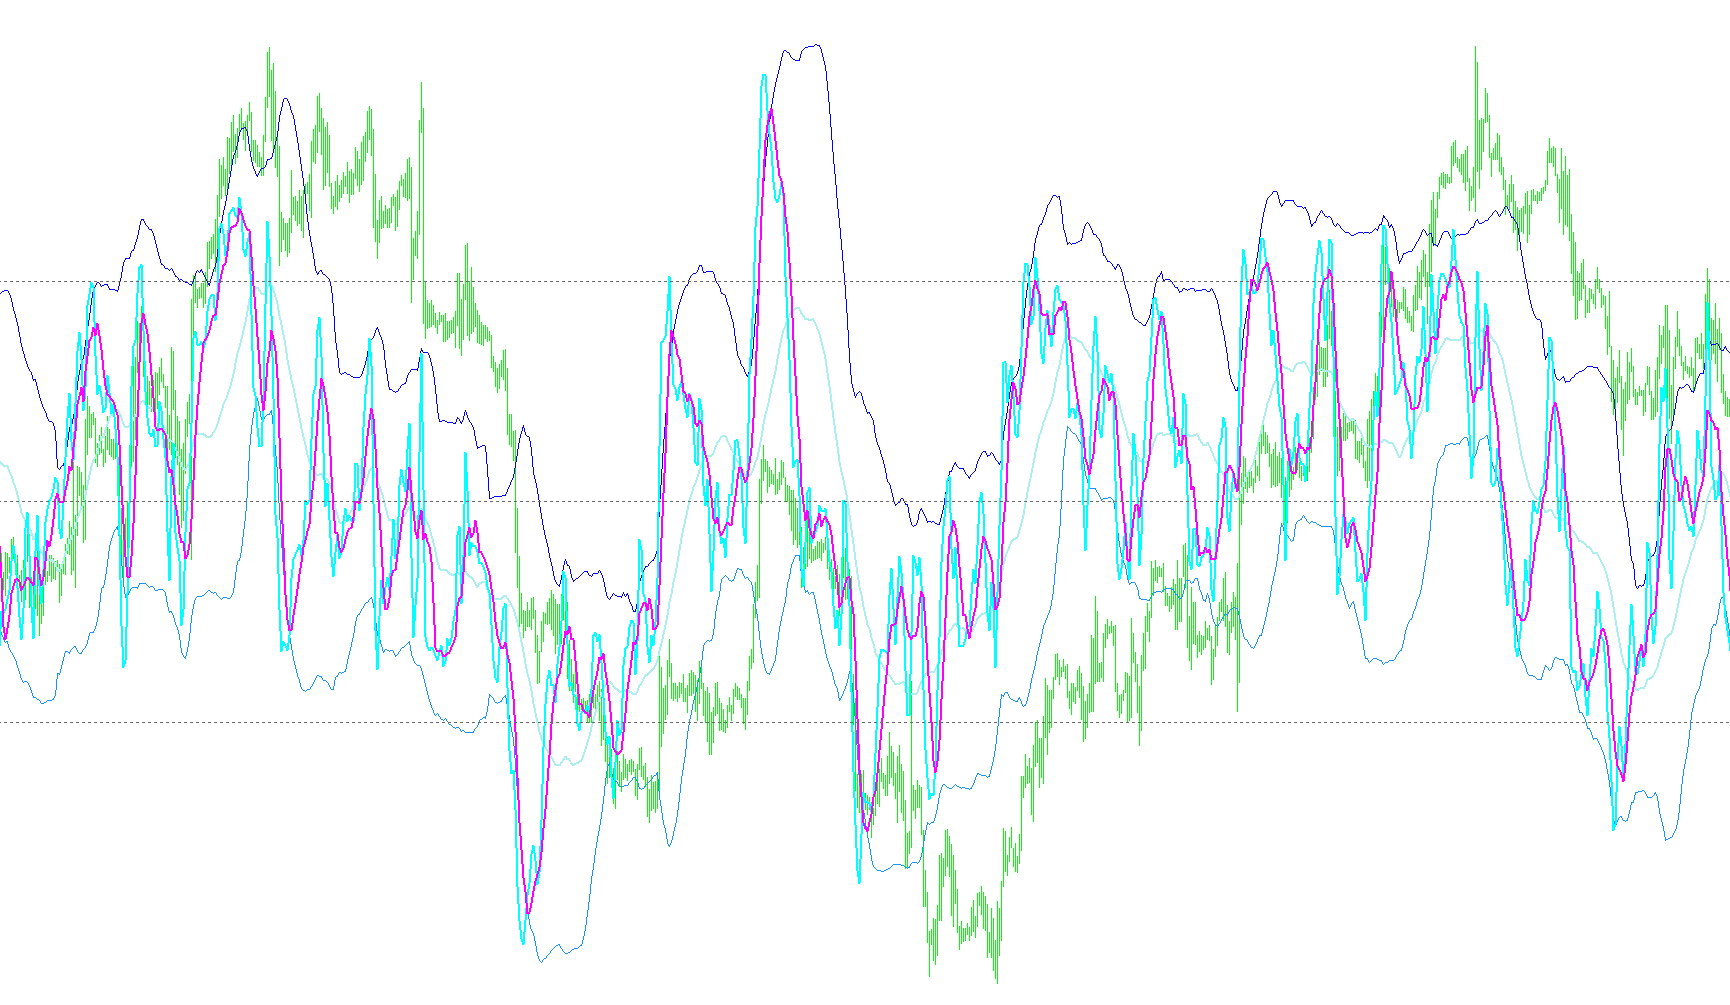
A hybrid technical indicator that synthesizes RSI price action, moving average signal crossovers, and standard deviation bands to identify trend strength, market consolidation, and multi-tiered entry points.

TDI_v1
Indicator

TDI_v1

iMAOnArray

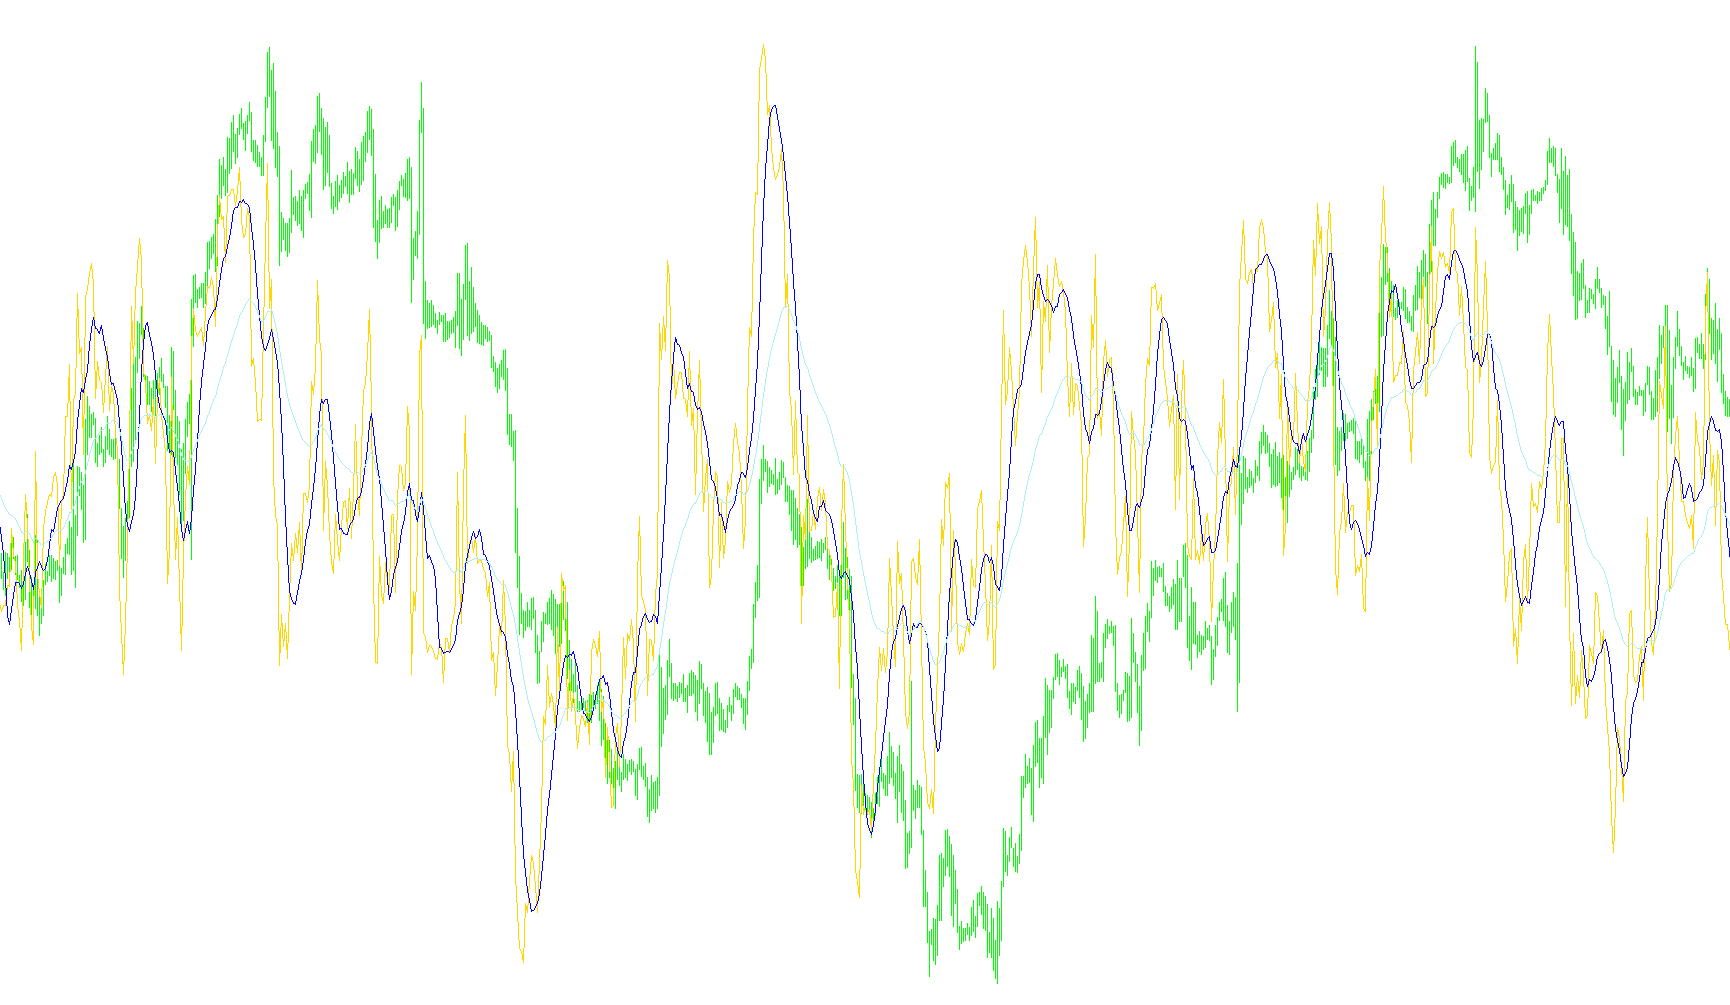
This indicator identifies market trend strength by calculating the difference between weighted momentum sums and their absolute magnitude variations.

TDI_v2
Indicator

TDI_v2

iMAOnArray

Calculates the trend direction by analyzing the variance between smoothed absolute momentum values and their weighted averages to identify price velocity shifts.

Ticks_Volume_Indicator
Indicator

Ticks_Volume_Indicator

iMAOnArray

This indicator quantifies market aggression by calculating the percentage divergence between smoothed upward and downward tick volumes to reveal underlying supply and demand dominance.

ticks_volume_indicator_1.1
Indicator

ticks_volume_indicator_1.1

iMAOnArray

This indicator quantifies market sentiment by calculating the percentage difference between smoothed upward and downward tick volumes to identify momentum exhaustion and price reversals.

to_ind_Acceleration_Bands
Indicator

to_ind_Acceleration_Bands

iMAOnArray

This indicator calculates dynamic upper and lower boundaries by weighting price expansion relative to the median midpoint and smoothing the resulting variance through moving averages.

to_ind_CandlCode_ICS
Indicator

to_ind_CandlCode_ICS

iMAOnArray

This indicator quantifies candlestick morphology by synthesizing body size, upper/lower shadow proportions, and relative volatility boundaries using dynamic Bollinger Band thresholds.

Traders Dynamic Index VISUAL ALERTS
Indicator

Traders Dynamic Index VISUAL ALERTS

iMAOnArrayiRSI

This hybrid indicator synchronizes RSI price action with standard deviation bands to identify trend velocity, market strength, and breakout potential through multi-layered signal crossover logic.

Traders Dynamic Index Visual Alerts_v2
Indicator

Traders Dynamic Index Visual Alerts_v2

iMAOnArrayiRSI

This hybrid indicator synthesizes RSI-based price action with dynamic standard deviation bands to simultaneously map trend direction, market strength, and volatility contraction.

Traders_Dynamic_Index
Indicator

Traders_Dynamic_Index

iMAOnArrayiRSI

A multi-layered hybrid indicator that synthesizes RSI momentum, standard deviation-based volatility bands, and moving average crossovers to identify trend strength and structural reversals.

Traders_Dynamic_Index_001
Indicator

Traders_Dynamic_Index_001

iMAOnArrayiRSI

This indicator synthesizes RSI price action, dual moving average crossovers, and Fibonacci-weighted standard deviation bands to provide a multi-layered view of trend trajectory, market velocity, and compression zones.

Indicator

Traders_Dynamic_Index_TDI_With_Alerts_TH

iMAOnArrayiRSI
Traders_Dynamic_Index_v2
Indicator

Traders_Dynamic_Index_v2

iMAOnArrayiRSI

A hybrid technical indicator that synchronizes RSI price action, smoothed signal crossovers, and Fibonacci-based volatility bands to identify trend strength and market expansion.

Traders_Dynamic_Index_Visual_Alerts_sound
Indicator

Traders_Dynamic_Index_Visual_Alerts_sound

iMAOnArrayiRSI

This multi-layered oscillator synthesizes RSI price action with standard deviation bands and moving averages to decode instantaneous momentum, structural trend shifts, and compression-based volatility cycles.

Trailing Stop Loss - Level
Indicator

Trailing Stop Loss - Level

iATRiMAOnArray

This indicator calculates a reactive trailing stop level by dynamically adjusting price buffers based on either a fixed delta or an exponential moving average of the Average True Range.

Trend strength index - Hassler
Indicator

Trend strength index - Hassler

iATRiMAOnArray

This indicator quantifies price velocity by normalizing the absolute difference between current and lagged closing prices against a dynamic Average True Range.

TrendRSI_v1
Indicator

TrendRSI_v1

iMAOnArrayiRSI

This indicator identifies trend dynamics by applying dual Simple and Exponential Moving Averages directly onto the Relative Strength Index data stream.

TrendRSI_v1_v1
Indicator

TrendRSI_v1_v1

iMAOnArrayiRSI

This indicator overlays a standard Relative Strength Index with two distinct moving averages to visualize momentum trends and identify potential structural shifts in price velocity.

Indicator

TRSI

iMAOnArrayiRSI
TRSI1
Indicator

TRSI1

iMAOnArrayiRSI

This indicator computes a multi-layered smoothing of the Relative Strength Index by applying nested exponential moving averages followed by a displaced simple moving average to filter out market noise.

TRSI2
Indicator

TRSI2

iMAOnArrayiRSI

This indicator calculates a nested series of three consecutive 3-period exponential moving averages on a standard RSI, followed by a 5-period simple moving average with a 3-bar displacement to filter noise and identify smoothed trend momentum.

TRSI_2
Indicator

TRSI_2

iMAOnArrayiRSI

This indicator generates a smoothed momentum signal by applying nested exponential moving averages to an RSI base, followed by a shifted simple moving average for trend filtering.

TRSI_L
Indicator

TRSI_L

iMAOnArrayiRSI

This indicator generates a multi-layered smoothing effect by applying successive 3-period exponential moving averages to an RSI base, finalized with a lagged 5-period simple moving average.

TSI-Osc(4AUG05)
Indicator

TSI-Osc(4AUG05)

iMAOnArray

This indicator calculates a momentum ratio by dividing the double exponentially smoothed price change by its absolute magnitude to identify trend strength and exhaustion.

TSI-Osc
Indicator

TSI-Osc

iMAOnArray

The indicator calculates the relative strength of price momentum by determining the ratio between double-smoothed exponential moving averages of raw price changes and their absolute values.

TSI-Osc_001
Indicator

TSI-Osc_001

iMAOnArray

The indicator calculates the percentage of directed momentum over absolute volatility by applying multi-layered Exponential Moving Averages to price fluctuations.

TSI-Osc_v1
Indicator

TSI-Osc_v1

iMAOnArray

This indicator quantifies market velocity by calculating the ratio between a double-smoothed momentum value and its absolute magnitude to identify trend strength and exhaustion.

TSI-Osc_v2
Indicator

TSI-Osc_v2

iMAOnArray

This indicator calculates a normalized momentum ratio by dividing the double-smoothed exponential moving average of price changes by the double-smoothed exponential moving average of their absolute values.

TSI-Osc_v3
Indicator

TSI-Osc_v3

iMAOnArray

This indicator calculates a smoothed ratio between the double-exponential moving average of price momentum and its absolute magnitude to identify directional strength.

TSI
Indicator

TSI

iMAOnArray

This indicator calculates the True Strength Index by determining the ratio between the double exponentially smoothed momentum and its absolute magnitude to highlight trend velocity.

TSI_MACD
Indicator

TSI_MACD

iMACDiMAOnArray

This indicator calculates a True Strength Index variant by normalizing the smoothed difference of MACD values against their absolute moving averages to reveal momentum intensity.

TSI_v1
Indicator

TSI_v1

iMAOnArray

This indicator calculates a percentage-based oscillator by determining the ratio between the double exponential moving average of price momentum and its absolute counterpart.
TSI_v2
Indicator

TSI_v2

iMAOnArray

This indicator calculates a normalized momentum value by determining the ratio between double exponentially smoothed price changes and their absolute magnitude.
Turbo_JMACD
Indicator

Turbo_JMACD

iMAOnArray

This indicator calculates the momentum variance between two distinct Turbo Jurik Moving Averages based on typical price data, overlaid with a smoothed signal line.

Indicator

TVI_v2

iMAOnArray
Ultimate_MA
Indicator

Ultimate_MA

iATRiMAOnArray

This indicator calculates a weighted moving average by combining three distinct timeframes and normalizing them against their respective Average True Range (ATR) values to balance price momentum and market volatility.

Ultimate_Oscillator
Indicator

Ultimate_Oscillator

iATRiMAOnArray

This indicator synthesizes multi-period price distance from the minimum low normalized by Average True Range to quantify momentum volatility.

UOSA
Indicator

UOSA

iATRiMAOnArray

This indicator quantifies market momentum by aggregating weighted moving averages of price-to-low distances normalized against multi-period Average True Ranges.

USDx
Indicator

USDx

iMAOnArray

This indicator calculates a weighted composite value of the US Dollar by applying specific power-law coefficients to multiple currency pairs and smoothing the resulting series with a Simple Moving Average.

Indicator

v+=-

iMAOnArray
v35260_Colored
Indicator

v35260_Colored

iMAOnArray

This indicator calculates the rate of change between consecutive smoothed Heiken Ashi values and visualizes momentum shifts via a dual-histogram tracking system and an overlaid SMA signal line.

VarMA_v1.1
Indicator

VarMA_v1.1

iMAOnArray

The logic utilizes an ADX-based momentum volatility filter to dynamically adjust the smoothing constant of a moving average, reacting to trend strength while neutralizing noise in stagnant markets.

Velocity_v2
Indicator

Velocity_v2

iMAOnArray

This indicator quantifies price velocity by applying multiple layers of moving average smoothing to the raw point change between consecutive bars.

Velocity_v2_v1
Indicator

Velocity_v2_v1

iMAOnArray

This indicator calculates price change rates and applies multi-layered moving averages to smooth the underlying velocity into a nested signal for identifying trend momentum.

VininI_BB_MA_WPR(v1)
Indicator

VininI_BB_MA_WPR(v1)

iWPRiMAOnArray

This indicator transforms the Williams Percent Range into a normalized scale and overlays Bollinger Bands with a Moving Average to identify volatility extremes and trend shifts in momentum.

VininI_MA_WPR(v1)
Indicator

VininI_MA_WPR(v1)

iWPRiMAOnArray

This indicator transforms the Williams Percent Range into a centered scale and applies a moving average to filter out noise for smoother momentum tracking.

VininI_MV_MA_WPR(v1)
Indicator

VininI_MV_MA_WPR(v1)

iWPRiMAOnArray

This indicator normalizes the Williams %R oscillator to a 0-100 scale and applies a moving average filter to identify smoothed momentum trends across disparate currency pairs.

VininI_RSI_FO
Indicator

VininI_RSI_FO

iMAOnArrayiRSI

This indicator transforms normalized Relative Strength Index values into a hyperbolic tangent momentum signal to identify overextended trend reversals.

VininI_RSI_FO_2m
Indicator

VininI_RSI_FO_2m

iMAOnArrayiRSI

This indicator synthesizes the relative strength of two distinct currency pairs by applying moving average smoothing and a hyperbolic tangent transformation to normalized RSI values.