SMI_v2
Indicator

SMI_v2

iMAOnArray

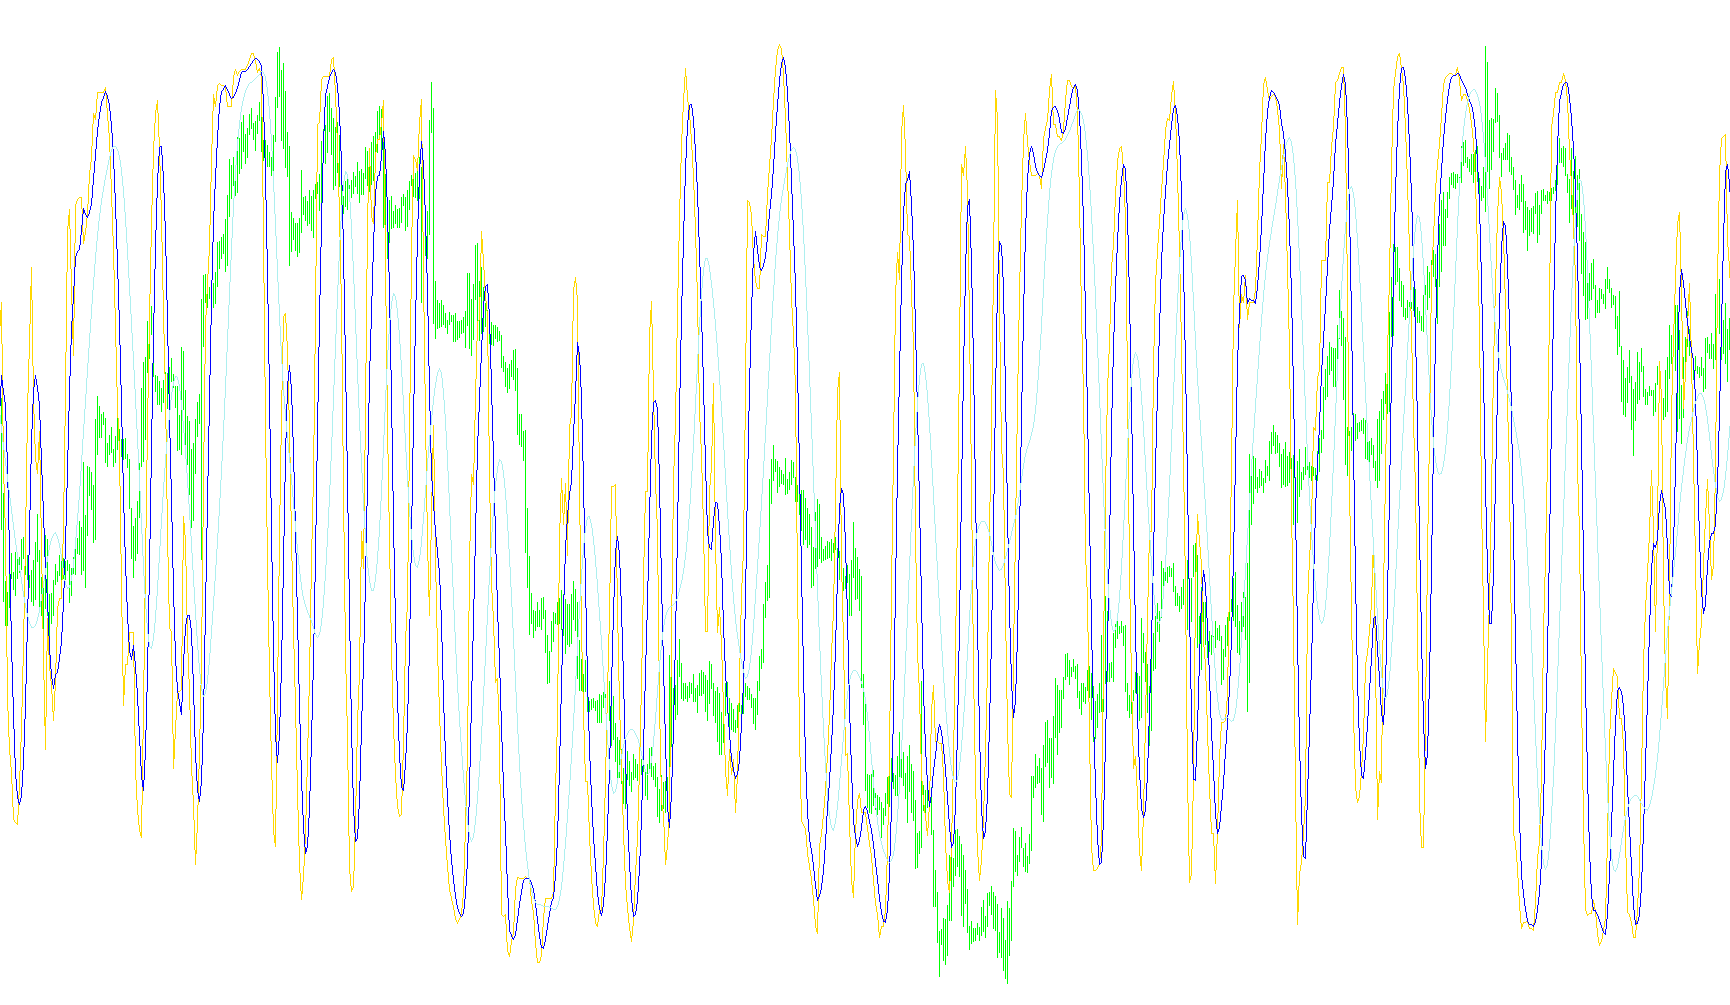
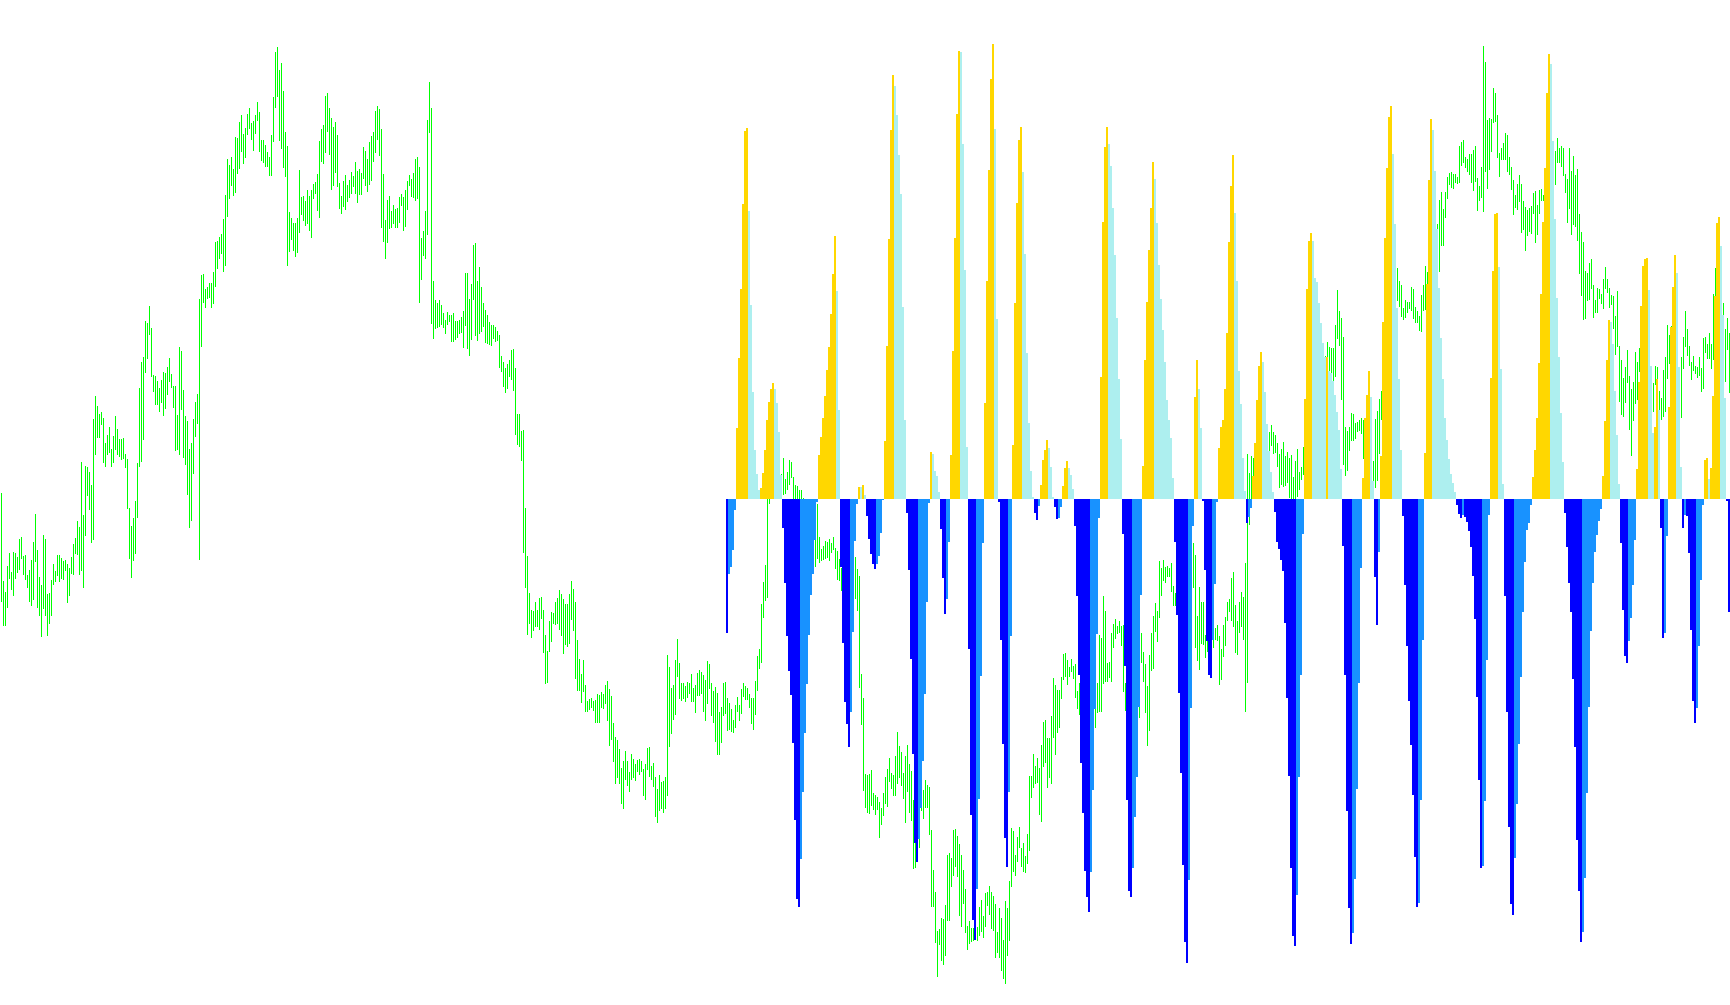
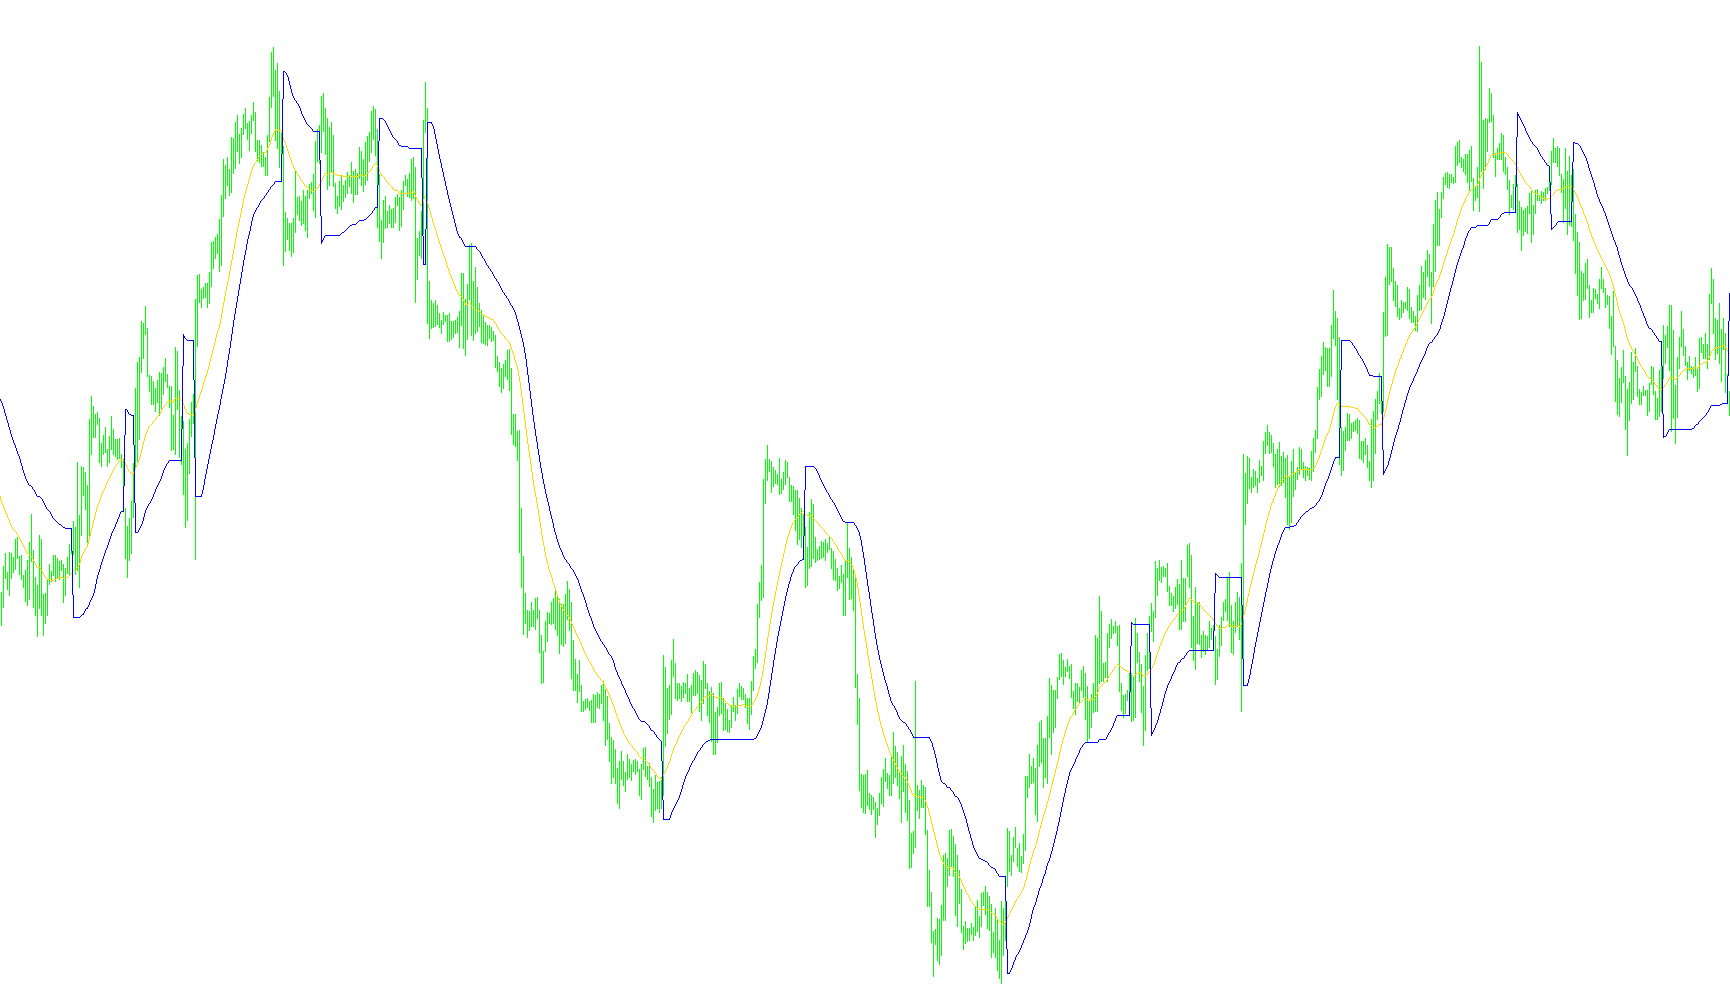
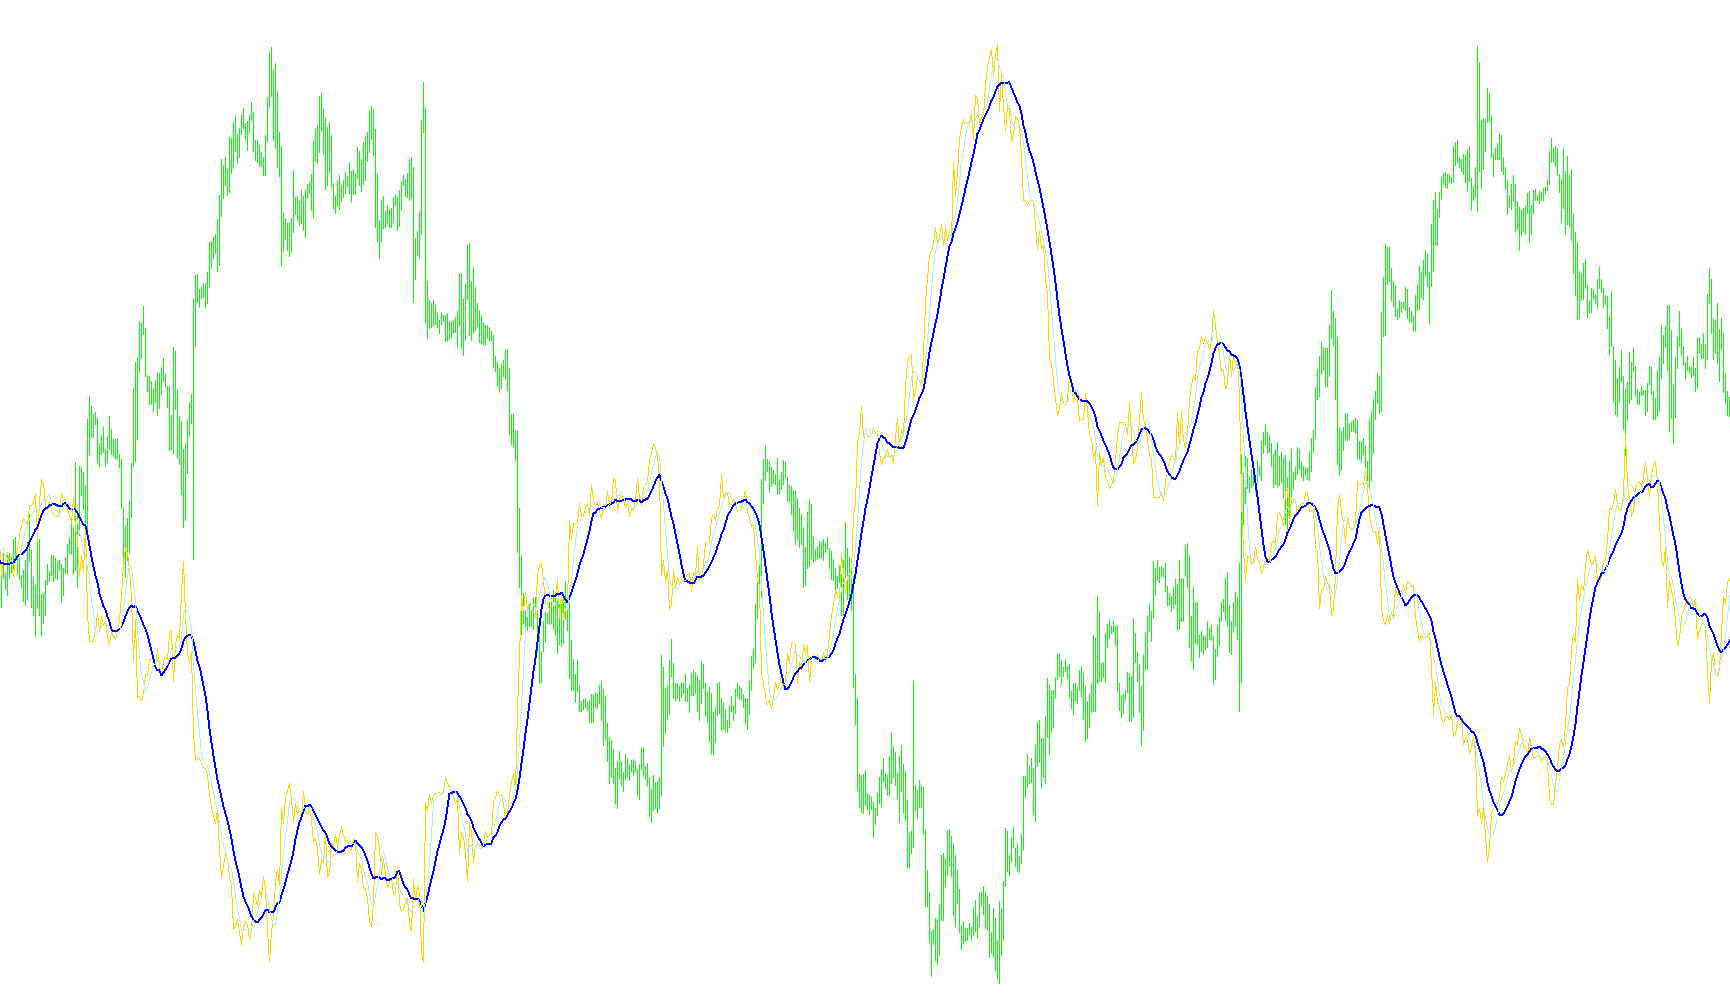
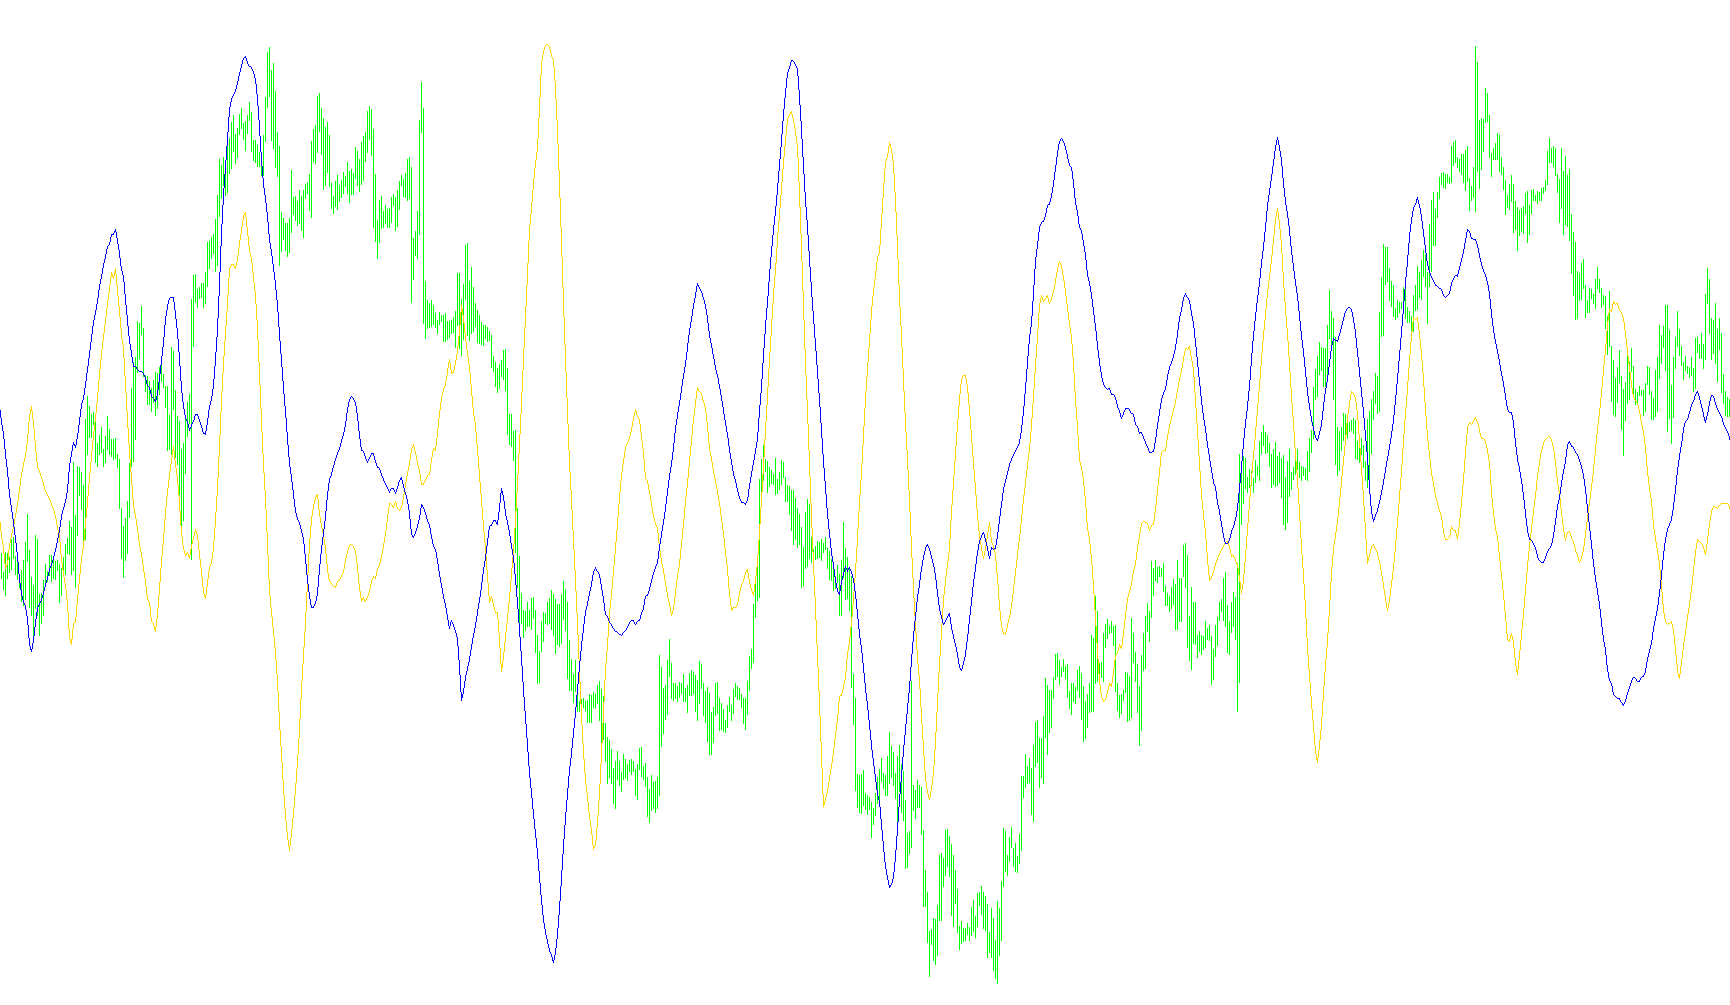
This indicator calculates a smoothed momentum ratio by evaluating the distance between current price and the median range, then applying nested exponential moving averages to filter noise.

SMI_v4
Indicator

SMI_v4

iMAOnArray

This indicator calculates a momentum oscillator by applying nested exponential moving averages to the ratio of smoothed price deviations relative to historical high-low ranges.

Solar_Wind_clean_X
Indicator

Solar_Wind_clean_X

iMAOnArray

This indicator normalizes price range volatility into a bounded distribution using the Fisher Transform and applies an exponential moving average to smooth out momentum fluctuations.

Solar_Wind_clean_Xalert
Indicator

Solar_Wind_clean_Xalert

iMAOnArray

This indicator applies a non-linear Fisher Transformation to price action normalized within a high-low range, followed by an exponential moving average to identify momentum shifts and zero-line crossovers.

Solar_Wind_clean_Xalert_001
Indicator

Solar_Wind_clean_Xalert_001

iMAOnArray

This indicator normalizes price action into a bounded range before applying a logarithmic Fisher Transformation and an Exponential Moving Average to identify zero-line momentum crossovers.

Indicator

Solar_Wind_clean_XSm_mtf

iMAOnArray
Indicator

Solar_Wind_clean_X_mtf

iMAOnArray
Solar_Wind_clean_X_v2
Indicator

Solar_Wind_clean_X_v2

iMAOnArray

This indicator applies a Fisher Transformation to price range dynamics, followed by an exponential moving average to smooth out directional volatility into a binary histogram.

SpearmanRankCorrS
Indicator

SpearmanRankCorrS

iMAOnArray

This indicator quantifies the monotonic relationship between price movements by calculating the Spearman rank correlation coefficient across a rolling window to identify trend strength independent of volatility.

Special RSI ARROW
Indicator

Special RSI ARROW

iATRiMAOnArrayiRSI

This indicator identifies trend reversals by calculating the exponential moving average of the delta between two distinct RSI periods to detect significant momentum shifts.

Special RSI ARROW_001
Indicator

Special RSI ARROW_001

iMAOnArrayiRSI

This indicator identifies trend reversals by calculating a smoothed moving average of the delta between two different RSI periods and generating directional signals based on significant threshold breaches.

SRCma
Indicator

SRCma

iMAOnArray

This indicator quantifies the non-linear monotonic relationship between price movements by calculating the rank correlation coefficient across a sliding window.

SRCx2MA
Indicator

SRCx2MA

iMAOnArray

This indicator calculates the volatility variance between dual Source Moving Average (SRCma) inputs and applies an SMA smoothing filter to identify directional momentum shifts via histogram displacement.
SRCx2MA_arr
Indicator

SRCx2MA_arr

iMAOnArray

This indicator identifies trend reversals by calculating the smoothed differential between two Source Moving Average (SRCma) values and detecting zero-line crossovers of their residual momentum.

sStochastic
Indicator

sStochastic

iMAOnArray

The logic identifies momentum shifts by calculating the relative position of closing prices within high-low ranges and triggers alerts upon crossing specific 30 and 70 intensity boundaries.

Stochastic 2,3,3
Indicator

Stochastic 2,3,3

iMAOnArray

This algorithm calculates a percentage-based momentum value by comparing the relative position of recent closing prices within a defined high-low price range.

Stochastic 21,9,9
Indicator

Stochastic 21,9,9

iMAOnArray

Calculates the relative position of current prices within a defined price range to identify overbought and oversold momentum shifts.

Stochastic classical
Indicator

Stochastic classical

iMAOnArray

Calculates a smoothed percentage of price position within a rolling peak-to-trough window to identify overbought and oversold momentum shifts.

Stochastic-q
Indicator

Stochastic-q

iMAOnArrayiRSI

This indicator calculates a smoothed percentage of relative strength by deriving high and low boundaries from internal RSI values over a rolling period.

Stochastic
Indicator

Stochastic

iMAOnArray

This indicator calculates a relative percentage of current closing prices relative to the highest highs and lowest lows over a defined lookback window.

Stochastic1
Indicator

Stochastic1

iMAOnArray

This indicator calculates the relative position of current closing prices within a defined range of price extremes to identify overbought and oversold market conditions.

Stochastic4Alerts_v2
Indicator

Stochastic4Alerts_v2

iMAOnArray

This indicator calculates a standard stochastic oscillator and monitors price intersections with four customizable threshold levels to trigger real-time auditory and visual notifications.

StochasticAlertOBOS
Indicator

StochasticAlertOBOS

iMAOnArrayiStochastic

This indicator identifies overextended price cycles by calculating the relative position of current closing prices against high-low ranges, triggering alerts on bullish and bearish crossovers within extreme zones.

StochasticRSI
Indicator

StochasticRSI

iMAOnArrayiRSI

This indicator synthesizes Relative Strength Index values into a normalized stochastic range, further smoothed by a linear weighted moving average to identify cyclical price exhaustion.

Indicator

StochasticRSI_mtf

iMAOnArrayiRSI
StochasticTrad
Indicator

StochasticTrad

iMAOnArray

This technical indicator calculates the relative position of current closing prices within a high-low range to determine overbought or oversold momentum levels.

Stochastic_NoLastBar
Indicator

Stochastic_NoLastBar

iMAOnArray

This indicator calculates a smoothed momentum oscillator while intentionally excluding the volatile real-time price action of the current forming candle to provide cleaner, confirmed signals.

Stochastic_v2
Indicator

Stochastic_v2

iMAOnArray

The algorithm quantifies relative price position by calculating the percentage proximity of current closes to previous high-low extremes over a smoothed moving average.

Stochastic_with_Shade
Indicator

Stochastic_with_Shade

iMAOnArray

This indicator calculates the relative position of price using a standard stochastic formula while overlaying a dynamic color-shaded background that highlights momentum crossovers between the main and signal lines.

StochR% Super Position
Indicator

StochR% Super Position

iWPRiMAOnArrayiStochastic

This indicator synthesizes Williams %R and Stochastic oscillators into a unified superposition, applying multi-layered linear weighted moving averages to identify trend momentum and structural divergence.

Stoch_Sound_Email
Indicator

Stoch_Sound_Email

iMAOnArray

This indicator calculates a classic stochastic oscillator and triggers immediate audio alerts or email notifications upon detecting bullish or bearish signal line crossovers.

Stoch_Sound_Email_v2
Indicator

Stoch_Sound_Email_v2

iMAOnArray

This indicator monitors Stochastic oscillator crossovers to trigger instantaneous audio notifications and automated email alerts for trend reversals.

Stomach
Indicator

Stomach

iMAOnArray

This indicator calculates a standard Stochastic Oscillator and applies an additional Moving Average layer to filter noise and identify underlying momentum trends.

sto_JMA_Stochastic_KDSL
Indicator

sto_JMA_Stochastic_KDSL

iMAOnArrayiStochastic

This indicator applies a Jurik Moving Average (JMA) smoothing algorithm to the Stochastic Oscillator to reduce noise and identify high-probability momentum shifts.

Stretch
Indicator

Stretch

iMAOnArray

The logic identifies the average proximity of price action to the opening value by calculating the minimum distance between highs and lows relative to each candle's open.

SumLogSample
Indicator

SumLogSample

iMAOnArray

The indicator calculates a weighted sum of logarithmic price returns across EURUSD, GBPUSD, USDJPY, and AUDUSD to synthesize a unified currency strength momentum signal.

SuperTrend_002
Indicator

SuperTrend_002

iMAOnArray

This indicator identifies market direction by calculating a trailing stop level based on the weighted average of price volatility and multiple moving average types.

Symbol_Index_MA_
Indicator

Symbol_Index_MA_

iMAOnArray

Calculates a composite currency strength value by aggregating geometric means of specific forex pairs to derive an underlying relative price index.

synchronize
Indicator

synchronize

iMAOnArray

This indicator calculates the price velocity of three distinct currency pairs and smooths their individual rate changes using a linear weighted moving average to identify synchronized market momentum.

Synergy_DSR
Indicator

Synergy_DSR

iMAOnArray

This indicator identifies key market structure levels by calculating the mean of high, low, and close prices against a smoothed moving average to pinpoint dynamic support and resistance zones.

Synergy_TDI
Indicator

Synergy_TDI

iMAOnArrayiRSI

This indicator utilizes RSI price data combined with Bollinger Band-style volatility envelopes and SMA crossovers to identify trend momentum and potential reversal zones.

Indicator

T3.Lnx

iMAOnArray
Indicator

T3.Lnx_v1

iMAOnArray
Indicator

TARZAN+ALERT

iMAOnArrayiRSI
Indicator

TARZAN

iMAOnArrayiRSI
TDI-2
Indicator

TDI-2

iMAOnArray

This indicator calculates the difference between smoothed absolute momentum sums and multi-period moving averages to isolate directional price velocity.

TDI-2_001
Indicator

TDI-2_001

iMAOnArray

This indicator calculates a smoothed directional trend by measuring the delta between absolute momentum sums and their multi-period averages to identify price velocity shifts.

TDI-2_v1
Indicator

TDI-2_v1

iMAOnArray

This indicator calculates a trend direction index by analyzing the variance between smoothed momentum values and their absolute averages over a specified lookback period.

TDI-2_v2
Indicator

TDI-2_v2

iMAOnArray

This indicator calculates a directional trend index by contrasting the smoothed absolute sum of price momentum against its weighted cumulative variance.

Indicator

TDI-With Alerts

iMAOnArrayiRSI