Indicator

5_bar_SVM_input

iMACD
Alert MACD Slow
Indicator

Alert MACD Slow

iMACDiMA

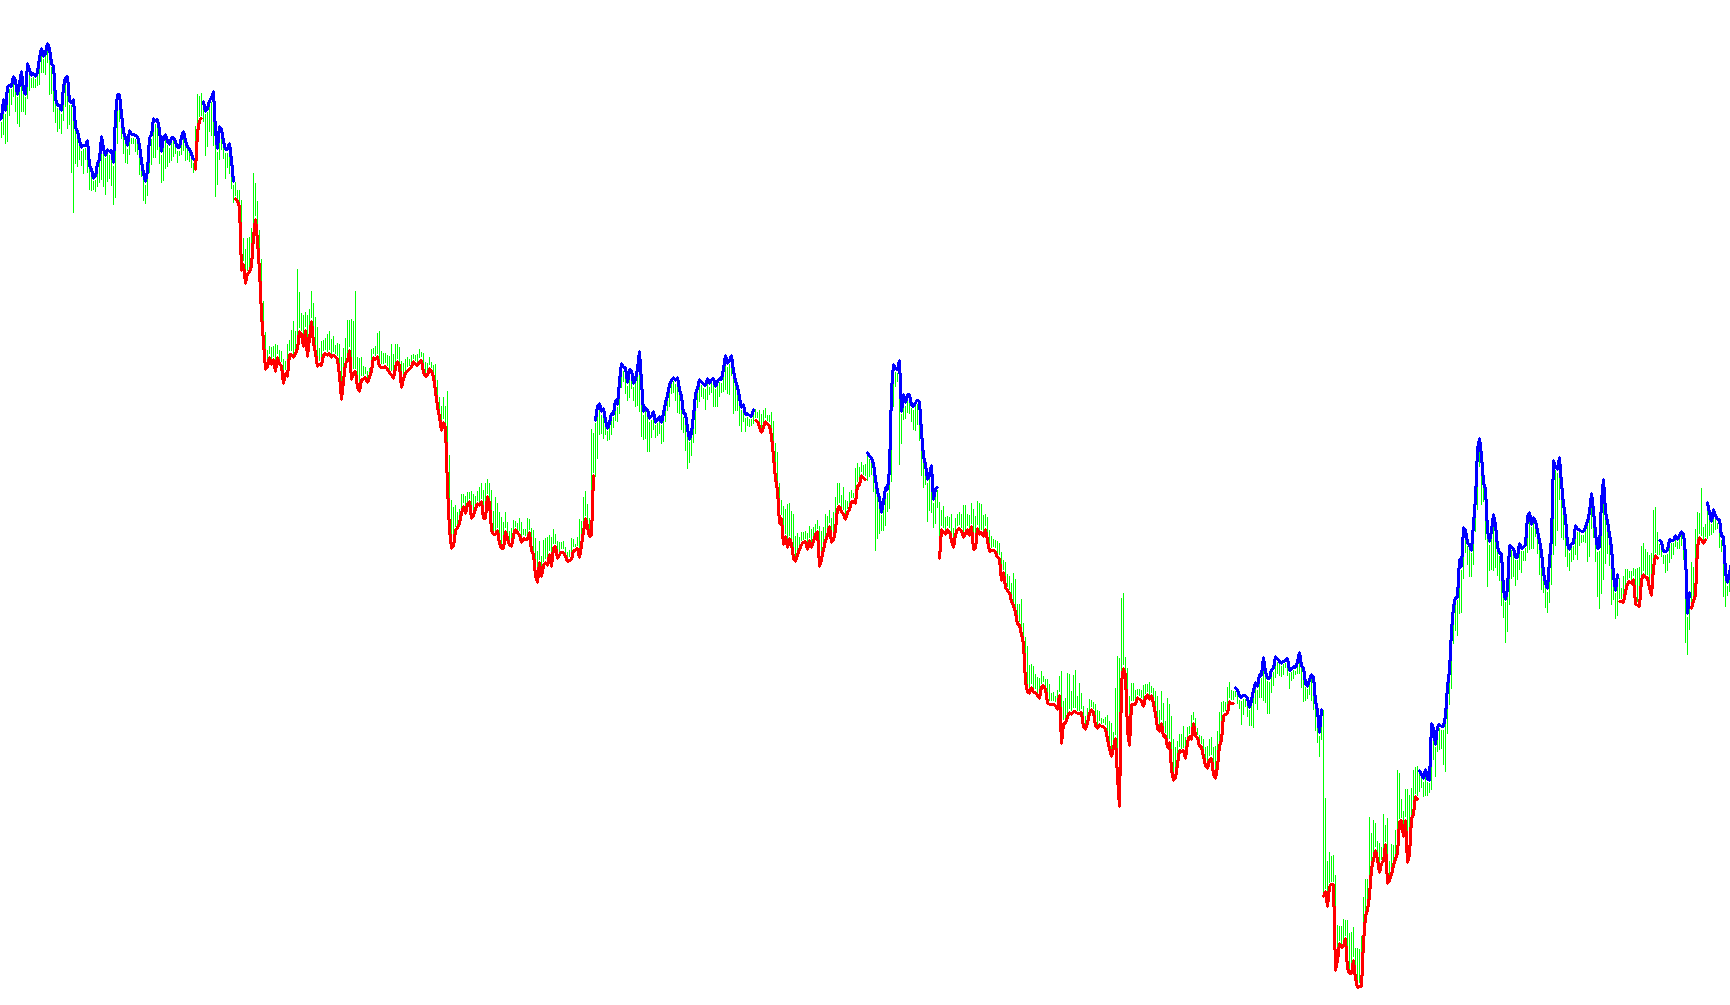
This algorithm identifies trend reversal points by detecting specific MACD price fluctuations combined with EMA crossovers and breakout price action.

Alert_MACD
Indicator

Alert_MACD

iMACD

This indicator triggers a real-time alert by detecting the precise moment when the main MACD line crosses the signal line relative to the previous candle's state.

Indicator

All MACD v1.0

iMACD
Indicator

All MACD v1[1].0 4 color

iMACDiOsMA
arbitrage
Indicator

arbitrage

iCCIiMACDiRSIiStochastic

This indicator calculates and visualizes the relative divergence between primary and secondary currency pairs by synthesizing multiple technical oscillators into a unified correlation stream.

AudioAlerts20090201
Indicator

AudioAlerts20090201

iMACDiMAiStochastic

This indicator executes multi-factor confluence logic by synchronizing MACD trend shifts, Stochastic oscillator thresholds, and dual Exponential Moving Average crossovers to trigger precise entry alerts.

bbmacd
Indicator

bbmacd

iBandsiMACDiMA

This indicator synthesizes Bollinger Band deviations with a dual-layered MACD calculation to visualize trend intensity and momentum shifts in a single oscillator window.

Indicator

BB_Squeeze_Advanced_v2

iCCIiMACDiRSIiStochastic
Indicator

BB_Squeeze_Advanced_v2M

iCCIiMACDiRSIiStochastic
Indicator

BB_Squeeze_Advanced_v2M2

iCCIiMACDiRSIiStochastic
Indicator

BB_Squeeze_Advanced_v2M3

iCCIiMACDiRSIiStochastic
Indicator

BB_Squeeze_Advanced_v2M3B

iCCIiMACDiRSIiStochastic
Indicator

BB_Squeeze_Advanced_v2M3BC

iCCIiMACDiRSIiStochastic
Indicator

BB_Squeeze_Advanced_v2_v1

iCCIiMACDiRSIiStochastic
BillWilliams_ATZ
Indicator

BillWilliams_ATZ

iACiAlligatoriAOiMACD
BinaryWave
Indicator

BinaryWave

iCCIiMACDiOsMAiMA
Brooky_MACD_Ichimoku_V2
Indicator

Brooky_MACD_Ichimoku_V2

iMACD

This indicator projects the Ichimoku Kinko Hyo framework onto the MACD momentum values to identify trend strength and equilibrium zones within moving average crossovers.

Burger MACD
Indicator

Burger MACD

iMACD

This indicator captures higher timeframe momentum by mapping and projecting MACD main line fluctuations onto the current chart for trend synchronization.

BuySellIndicators
Indicator

BuySellIndicators

iMACDiRVI

This indicator identifies high-probability entry points by detecting simultaneous bullish or bearish crossovers between the Relative Volatility Index (RVI) and Moving Average Convergence Divergence (MACD).

Indicator

Candle Signal

iMACD
CheckMarkPattern_AD
Indicator

CheckMarkPattern_AD

iMACDiMomentumiRVIiRSI

This indicator identifies bullish and bearish patterns by detecting inverse price-to-oscillator extremums across multiple technical metrics.

Indicator

COGMACD

iMACDiStdDevOnArray
Cowabunga
Indicator

Cowabunga

iMACDiMAiRSIiStochastic

This indicator identifies bullish and bearish momentum by synchronizing H4 timeframe trend filters—incorporating EMA crossovers, RSI levels, and Stochastic shifts—with real-time MACD and Stochastic trigger signals on lower timeframes.

Indicator

CurrencyDeviation-V1b04

iMACDiMAiRSI
Daily Forex Signal
Indicator

Daily Forex Signal

iMACDiMAiRSIiStochastic

This indicator identifies high-probability entries by synchronizing exponential moving average trends across M30, H1, H4, and D1 timeframes with RSI and MACD momentum filters.

Divergence
Indicator

Divergence

iMACDiMomentumiADXiRSI

Identifies structural price-momentum asymmetries by correlating localized peaks and troughs across various technical oscillators against price action.

divergencepetr_s7
Indicator

divergencepetr_s7

iADiACiATRiADX
divergenceviewer_ad
Indicator

divergenceviewer_ad

iMACDiMomentumiRVIiRSI

This indicator identifies and classifies complex price-momentum discrepancies by synchronizing market extremums with multiple technical oscillators, including William %R, RSI, MACD, and custom inputs.

Indicator

Divergence_Petr

iADiACiATRiADX
Divergence_v1
Indicator

Divergence_v1

iMACDiMomentumiADXiRSI

This indicator identifies price-momentum discrepancies by cross-referencing structural peaks and troughs against MACD, RSI, DMI, or Momentum oscillators to highlight potential trend reversals.

Divergence_v2
Indicator

Divergence_v2

iMACDiMomentumiADXiRSI

This indicator identifies potential trend exhaustion by detecting structural discrepancies between price extremes and the momentum peaks of selected oscillators like MACD, RSI, ADX, or Momentum.

Divergence_v3
Indicator

Divergence_v3

iMACDiMomentumiADXiRSI

This indicator identifies structural price-momentum discrepancies by comparing localized market peaks and troughs against oscillating values from MACD, RSI, DMI, or Momentum.

DiverMACD
Indicator

DiverMACD

iMACD

This indicator detects and plots classical and hidden bullish/bearish divergences by comparing price action extremes against MACD oscillator peaks and troughs.

DTS-InfoTrade
Indicator

DTS-InfoTrade

iCCIiMACDiRSIiStochastic

This indicator aggregates MACD, RSI, Stochastic, and CCI data across multiple timeframes to provide a real-time visual heatmap of trend sentiment and volatility metrics.

Elder Impulse Candle Color
Indicator

Elder Impulse Candle Color

iMACDiMA

This indicator visualizes price action by overlaying Heiken Ashi candles that undergo dynamic color shifts based on the simultaneous directional alignment of Exponential Moving Averages and MACD momentum.

Elder Impulse Candle Color1
Indicator

Elder Impulse Candle Color1

iMACDiMA

This indicator filters price action by dynamically coloring Heiken Ashi bars based on the convergence of Exponential Moving Average slopes and MACD histogram momentum.

Elder Impulse Candle Color_v1
Indicator

Elder Impulse Candle Color_v1

iMACDiMA

This indicator dynamically colors price bars based on the synchronized alignment of Exponential Moving Average trends and MACD momentum shifts.

Elder_Impulse_MTF
Indicator

Elder_Impulse_MTF

iMACDiMA

This indicator identifies trend alignment by correlating the directional slope of an Exponential Moving Average with the momentum shifts from a MACD calculation.

Elder_Impulse_MTF1
Indicator

Elder_Impulse_MTF1

iMACDiMA

This indicator identifies price trend synchronization by categorizing market momentum into distinct bullish, bearish, or neutral states based on the concurrent directional alignment of EMA slopes and MACD histogram dynamics.

Indicator

Elliott Wave indic

iBearsPoweriBullsPoweriCCIiRSI
Indicator

Elliott Wave indic_v1

iBearsPoweriBullsPoweriCCIiRSI
Elliott_Waves
Indicator

Elliott_Waves

iBWMFIiFractalsiMACD
eSignal
Indicator

eSignal

iMACDiMA

This indicator identifies directional momentum by synchronizing the trajectory of Exponential Moving Averages with MACD histogram shifts across multiple timeframes.

FerruFx_Multi_info THV
Indicator

FerruFx_Multi_info THV

iCCIiMACDiADXiMA
FerruFx_Multi_info+
Indicator

FerruFx_Multi_info+

iCCIiMACDiADXiMA

This indicator synthesizes real-time trend data from moving averages, CCI, MACD, ADX, and Bulls/Bears power across multiple timeframes to provide a comprehensive visual heat map of market sentiment and trade statistics.

FerruFx_Multi_info+_light_chart_v1.1
Indicator

FerruFx_Multi_info+_light_chart_v1.1

iCCIiMACDiADXiMA
FerruFx_Multi_info+_light_chart_v1.1_001
Indicator

FerruFx_Multi_info+_light_chart_v1.1_001

iCCIiMACDiADXiMA
FerruFx_Multi_info+_light_chart_v1[1].1-Ndisc
Indicator

FerruFx_Multi_info+_light_chart_v1[1].1-Ndisc

iCCIiMACDiADXiMA
FerruFx_Multi_info+_v1[1].2
Indicator

FerruFx_Multi_info+_v1[1].2

iCCIiMACDiADXiMA

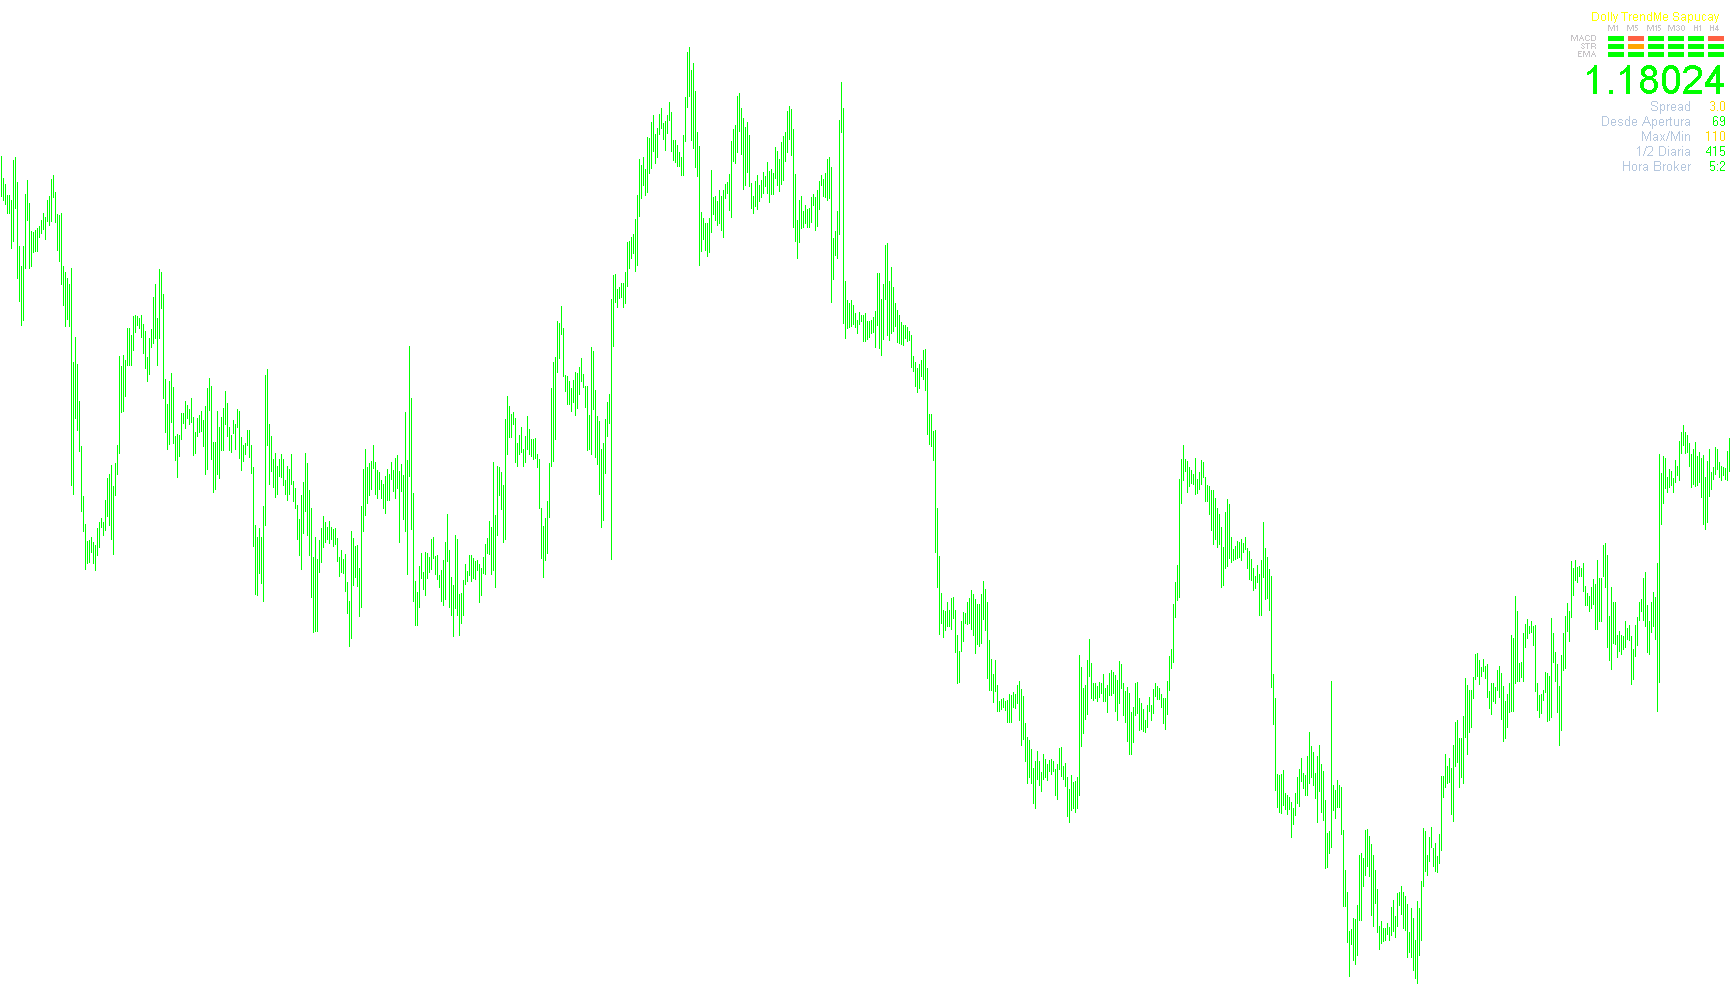
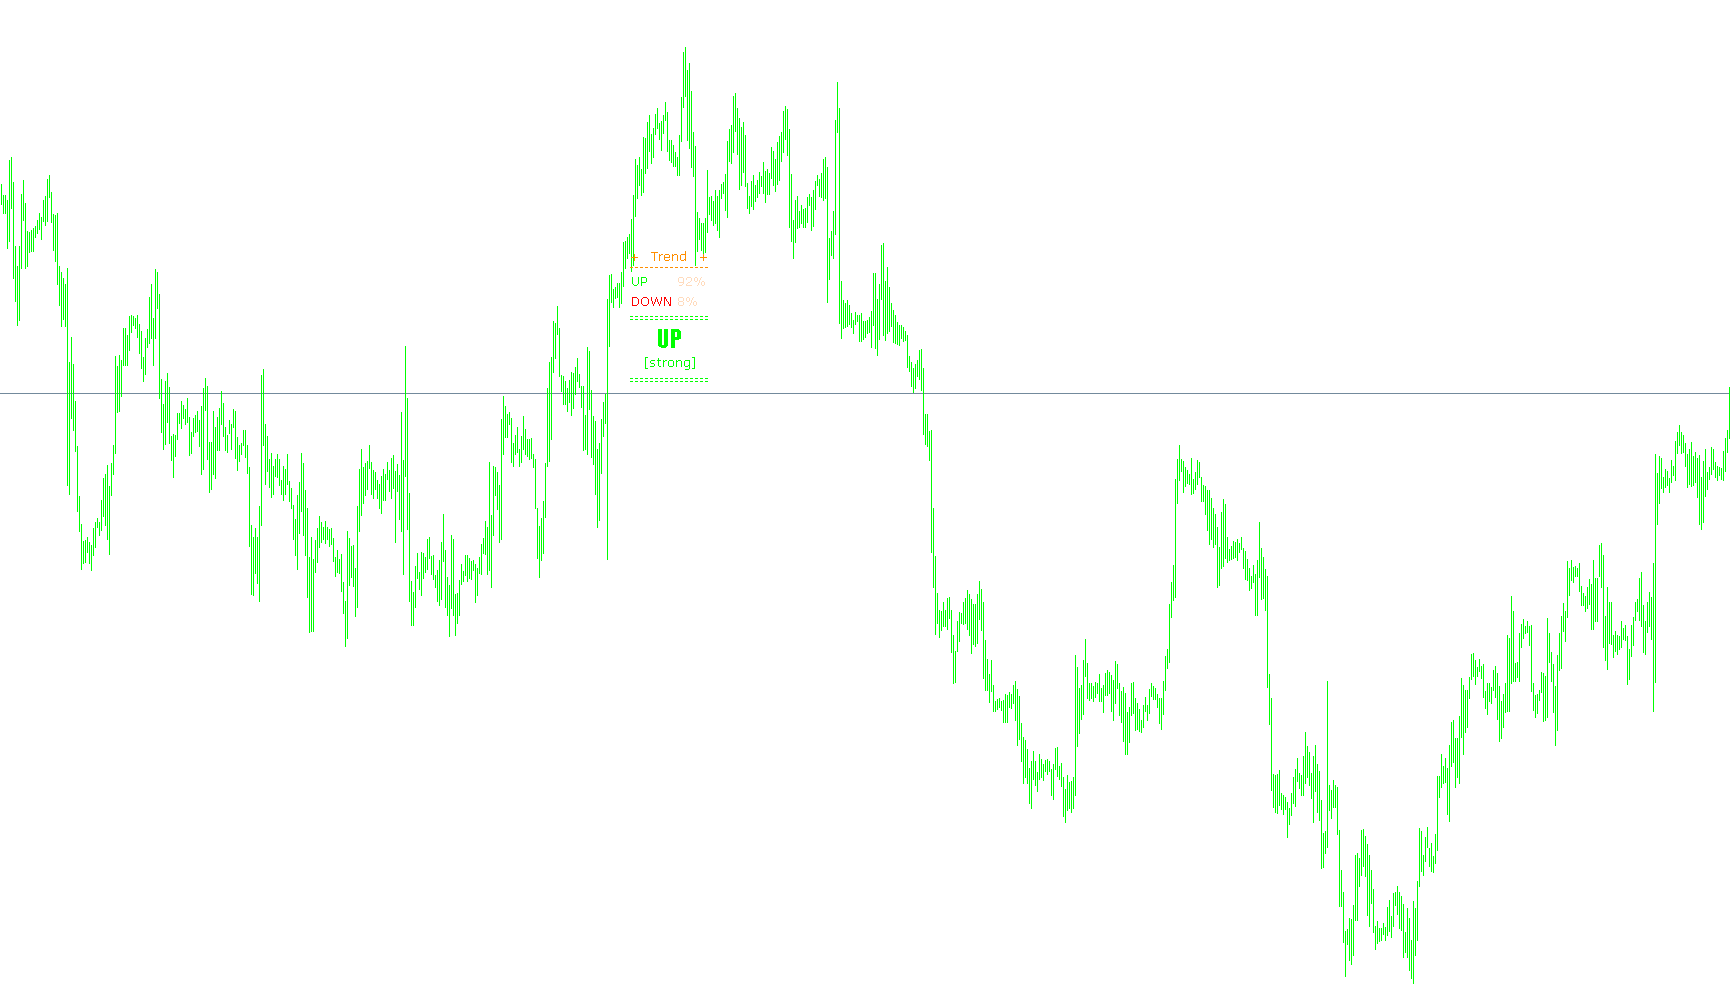
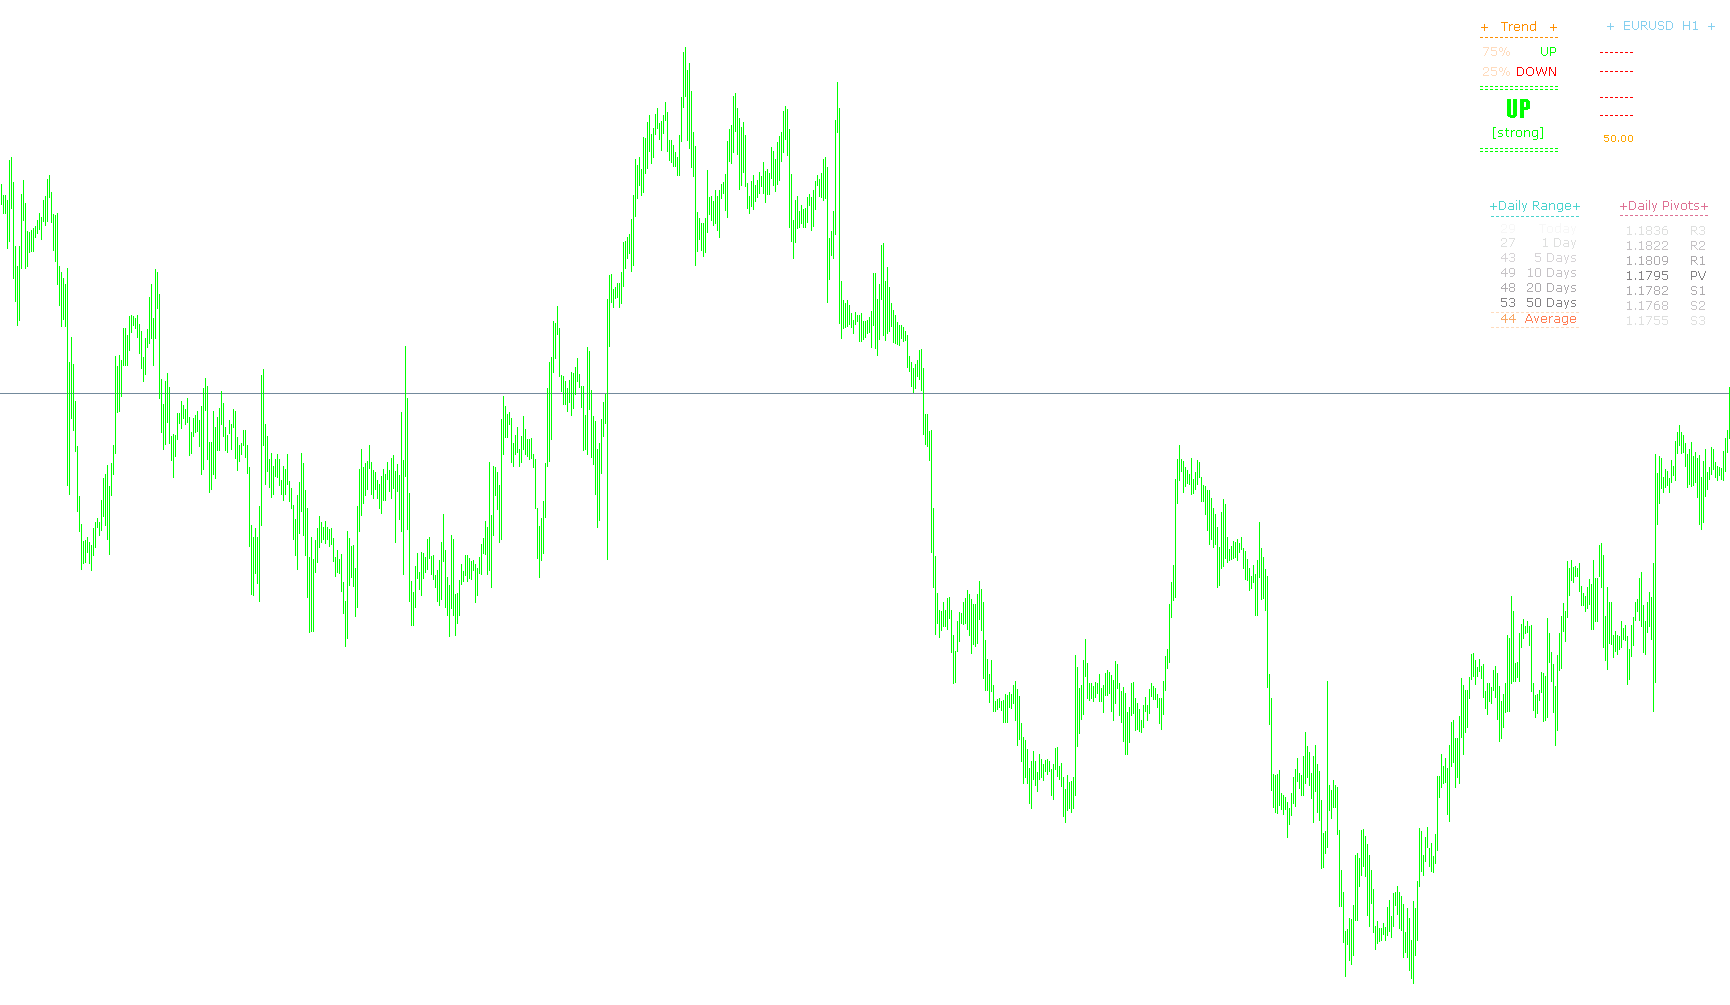
This indicator provides a customizable dashboard displaying account information and aggregated trend analysis from multiple indicators across various timeframes, allowing traders to quickly assess market direction.