Macd Support and Resistance
Indicator

Macd Support and Resistance

iMACD

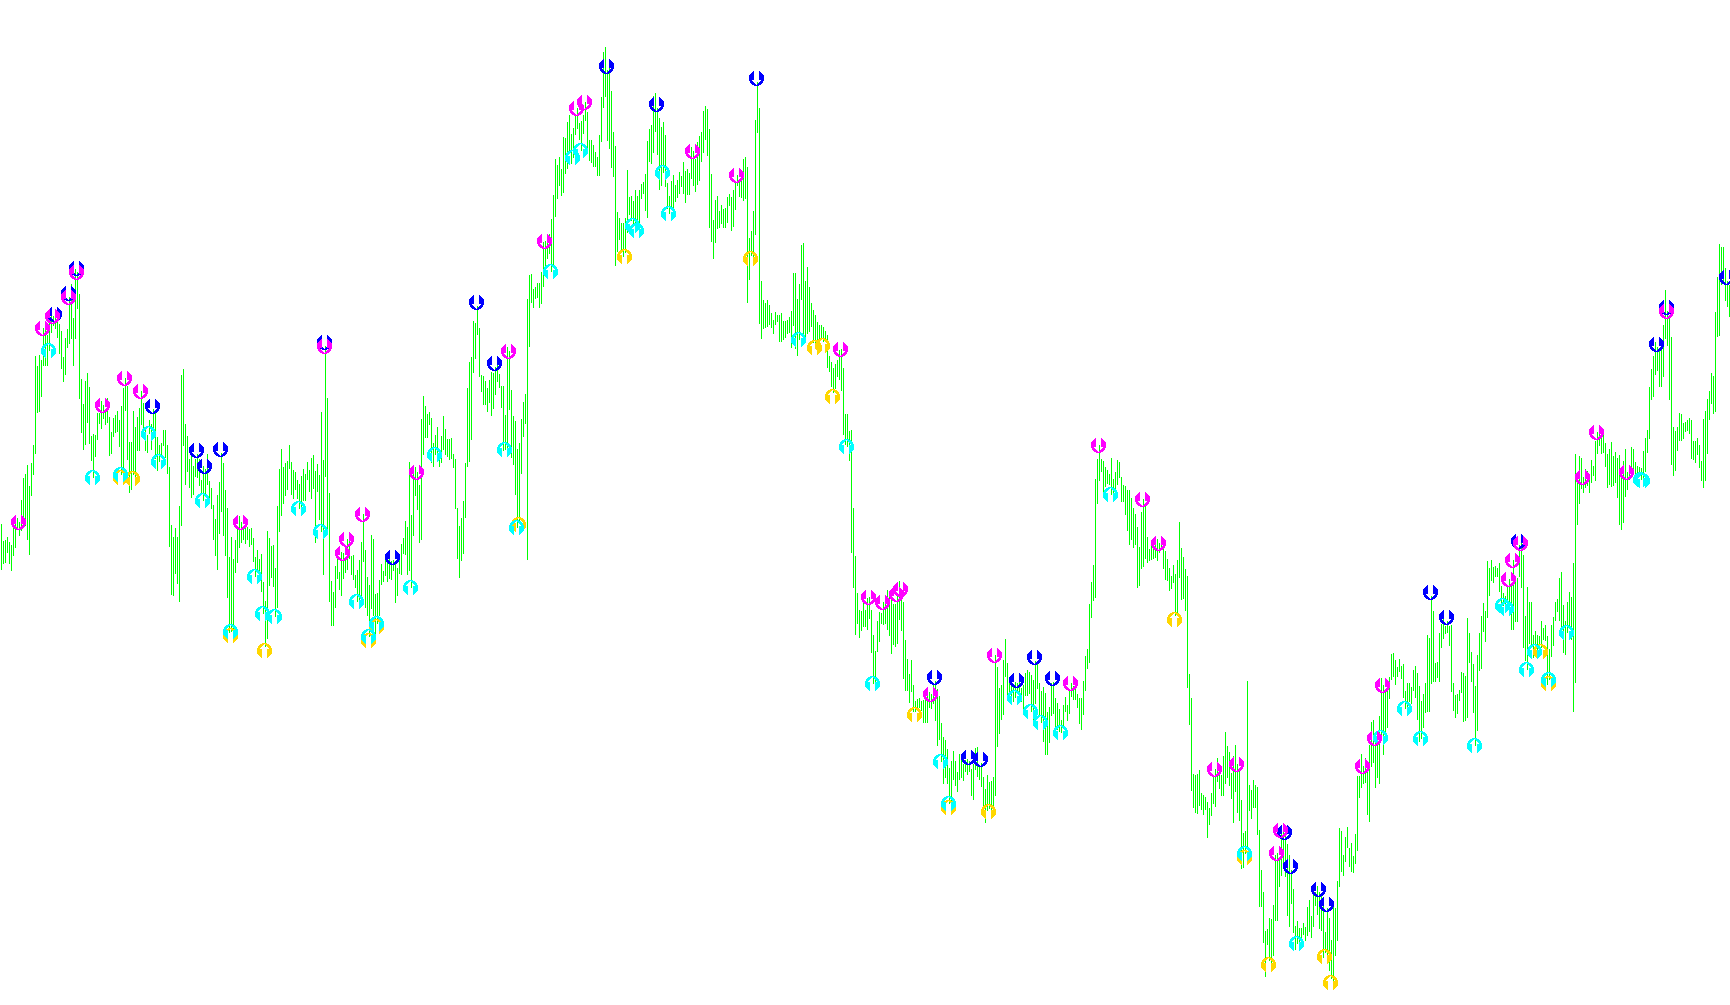
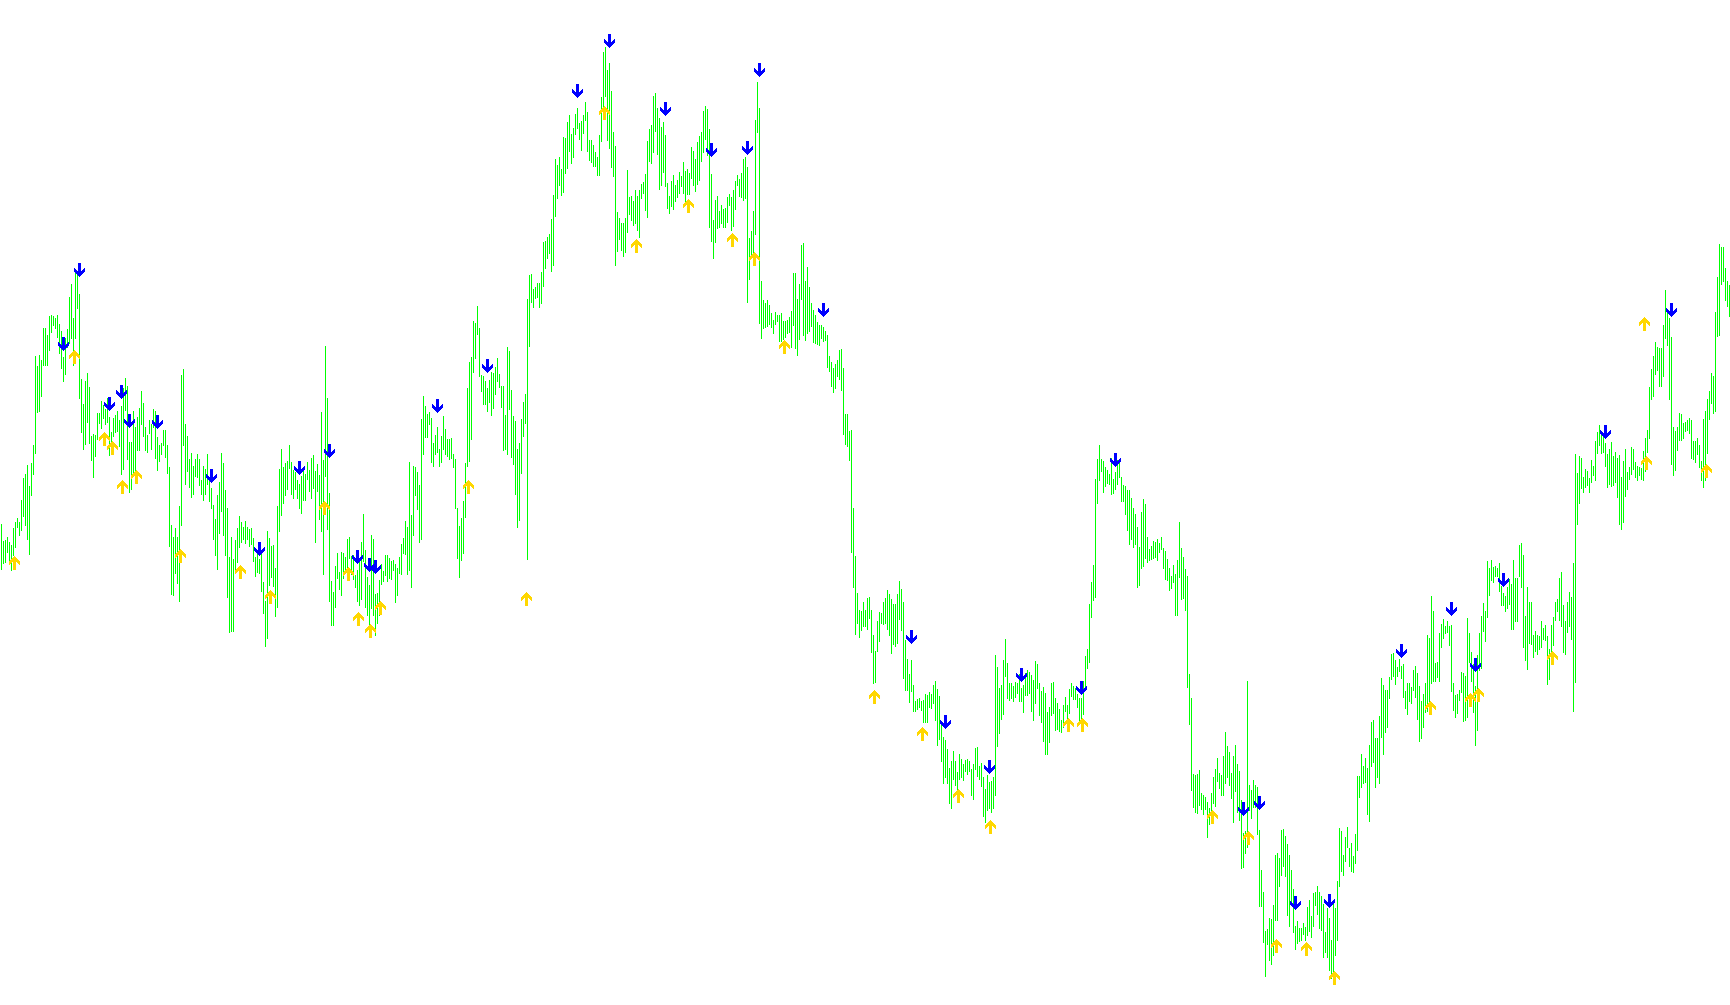
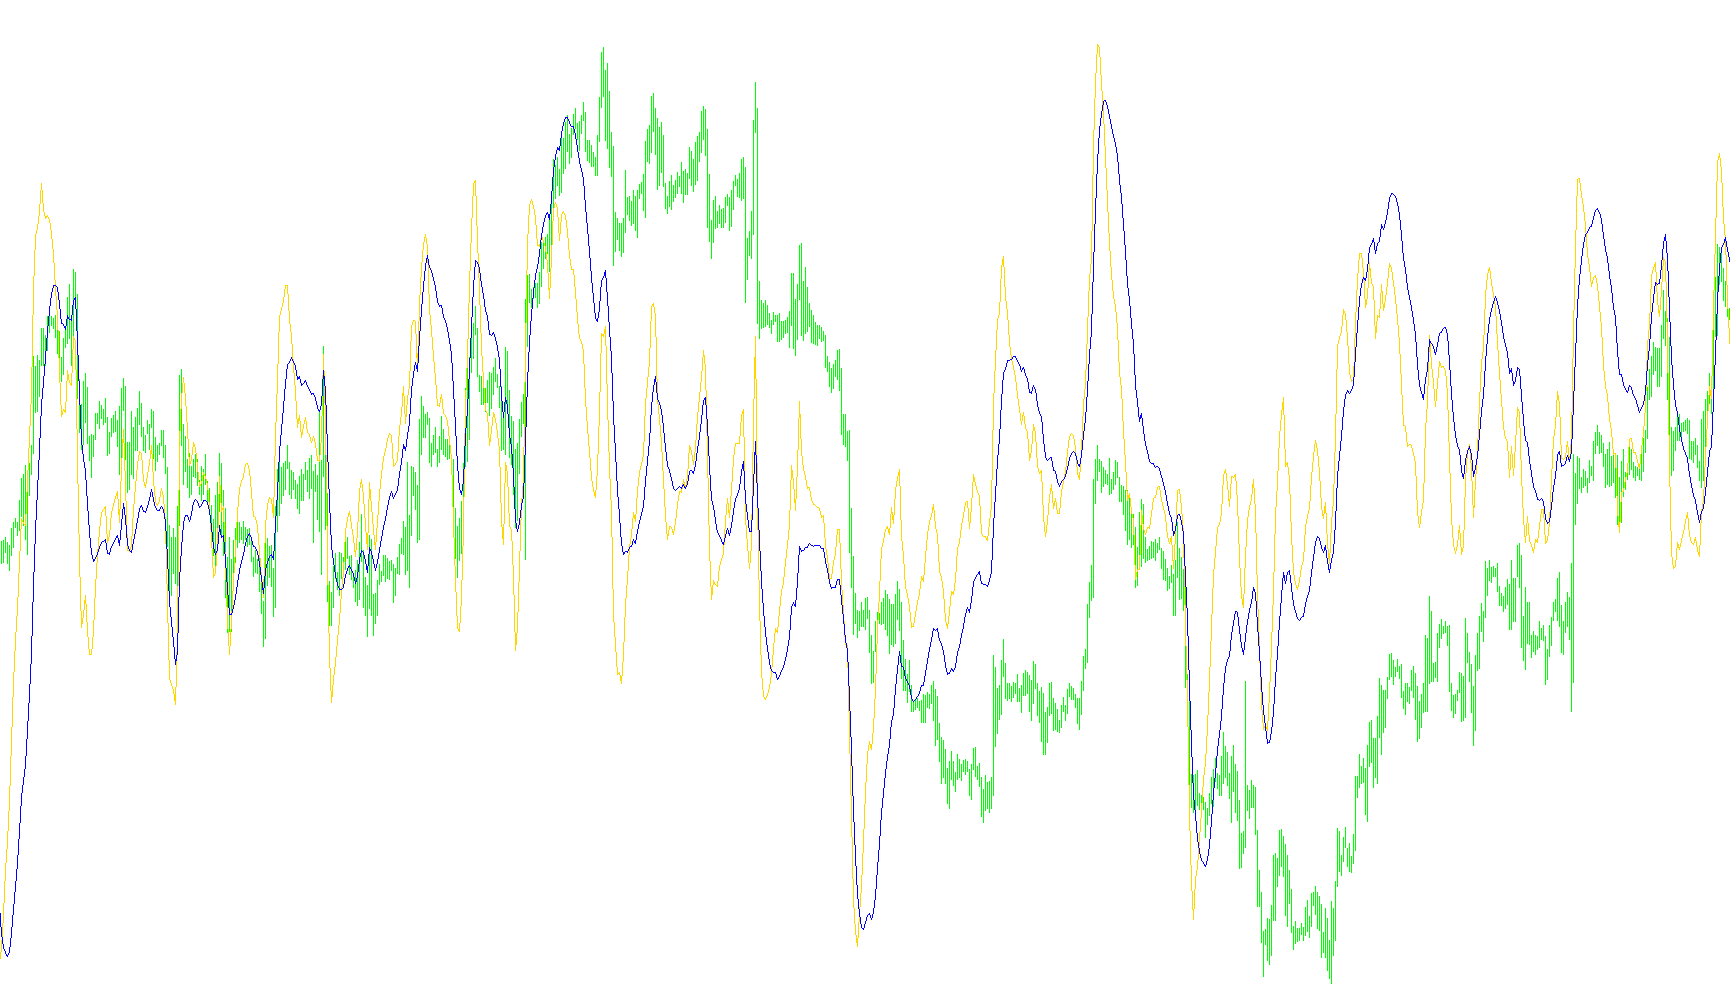
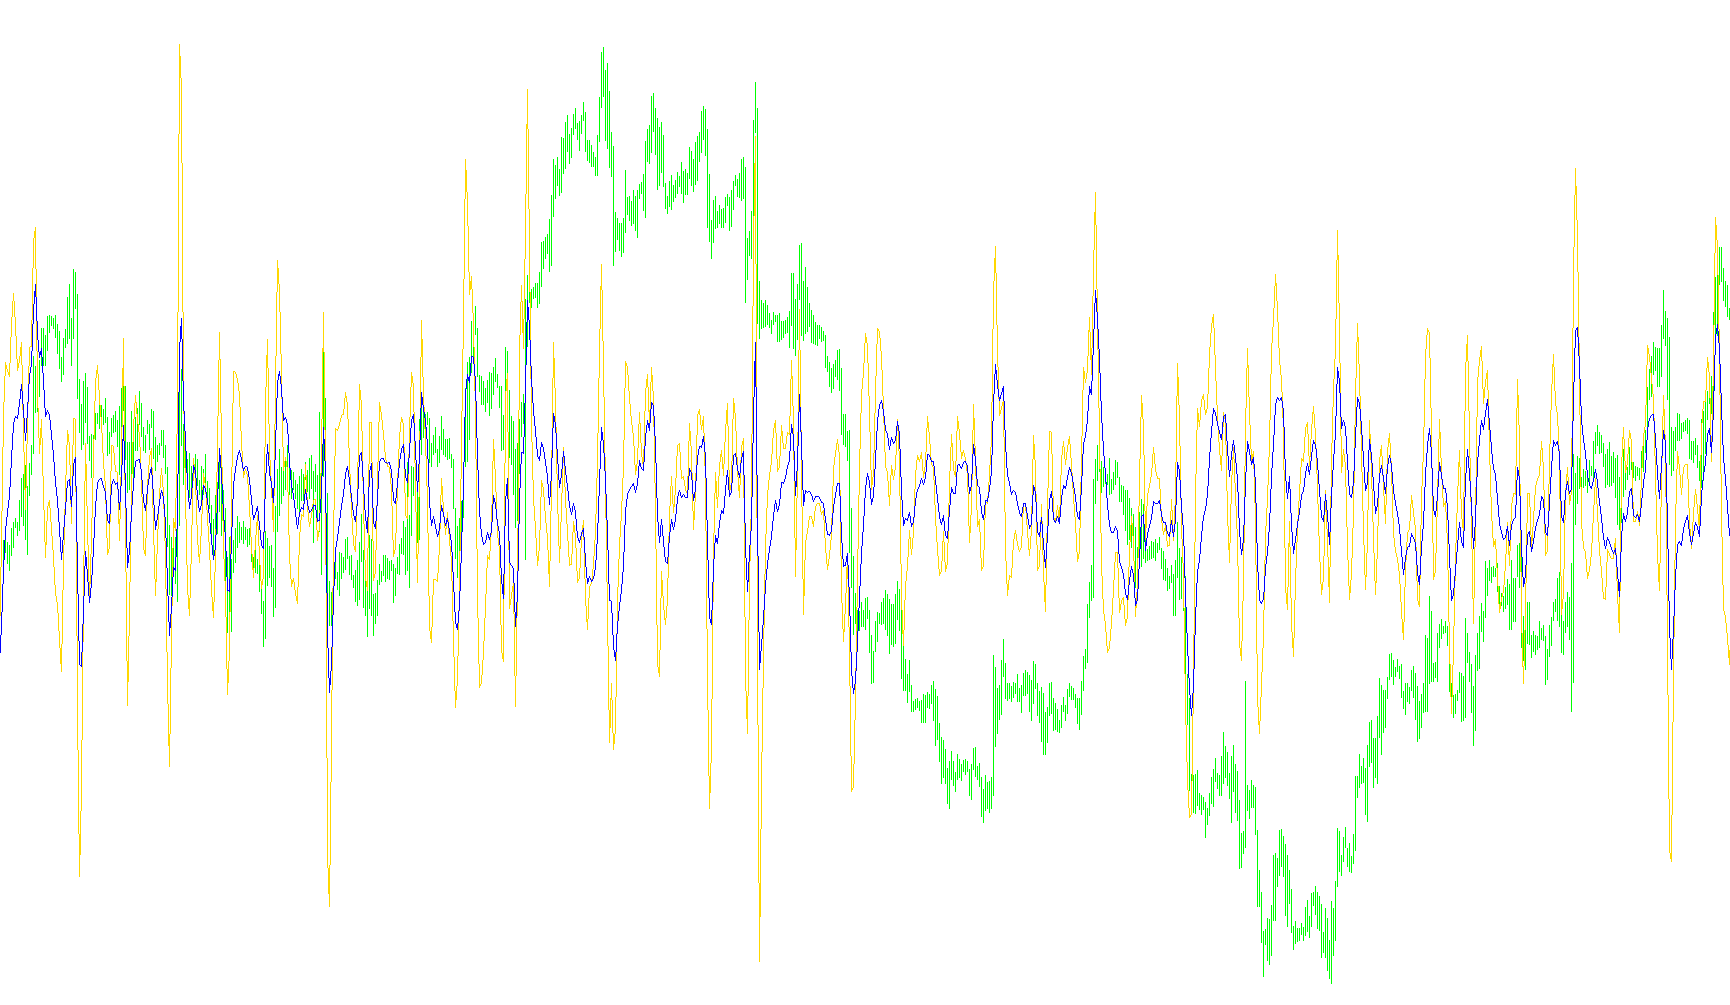
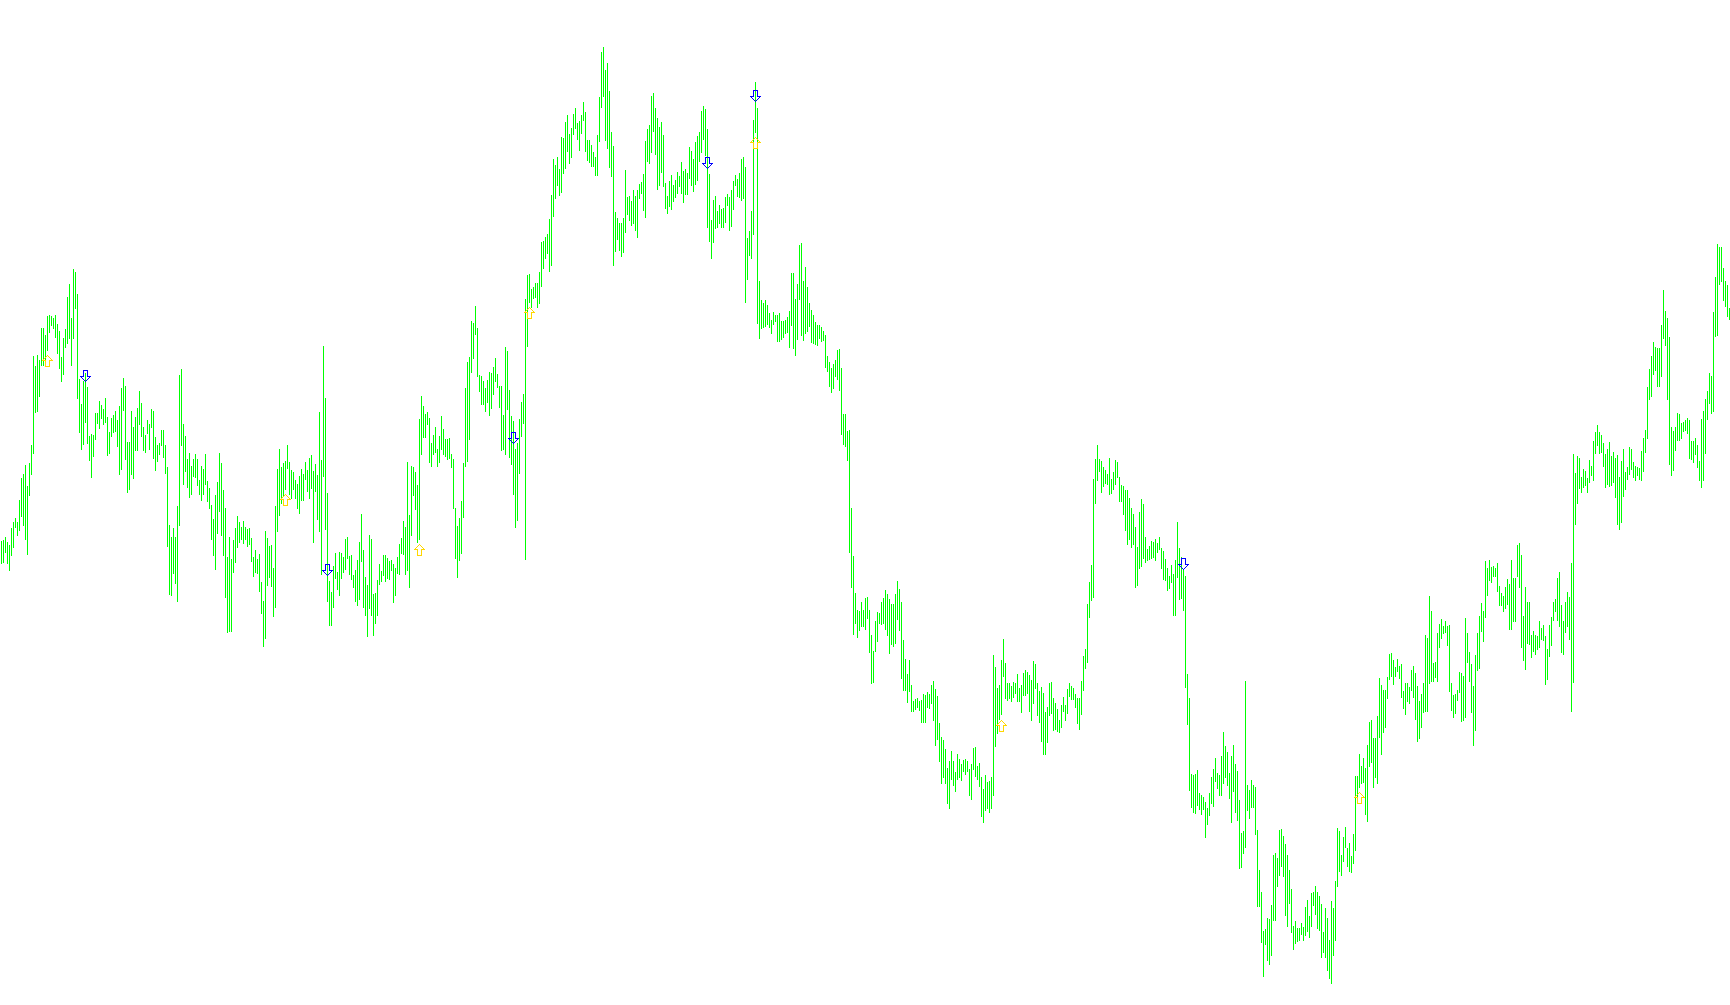
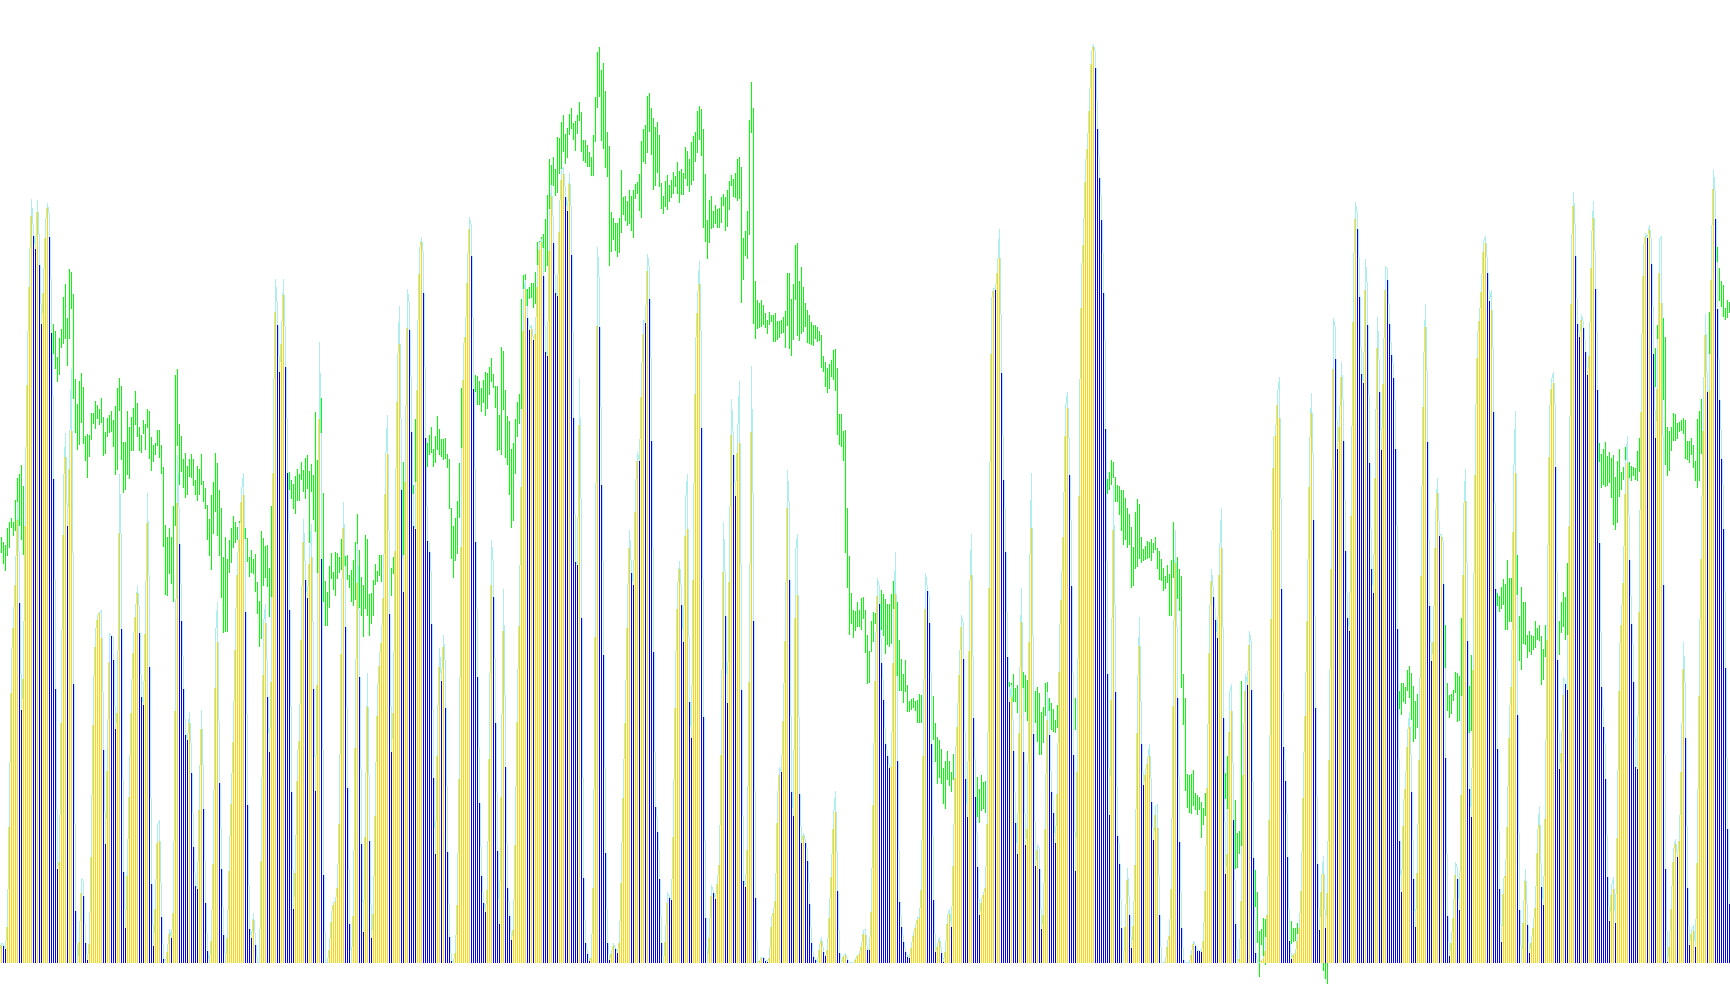
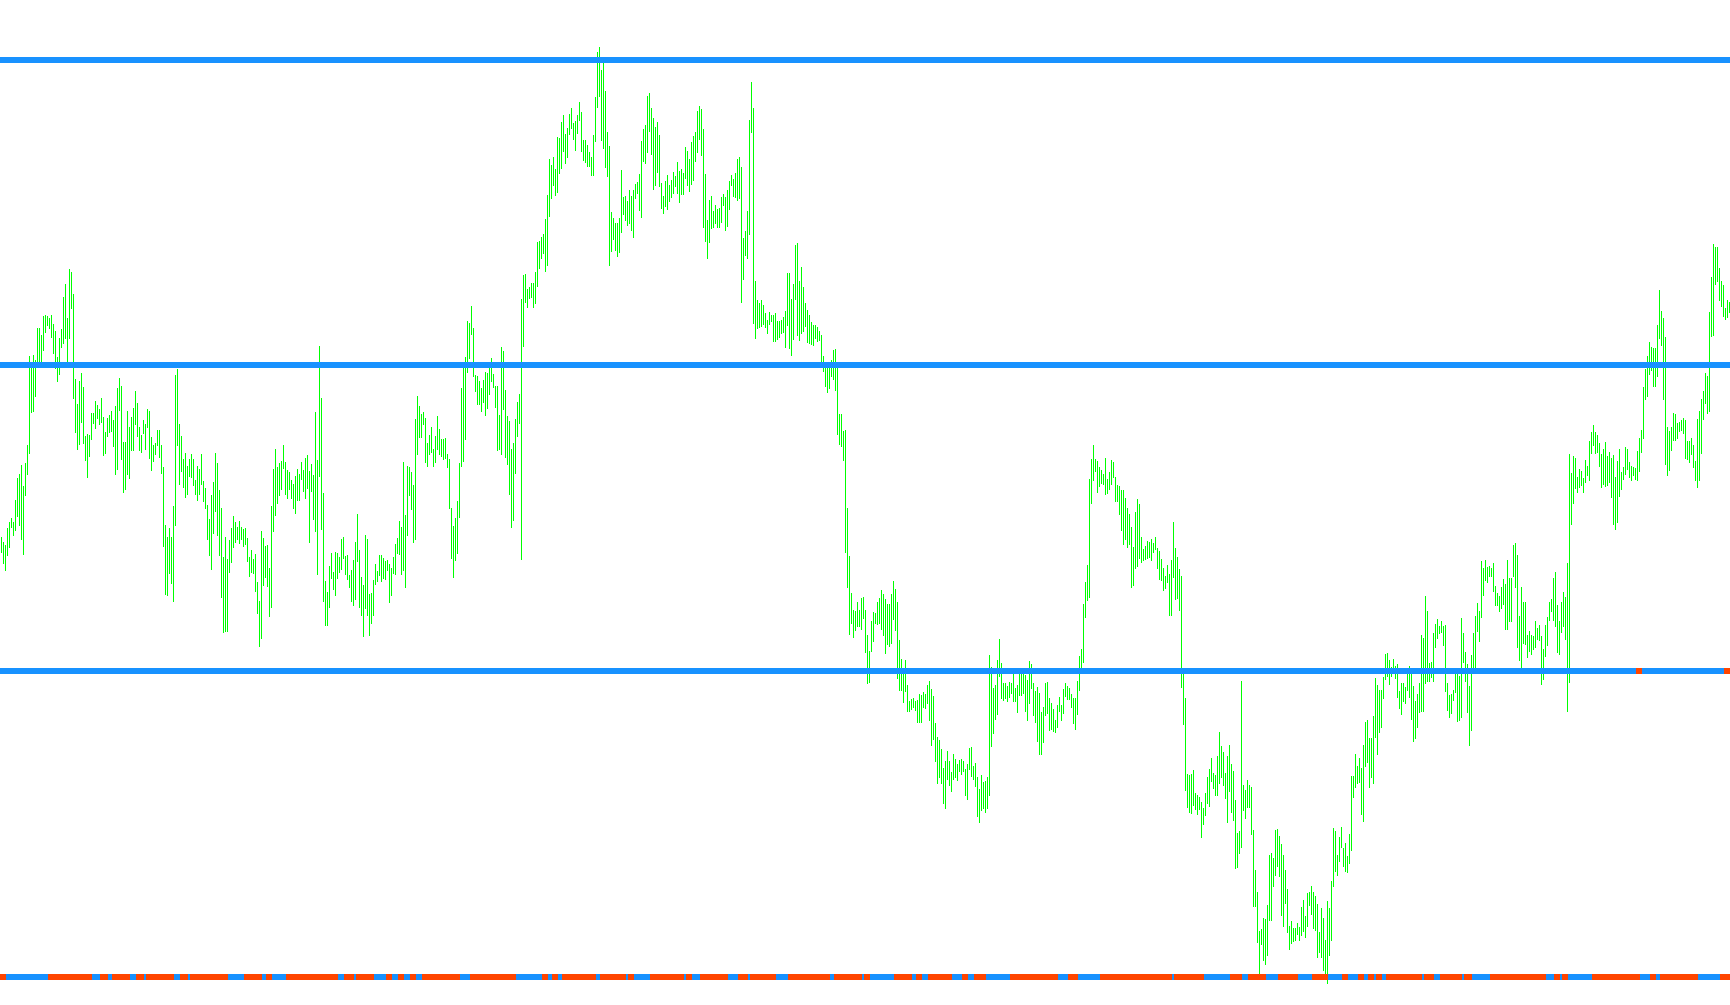
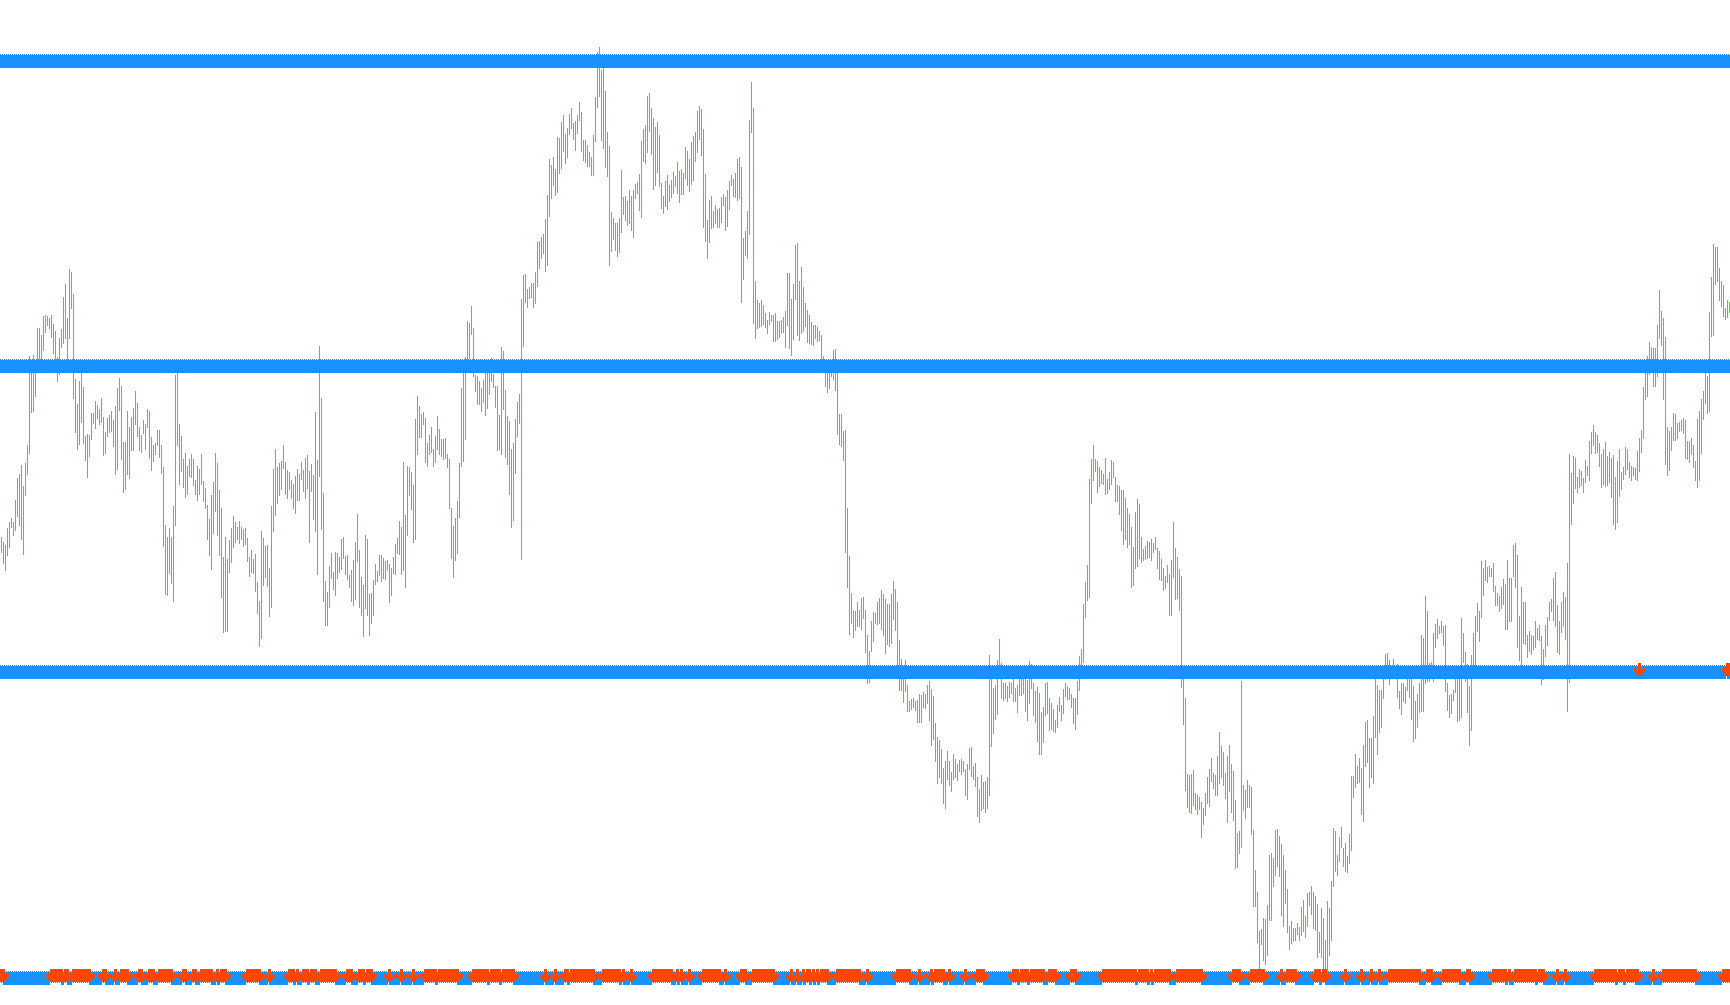
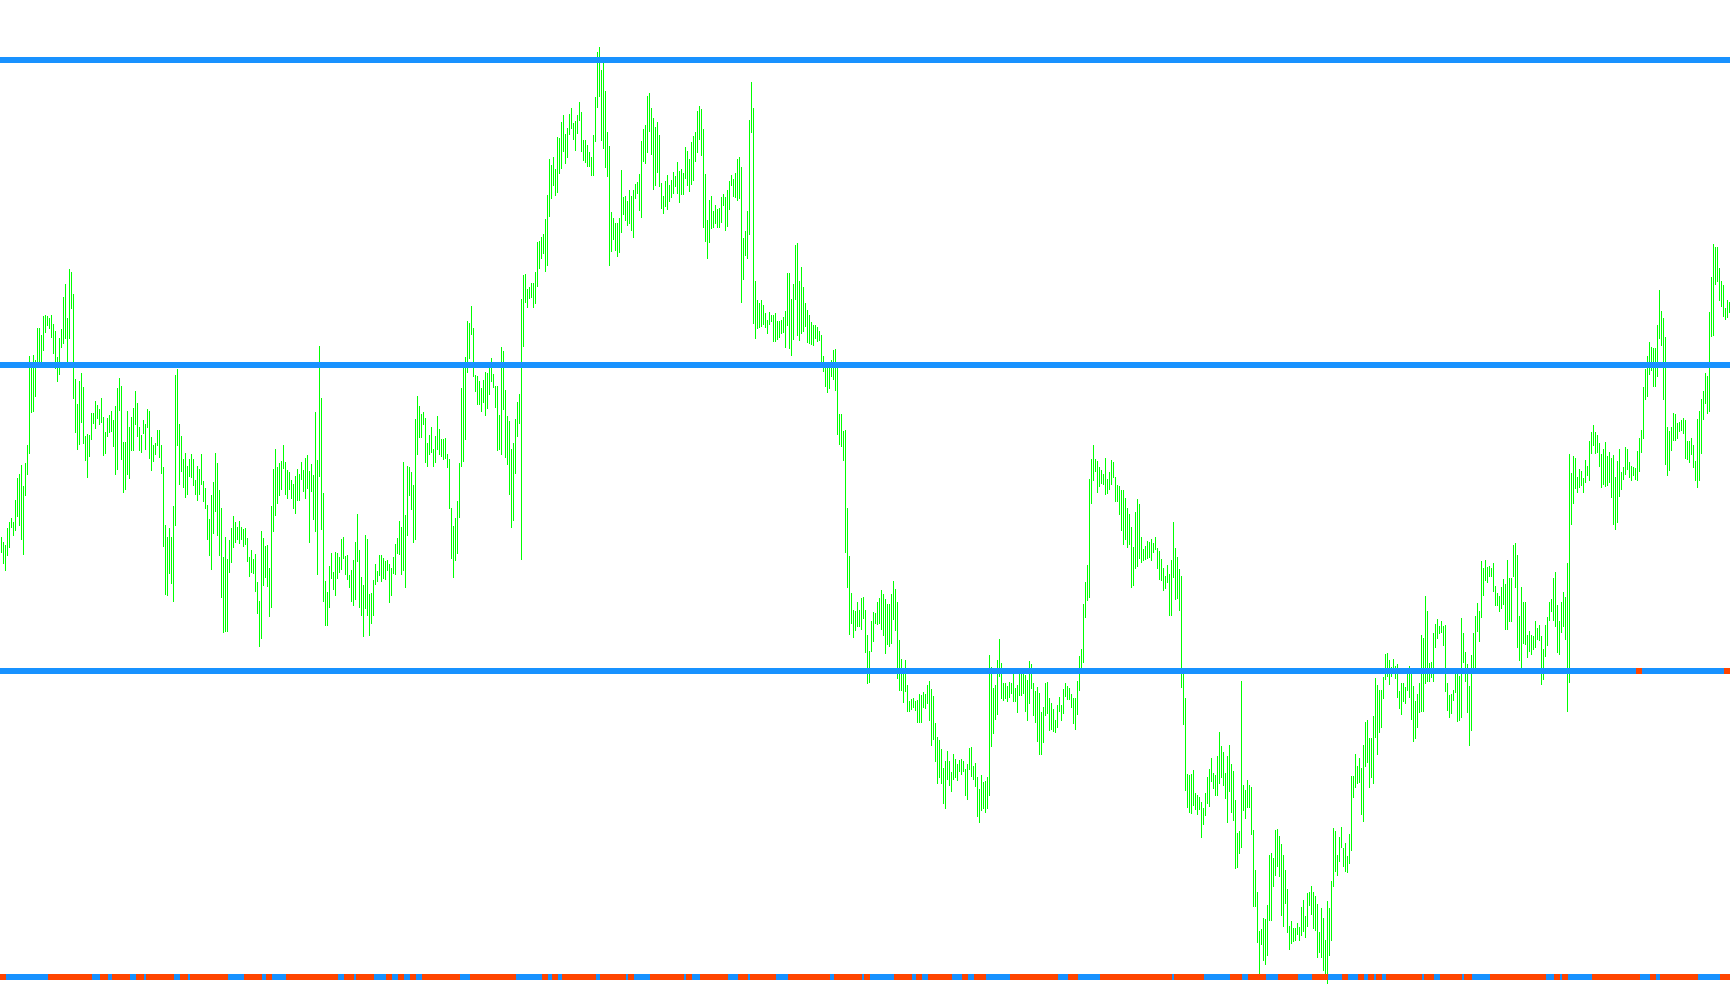
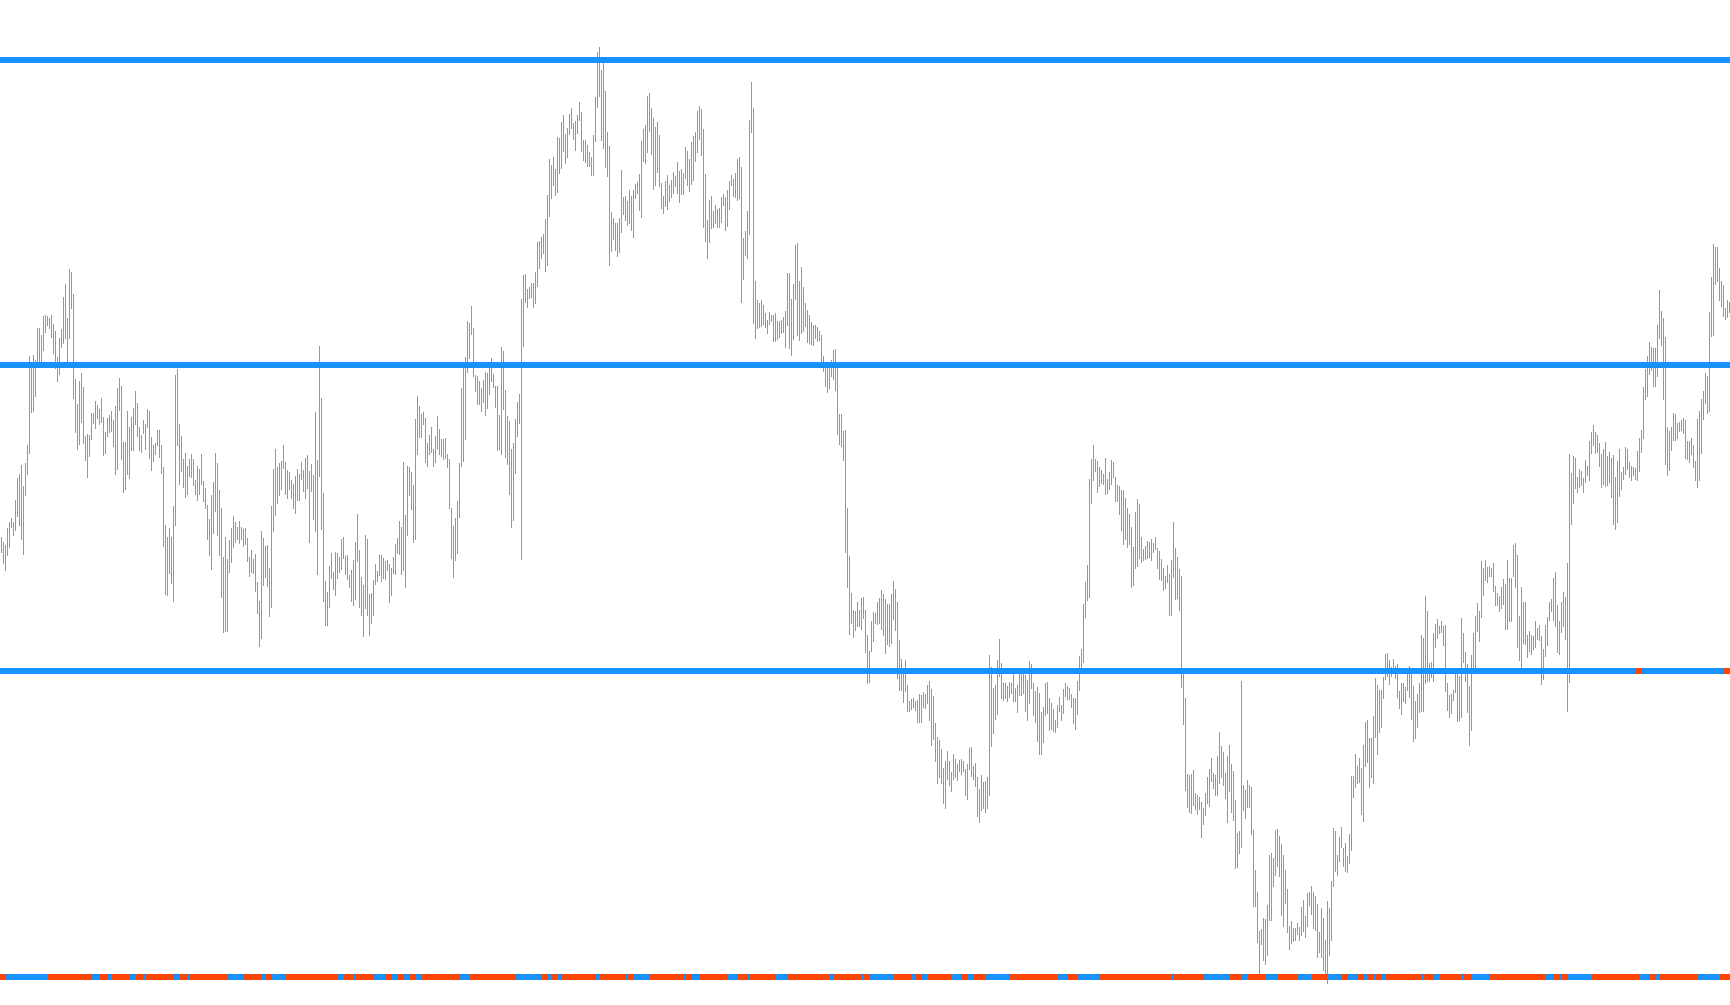
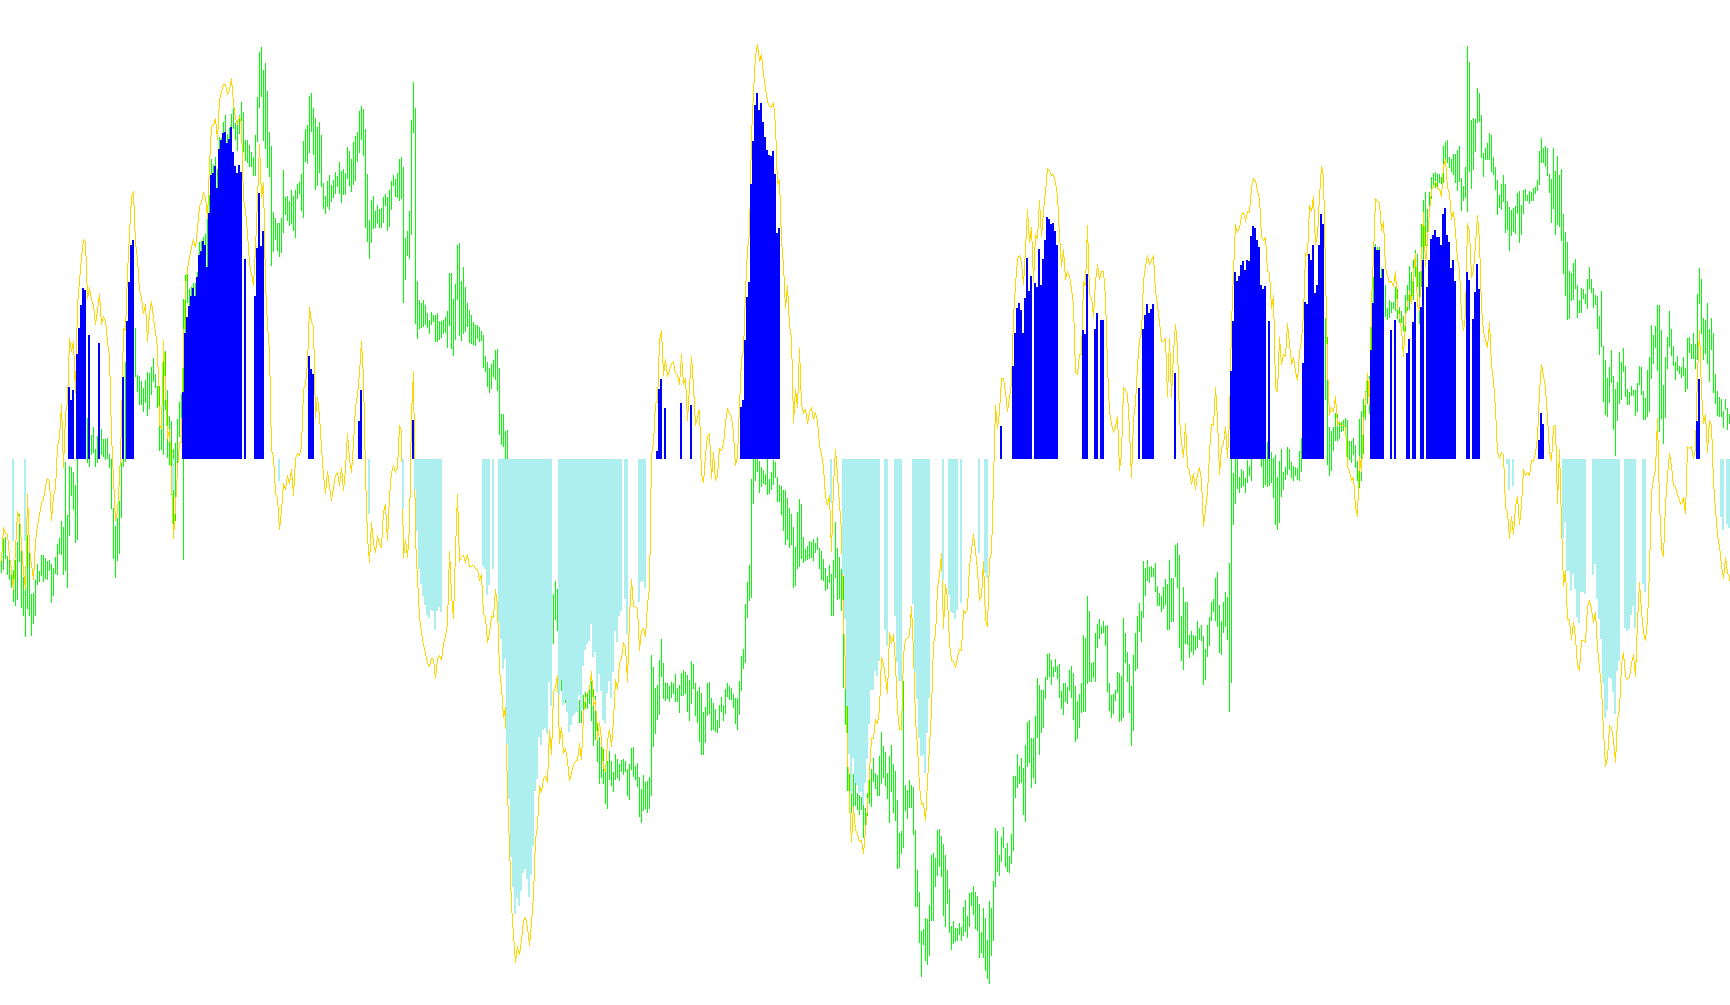
This indicator identifies dynamic support and resistance zones by correlating MACD signal crossovers with price extremes to map structural trend reversals.

Indicator

MACD# MTF

iMACD
MACD&STOCH ON CHART DIVERGENCE
Indicator

MACD&STOCH ON CHART DIVERGENCE

iMACDiStochastic

This indicator identifies structural price-momentum discrepancies by detecting bullish and bearish divergences between price action and both MACD and Stochastic oscillators.

MACD+MA
Indicator

MACD+MA

iMACDiMA

The indicator identifies bullish and bearish trend shifts by detecting simultaneous upward or downward price momentum across both a Moving Average and the MACD Main line.

MACD-4H+
Indicator

MACD-4H+

iMACD

This indicator projects the Moving Average Convergence Divergence values from a higher timeframe onto the current chart to facilitate trend alignment.
MACD-4H-v10
Indicator

MACD-4H-v10

iMACD

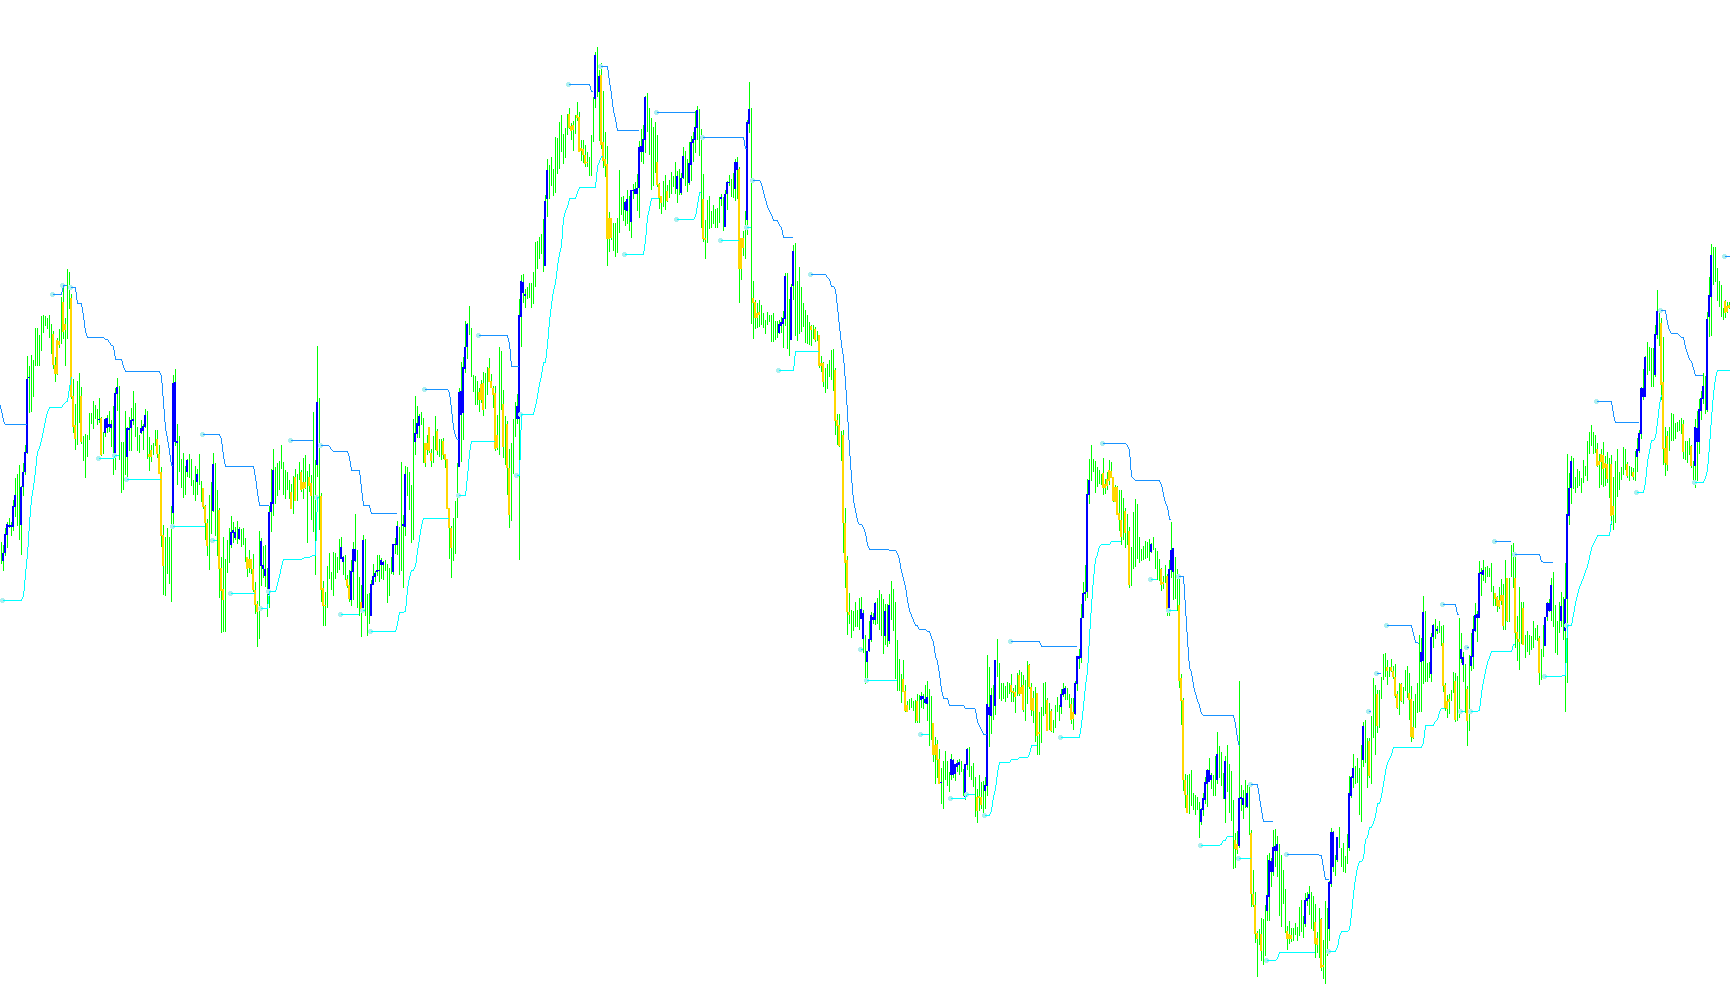
This indicator projects high-timeframe MACD momentum dynamics onto the current chart by synchronizing historical bar data from a larger period.

MACD-Crossover_Signal
Indicator

MACD-Crossover_Signal

iMACD

This indicator identifies bullish and bearish trend shifts by detecting specific intersection points between the MACD main line and its signal line, adjusted by historical volatility ranges.

MacdACSignals
Indicator

MacdACSignals

iACiMACD

This indicator identifies high-probability entry points by detecting simultaneous bullish or bearish trend shifts in the MACD oscillator combined with specific multi-bar sequential price action patterns from the Awesome Oscillator.

MACDBars
Indicator

MACDBars

iMACD

This indicator visualizes bullish and bearish zones by comparing the MACD main line against its signal line across customizable timeframes and price types.

Indicator

MACD_ MTF

iMACD
MACD_4H[1]
Indicator

MACD_4H[1]

iMACD

This indicator calculates and projects MACD values from a specific higher or lower timeframe onto the current chart using dynamic periodicity scaling.

MACD_4H_v05
Indicator

MACD_4H_v05

iMACD

This indicator calculates the Moving Average Convergence Divergence by projecting higher timeframe data onto lower timeframe charts using a period scaling factor.

Indicator

MACD_4in1_v2

iMACD
Indicator

MACD_4in1_v2_v1

iMACD
MACD_CCIobos_mtf
Indicator

MACD_CCIobos_mtf

iMACD

This indicator identifies potential entry points by synchronizing CCI overbought/oversold thresholds with upward or downward MACD momentum shifts across higher timeframes.

MACD_CCIobos_mtf_Alert_v1.01
Indicator

MACD_CCIobos_mtf_Alert_v1.01

iMACD

This indicator identifies bullish and bearish price action by synchronizing Commodity Channel Index overbought/oversold thresholds with positive or negative MACD slope shifts.

MACD_CCIobos_mtf_Alert_v1
Indicator

MACD_CCIobos_mtf_Alert_v1

iMACD

This indicator identifies potential reversal zones by detecting simultaneous overbought/oversold conditions in the Commodity Channel Index combined with momentum shifts in the Moving Average Convergence Divergence.

MACD_CCI_mtf
Indicator

MACD_CCI_mtf

iMACD

This indicator identifies bullish and bearish trend shifts by synchronizing positive/negative CCI thresholds with the directional slope of a multi-timeframe MACD.

MACD_CCI_mtf_Alert_v1.01
Indicator

MACD_CCI_mtf_Alert_v1.01

iMACD

This indicator identifies trend momentum by correlating the directional slope of the MACD with the positive or negative polarity of the Commodity Channel Index.

MACD_CCI_mtf_Alert_v1
Indicator

MACD_CCI_mtf_Alert_v1

iMACD

This indicator identifies directional trend shifts by validating positive MACD momentum with a positive CCI threshold for bullish signals, and negative MACD momentum with a negative CCI threshold for bearish reversals.

MACD_CCI_mtf_Alert_v1_001
Indicator

MACD_CCI_mtf_Alert_v1_001

iMACD

The indicator identifies directional momentum by correlating positive Commodity Channel Index values with rising MACD trends for bullish signals and negative CCI values with falling MACD trends for bearish signals.

Indicator

MACD_CJA M1D1

iMACD
Indicator

MACD_CJA M1D1_v1

iMACD
Indicator

MACD_Colored_v104_001

iMACDiMAiMAOnArray
MACD_Entry
Indicator

MACD_Entry

iMACD

This indicator identifies bullish and bearish momentum shifts by detecting positive main line crossovers with negative signals and vice versa across user-defined timeframes.

MACD_FlatMarketDetector
Indicator

MACD_FlatMarketDetector

iMACDiMAOnArray

Identifies market stagnation by calculating the derivative of MACD median values and filtering volatility through an exponential smoothing gamma threshold.

Indicator

MACD_OsMA_4ColorHM_2L_mtf

iMACDiOsMA
MACD_OsMA_Color
Indicator

MACD_OsMA_Color

iMACDiOsMA
Indicator

MACD_OsMA_M

iMACDiOsMA
MACD_Signals
Indicator

MACD_Signals

iMACDiMA

This indicator identifies trend reversals by normalizing MACD values against a moving average and filtering signals based on a minimum bar sequence to eliminate noise.

MACD_Signals_en
Indicator

MACD_Signals_en

iMACDiMA

This indicator filters MACD fluctuations by normalizing them against a moving average and identifying structural trend reversals based on minimum bar distance requirements.

Indicator

MACD_spirit

iMACDiOsMA
Macd_Support_and_Resistance
Indicator

Macd_Support_and_Resistance

iMACD

Identifies dynamic supply and demand levels by tracking extreme price rejection points triggered by MACD signal momentum shifts.

macd_x2MTF
Indicator

macd_x2MTF

iMACD

This indicator overlays two independent Moving Average Convergence Divergence calculations across varying timeframes to identify momentum shifts and trend crossovers.

macd_x2slopeMTF
Indicator

macd_x2slopeMTF

iMACD

This indicator calculates the rate of change between two distinct MACD settings to identify momentum acceleration by subtracting shifted historical values.

Indicator

MACD__MTF

iMACD
MAcross_Rsi_Sto_Macd_Fx10SetupTM
Indicator

MAcross_Rsi_Sto_Macd_Fx10SetupTM

iMACDiMAiRSIiStochastic

This indicator identifies trend reversal entries by synchronizing Moving Average crossovers with RSI strength thresholds, Stochastic oscillator positioning, and MACD signal line dynamics.

MadroGoldenFilter
Indicator

MadroGoldenFilter

iMACDiADXiMAiRSI
Indicator

master_info

iCCIiMACDiRSIiStochastic
MBA
Indicator

MBA

iMACDiMomentumiRSIiStochastic

This indicator derives a multi-factor signal by normalizing the sum of MACD and RSI against momentum, weighted by stochastic values, and then filters the resulting trajectory to highlight directional shifts.

MBA_Thesis_Indicator_ok
Indicator

MBA_Thesis_Indicator_ok

iMACDiMomentumiRSIiStochastic

This indicator calculates a multi-factor composite value by multiplying Stochastic values with the sum of MACD and RSI, normalized by Momentum, then applying a directional SMA smoothing filter.

MBA_Thesis_Indicator_ok_v1
Indicator

MBA_Thesis_Indicator_ok_v1

iMACDiMomentumiRSIiStochastic

The indicator calculates a composite oscillator by normalizing the sum of MACD and RSI values against Momentum, then applies a Moving Average to identify directional trend shifts.

MFCS 4TF MACD SLOPE #2
Indicator

MFCS 4TF MACD SLOPE #2

iMACD

This indicator visualizes the instantaneous direction of the MACD main line across four distinct timeframes simultaneously to identify concurrent trend momentum.

MFCS 4TF MACD SLOPE #2b
Indicator

MFCS 4TF MACD SLOPE #2b

iMACD

This indicator visualizes the directional momentum of MACD values across four distinct timeframes simultaneously, using arrow markers to identify bullish and bearish slope transitions.

MFCS 4TF MACD SLOPE #2_001
Indicator

MFCS 4TF MACD SLOPE #2_001

iMACD

This indicator visualizes the directional momentum of the MACD oscillator across four concurrent timeframes to identify synchronized trend slopes.

MFCS 4TF MACD SLOPE #2_002
Indicator

MFCS 4TF MACD SLOPE #2_002

iMACD

This indicator visualizes the directional trajectory of the MACD main line across four distinct temporal horizons simultaneously to identify multi-layered trend confluence.

MMR
Indicator

MMR

iMACDiMAiRSI

This indicator synthesizes EMA and LWMA crossover dynamics with MACD momentum and RSI strength to generate a consolidated trend volatility signal.

ModiSimple
Indicator

ModiSimple

iATRiMACDiMAiRSI

This indicator synthesizes RSI acceleration, MACD trend dynamics, and multi-mode ATR-based trailing stops to identify high-probability trend reversals and automated risk management.

MTF MACD
Indicator

MTF MACD

iMACD

This indicator calculates the Moving Average Convergence Divergence based on user-defined higher temporalities and custom price types to identify overarching momentum shifts.

MTF Waddah_Attar_Explosion
Indicator

MTF Waddah_Attar_Explosion

iBandsiMACD

The indicator identifies high-velocity trend shifts by calculating the relative power of MACD momentum and Bollinger Band expansion against a predefined volatility dead zone.