FerruFx_Multi_info__
Indicator

FerruFx_Multi_info__

iCCIiMACDiADXiMA
FerruFx_Trend+
Indicator

FerruFx_Trend+

iCCIiMACDiADXiMA

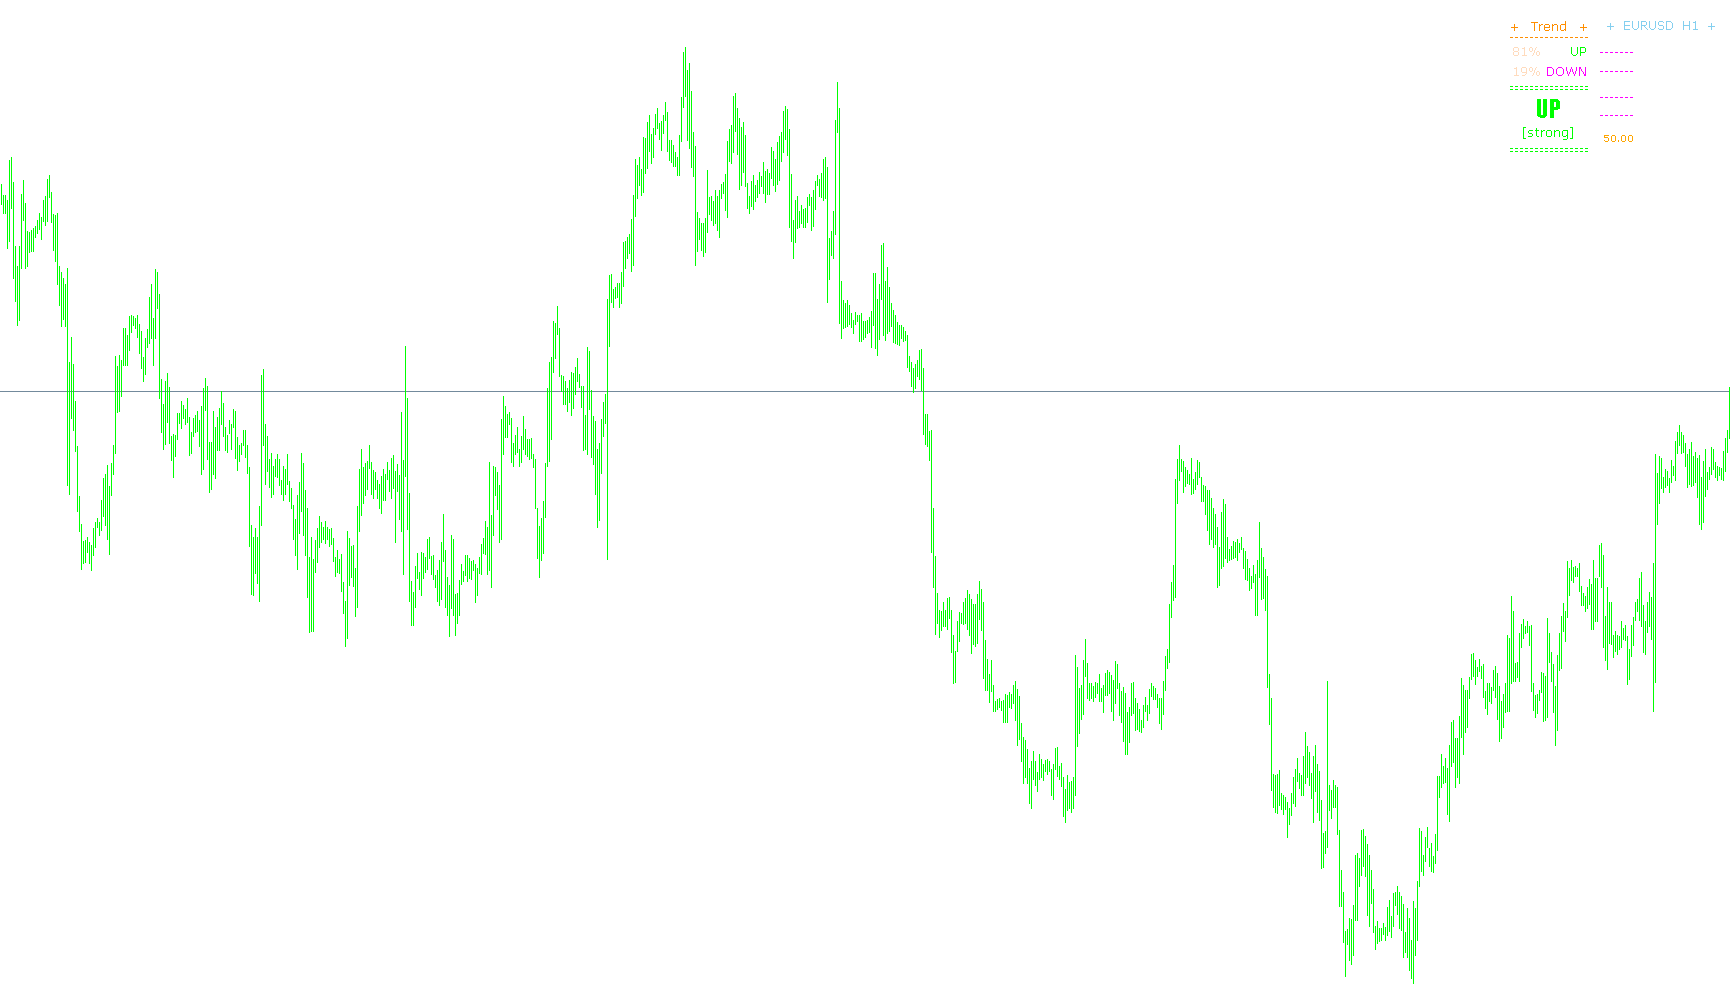
This indicator aggregates directional bias from multiple timeframes by synthesizing Moving Averages, CCI, ADX, and Bulls/Bears Power into a weighted cumulative trend score.

fibopivotcandlebar
Indicator

fibopivotcandlebar

iMACDiMAiMAOnArray

A multi-layered technical analysis tool that merges Fibonacci retracements, Pivot Point levels, ZigZag structure, and MACD trend momentum to generate high-probability directional signals.

FLATTRAND_w_MACD_mtf
Indicator

FLATTRAND_w_MACD_mtf

iMACD

This indicator highlights periods of potential flat or ranging markets by analyzing MACD signal line crossovers and main MACD values against zero on a specified timeframe, indicating consolidation when neither bullish nor bearish signals are present.

FlatTrend Alert
Indicator

FlatTrend Alert

iMACD

This indicator identifies trend exhaustion and consolidation zones by detecting specific crossovers between the MACD main and signal lines relative to their zero-axis positioning.

FlatTrend w MACD
Indicator

FlatTrend w MACD

iMACD

This indicator identifies directional momentum shifts by detecting bullish and bearish crossovers relative to the zero line, while highlighting periods of price consolidation.

FlatTrend w MACD_v1
Indicator

FlatTrend w MACD_v1

iMACD

This indicator identifies bullish momentum, bearish exhaustion, and market neutrality by evaluating the relationship between MACD main and signal lines across specific timeframes.

FlatTrend w MACD_v2
Indicator

FlatTrend w MACD_v2

iMACD

This indicator identifies high-probability momentum shifts by monitoring specific crossover conditions between the MACD Main and Signal lines across multi-timeframe periods.

FLATTR~2 (2)
Indicator

FLATTR~2 (2)

iMACD

This indicator visualizes market equilibrium by identifying periods where the MACD main line remains inactive, contrasted against bullish and bearish momentum shifts.

forexline_update_03
Indicator

forexline_update_03

iMACDiMAiMAOnArray

This indicator synthesizes nested Linear Weighted Moving Averages with MACD momentum filtering and price action confirmation to identify high-probability trend reversals and continuation signals.

Fruity Pebbles 1.1
Indicator

Fruity Pebbles 1.1

iMACDiMA

This indicator identifies trend reversals by detecting specific momentum crossovers in the MACD differential while confirming price action alignment with Exponential Moving Average dynamics.

Fruity Pebbles 1.1_v1
Indicator

Fruity Pebbles 1.1_v1

iMACDiMA

This indicator identifies potential reversal points by detecting momentum shifts in the MACD histogram relative to exponential moving average trend persistence.

Indicator

FX Multi-Meter II

iMACDiMAiSARiStochastic
Indicator

FX Multi-Meter

iMACDiMAiSARiStochastic
FX Sniper's MACD Lines
Indicator

FX Sniper's MACD Lines

iMACD

This indicator calculates the absolute differential between the MACD main line and its signal line to quantify momentum velocity.

Fx10Setup
Indicator

Fx10Setup

iMACDiMAiRSIiStochastic

This indicator identifies high-probability trend entries by requiring simultaneous alignment between moving average crossovers, RSI strength thresholds, Stochastic oscillator momentum, and MACD signal positioning.

Fx10Setup_RSI_Sto_Macd
Indicator

Fx10Setup_RSI_Sto_Macd

iMACDiMAiRSIiStochastic

This indicator identifies high-probability reversal points by synchronizing moving average crossovers with RSI threshold breaches, Stochastic momentum alignment, and MACD signal positioning.

Fx10Setup_v1
Indicator

Fx10Setup_v1

iMACDiMAiRSIiStochastic

This indicator identifies high-probability trend reversals by synchronizing LWMA/SMA crossovers with specific RSI thresholds, Stochastic signal positioning, and MACD main-to-signal alignment.
Fx10Setup_v2
Indicator

Fx10Setup_v2

iMACDiMAiRSIiStochastic

This indicator identifies high-probability reversal or continuation points by synchronizing Moving Average crossovers with RSI thresholds, Stochastic oscillator momentum, and MACD signal line positioning.
FX5_MACD_Divergence_V1.0
Indicator

FX5_MACD_Divergence_V1.0

iMACD

This indicator identifies classical and hidden bullish or bearish divergences by comparing momentum shifts in the MACD histogram against price action extremes, visualizing structural trend reversals with automated geometric trendlines.

FX5_MACD_Divergence_V1.1
Indicator

FX5_MACD_Divergence_V1.1

iMACD

This tool identifies classical and hidden bullish/bearish divergences by comparing price extremes against MACD peak fluctuations and projects automated trendlines for visual confirmation.

FX5_MACD_MetaTrader
Indicator

FX5_MACD_MetaTrader

iMACDiMA

This indicator identifies classic and hidden bullish/bearish divergences by comparing price momentum shifts against MACD OsMA peak and trough oscillations.

FXRaiderTable_enM
Indicator

FXRaiderTable_enM

iMACDiMA

This indicator synthesizes moving averages, MACD oscillators, and Parabolic SAR across weekly, daily, and hourly intervals to provide a visual matrix of directional momentum alignment for multiple currency pairs simultaneously.

Indicator

G#MACD

iMACD
Indicator

G#MACD_Bars

iMACD
GMACD
Indicator

GMACD

iMACD

This indicator synchronizes MACD signals across multiple timeframes to visualize trend strength, identify sideways consolidation, and detect directional alignment between micro and macro scales.

Indicator

GMACD2

iMACD
Indicator

Gmacd2_v1

iMACD
GMACD_Signals
Indicator

GMACD_Signals

iMACD

This indicator harmonizes MACD velocity across diverse temporal horizons to categorize market regimes into precise strength levels and directional biases.

GMACD_Signals_v1
Indicator

GMACD_Signals_v1

iMACD

This indicator aggregates MACD signal data across multiple timeframes to categorize market conditions into directional trends, consolidation zones, and structural strength levels.

GMACD_Signals_v2
Indicator

GMACD_Signals_v2

iMACD

This indicator synthesizes MACD data across multiple timeframes to identify concurrent trend alignment, structural strength, and potential price corrections.

Indicator

G_MACD_M1

iMACD
harami_ma_rsi_macd
Indicator

harami_ma_rsi_macd

iATRiMACDiMAiRSI

This indicator identifies potential trend reversals by detecting Harami candlestick patterns validated through concurrent Moving Average, RSI momentum, and MACD trend filters.

i-DivMACD
Indicator

i-DivMACD

iMACD

This indicator identifies structural price discrepancies by comparing the slope of MACD momentum peaks against corresponding price action extrema.

i-Example-Add
Indicator

i-Example-Add

iMACD

This indicator identifies entry and exit points by synthesizing MACD crossover mechanics, trend exhaustion reversals, and price-momentum divergence detection.

impuls
Indicator

impuls

iMACDiMA

This indicator synchronizes the rate of change from Exponential Moving Averages and MACD momentum to visualize bullish, bearish, and neutral market impulses.

impulsmodify
Indicator

impulsmodify

iMACDiMA

This indicator synchronizes the velocity of Exponential Moving Averages and MACD main lines to visualize multi-layered trend momentum through a three-color histogram.

indi2csv
Indicator

indi2csv

iCCIiATRiMACDiRSI

Synchronizes historical price action and multiple technical oscillators into a structured CSV format for external quantitative analysis.

indicatorarrows
Indicator

indicatorarrows

iMACDiOsMAiMAiStochastic
Indicator_Strength
Indicator

Indicator_Strength

iMACDiMAiStochastic

This indicator quantifies price velocity by calculating and visualizing the variance between primary moving average, MACD, or Stochastic components in a dual-polarized histogram.

Information
Indicator

Information

iCCIiMACDiRSIiStochastic

This indicator aggregates synchronized momentum, trend, and volatility data across multiple timeframes into a single visual dashboard to identify high-probability trade bias.

Information_5_deci
Indicator

Information_5_deci

iCCIiMACDiRSIiStochastic

This indicator synchronizes MACD, RSI, Stochastic, CCI, and EMA metrics across multiple timeframes to provide a unified visual heatmap of trend direction and price volatility.

Information_5_deci_MTF
Indicator

Information_5_deci_MTF

iCCIiMACDiRSIiStochastic

This indicator aggregates real-time MACD, RSI, Stochastic, CCI, and EMA signals across nine distinct timeframes to provide a synchronized visual overview of trend momentum and market volatility.

JJN-Infobar
Indicator

JJN-Infobar

iMACDiADXiRSIiStochastic

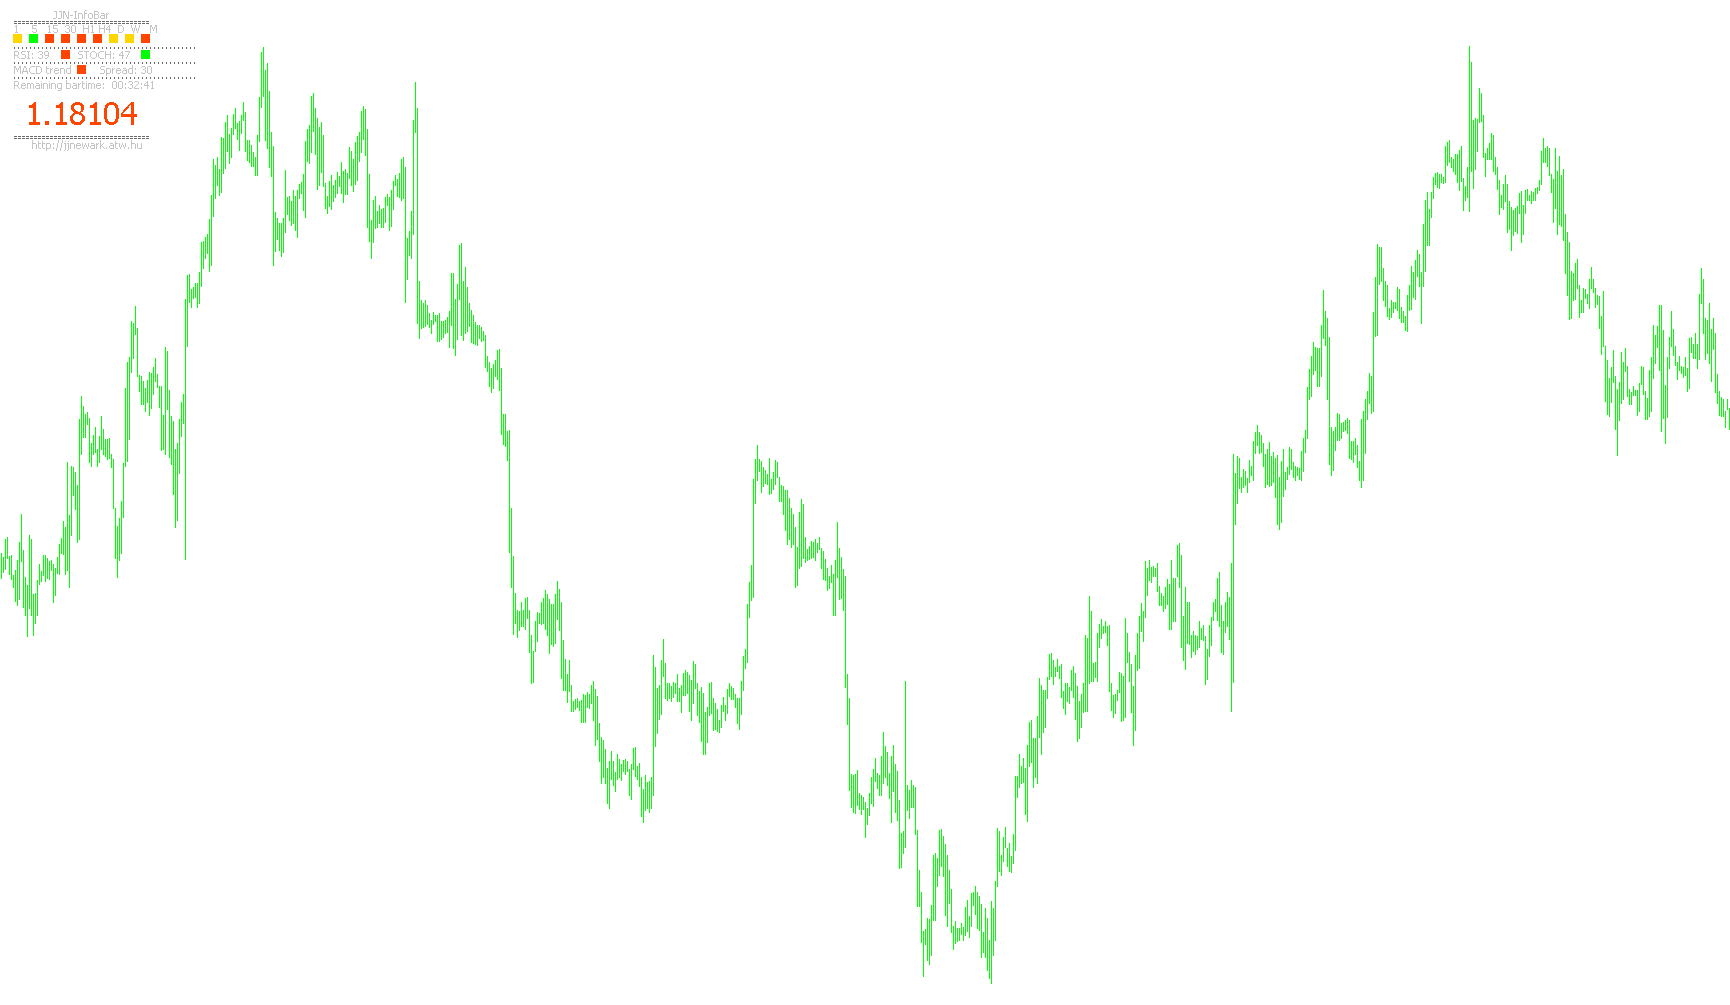
This indicator displays a customizable information panel showing trend direction across multiple timeframes based on ADX and PSAR, along with current RSI, Stochastic, MACD values, spread, remaining bar time, and price.

km-trend_movers
Indicator

km-trend_movers

iATRiMACDiRSIiStochastic

This indicator synthesizes RSI, ATR, Stochastic, MACD, and CCI metrics alongside dual Moving Average crossovers to provide real-time directional strength classifications.

LOCSignal-MACDDoublePike
Indicator

LOCSignal-MACDDoublePike

iMACD

This indicator identifies high-probability trend reversals by detecting specific multi-bar momentum shifts and 'pike' formations within the MACD main line relative to its signal history.

Indicator

MACD ASCTrend1sig Audible

iWPRiMACD
Indicator

MACD ASCTrend1sig Audible_v1

iWPRiMACD
MACD Cross
Indicator

MACD Cross

iMACD

This indicator identifies and visually marks precise bullish and bearish trend reversals by detecting the intersection of the MACD main line and signal line using price volatility-adjusted offsets.

MACD Crossover Arrows & Alert
Indicator

MACD Crossover Arrows & Alert

iMACD

This indicator identifies momentum shifts by detecting specific bullish and bearish crossovers between the MACD main line and signal line, projecting visual markers and multi-channel notifications on new candles.