MTF Waddah_Attar_Explosion
Indicator

MTF Waddah_Attar_Explosion

iBandsiMACD

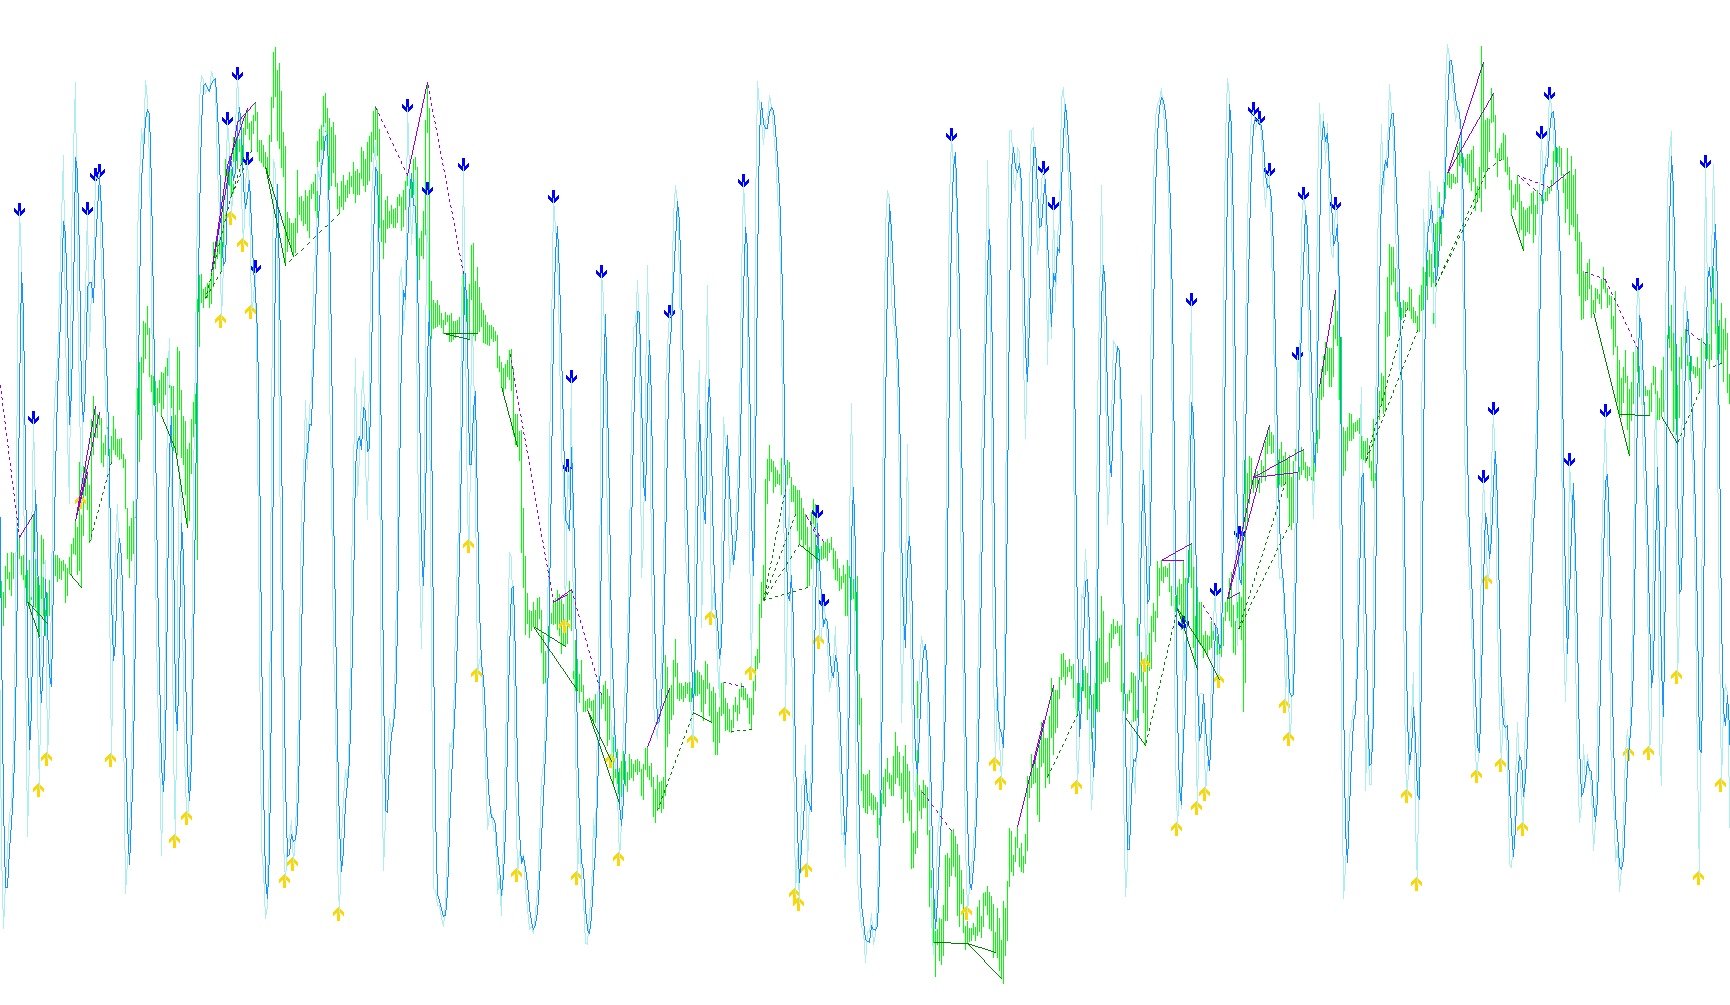
Identifies high-velocity trend shifts by calculating the relative acceleration of MACD momentum against Bollinger Band volatility expansions.

MTFPI-sub2
Indicator

MTFPI-sub2

iMACD

This indicator calculates the rate of change between consecutive MACD main line values to isolate immediate acceleration in price velocity.

Indicator

MTF_MACD_4x1v3M

iMACD
MTF_MACD_Bars
Indicator

MTF_MACD_Bars

iMACD

This indicator visualizes bullish and bearish momentum shifts by comparing the MACD Main line against its Signal line across various synchronized timeframes.

MTF_MACD_Bars_v1
Indicator

MTF_MACD_Bars_v1

iMACD

This indicator visualizes bullish and bearish momentum signals by analyzing the positional relationship between MACD Main and Signal lines across higher timeframes relative to the zero equilibrium.

Indicator

MTF_MACD_inColor

iMACD
Indicator

MTF_MACD_inColor_001

iMACD
Indicator

MTF_MACD_inColor_002

iMACD

This indicator calculates and displays a multi-timeframe MACD, highlighting bullish and bearish divergences through a two-color histogram representation in a separate window.

Indicator

MTF_MACD_inColor_Alert

iMACD
Indicator

MTF_MACD_inColor_v1

iMACD
MTF_MACD_sBar_4Cm
Indicator

MTF_MACD_sBar_4Cm

iMACD

This indicator identifies bullish and bearish momentum by mapping high-level MACD main line positions against signal line crossovers from a secondary timeframe onto the current chart.

MTF_Waddah_Attar_ExplosionSA
Indicator

MTF_Waddah_Attar_ExplosionSA

iBandsiMACD

This indicator detects high-velocity trend shifts by analyzing the velocity of MACD derivatives against Bollinger Band expansion rates across multiple timeframes.

MTF_Waddah_Attar_ExplosionSA_003
Indicator

MTF_Waddah_Attar_ExplosionSA_003

iBandsiMACD

This indicator identifies high-momentum entry points by synchronizing MACD velocity shifts with Bollinger Band expansion thresholds across multiple timeframes.

Indicator

MTMACDmainaboveSignal

iMACD
Multipaires indicator_V2
Indicator

Multipaires indicator_V2

iBullsPoweriCCIiOBViRSI
my_squeeze
Indicator

my_squeeze

iCCIiMACDiRSIiStochastic

This indicator identifies market compression by comparing standard deviation against ATR to signal high-probability trend expansions validated by selectable momentum oscillators.

my_squeeze_Light
Indicator

my_squeeze_Light

iCCIiMACDiRSIiStochastic

This indicator identifies high-probability trend expansions by detecting price volatility compression through a Bollinger Squeeze model and validating directional momentum using selectable oscillators like MACD, RSI, or CCI.

my_squeeze_Light_001
Indicator

my_squeeze_Light_001

iCCIiMACDiRSIiStochastic

This indicator identifies high-probability breakout points by detecting periods where volatility contracts below the Keltner Channel and then confirms trend expansion via selectable oscillators like MACD, RSI, or Stochastic.

my_squeeze_Light_v2
Indicator

my_squeeze_Light_v2

iCCIiMACDiRSIiStochastic

This indicator identifies high-probability breakout points by detecting price compression through a modified Bollinger Band squeeze calculation combined with selectable momentum oscillators.

Indicator

NeuroTrend_Indicator

iWPRiMAiRSIiStochastic
oscillator_of_indicator_and_ma
Indicator

oscillator_of_indicator_and_ma

iCCIiMACDiRVIiRSI

This tool synthesizes primary data from various technical oscillators—including MACD, RSI, CCI, RVI, and DeMarker—to calculate a unified momentum difference between the main indicator and its signal line.

Indicator

OsMACD

iMACDiOsMA
Indicator

OsMA_Lc

iMACDiOsMA
Planet
Indicator

Planet

iMACDiMAiRSIiStochastic

This indicator identifies high-probability trend shifts by synchronizing H4 momentum filters—specifically EMA crossovers, RSI levels, and Stochastic trends—with real-time price action triggers.

Price range information
Indicator

Price range information

iCCIiMACDiRSIiStochastic

This indicator aggregates real-time data from multiple timeframes to provide a visual dashboard of MACD, RSI, Stochastic, CCI, and EMA trends simultaneously.

Indicator

ProbMeter_v1.1

iCCIiMACDiADXiMA
profitsignalalert~
Indicator

profitsignalalert~

iBandsiMACD

This indicator identifies high-velocity market entries by correlating accelerated MACD rate changes against Bollinger Band expansion and minimum price volatility thresholds.

Real_Time_MultiIndicator_v1
Indicator

Real_Time_MultiIndicator_v1

iMACDiADXiMAiSAR

This indicator aggregates signal data from Parabolic SAR, MACD, Moving Average crossovers, and ADX across multiple timeframes into a synchronized visual dashboard.

Indicator

SARMACD

iMACDiSAR
SARMACD_v2
Indicator

SARMACD_v2

iMACDiSAR

This logic identifies high-probability reversal points by synchronizing the polarity shifts of the MACD histogram with Parabolic SAR trend deviations.

Schaff-RSI
Indicator

Schaff-RSI

iMACD

A hybrid technical indicator that calculates relative strength by applying RSI smoothing to price change differentials, selectable between raw price action, MACD derivatives, and Fibonacci Arithmogram-based volatility.

Sem MACD+CCI
Indicator

Sem MACD+CCI

iCCIiMACD

The indicator evaluates the confluence between MACD trend momentum and CCI overbought/oversold extremes to map divergent market states.

Sem MACD+RVI
Indicator

Sem MACD+RVI

iMACDiRVI

This indicator visualizes the synchronization between MACD and RVI oscillators to identify overlapping trend momentum and divergence states.

Sem MACD
Indicator

Sem MACD

iMACD

This indicator visualizes the directional bias by mapping MACD main and signal line crossovers into a binary histogram representing bullish and bearish momentum states.

Signal_Bars_Muk
Indicator

Signal_Bars_Muk

iCCIiMACDiRSIiStochastic

This indicator aggregates synchronized trend signals from MACD, RSI, Stochastic, CCI, and EMA across multiple timeframes into a single visual dashboard for real-time market sentiment analysis.

Indicator

Signal_Bars_v3_Daily

iCCIiMACDiRSIiStochastic
Signal_Bars_v8
Indicator

Signal_Bars_v8

iCCIiMACDiRSIiStochastic

This indicator aggregates real-time momentum, trend, and volatility data across multiple timeframes to provide a unified visual dashboard of market direction.

Squeeze_Break
Indicator

Squeeze_Break

iATRiMACDiADXiRSI

This indicator identifies potential market breakouts by detecting when Bollinger Bands expand beyond Keltner Channels, filtered by Momentum to confirm trend bias.

Squeeze_Break_v1
Indicator

Squeeze_Break_v1

iATRiMACDiADXiRSI

This system identifies trend reversals by detecting periods of low volatility via Bollinger Band and Keltner Channel convergence, triggering alerts when price momentum confirms an expansion into a high-volatility state.

Stochastic_Divergence
Indicator

Stochastic_Divergence

iMACDiStochastic

Identifies classical and hidden bullish or bearish divergence by comparing price extremes against stochastic oscillator peaks and troughs to detect trend exhaustion.

Stochastic_DivergenceMTF
Indicator

Stochastic_DivergenceMTF

iMACDiStochastic

This indicator detects classical and hidden bullish/bearish divergences by comparing price action extremes against stochastic momentum oscillators across customizable timeframes.

syst_Mrs V traffic lights 04
Indicator

syst_Mrs V traffic lights 04

iMACDiMAOnArrayiRSIiStochastic

A multi-layered trend confirmation system that synchronizes MACD momentum, Stochastic oscillations, and RSI-based moving average crossovers to generate visual buy and sell signals.

Indicator

Tabelka_kontrolna_PL

iADiACiAlligatoriFractals
TF_15B15D.01
Indicator

TF_15B15D.01

iMACDiMA

This indicator visualizes real-time trend alignment by simultaneously monitoring MACD crossovers and dual Exponential Moving Average (EMA) configurations across six distinct timeframes.

Indicator

TH_MTF_Bar1.4_alerts

iCCIiMACDiADXiOsMA
time to next bar
Indicator

time to next bar

iMACDiMA

This indicator identifies potential trend reversals by detecting MACD zero-line crossovers synchronized with Exponential Moving Average (EMA) distance thresholds.

Tipu_MACD
Indicator

Tipu_MACD

iMACD

This indicator identifies high-probability trend reversals and momentum shifts by analyzing MACD zero-line crossovers, signal line intersections, and multi-colored histogram volatility.

TrackTrend_MACD
Indicator

TrackTrend_MACD

iMACD

This indicator aggregates and displays the real-time directional momentum of the Moving Average Convergence Divergence across multiple concurrent timeframes in a single on-chart summary.

TrackTrend_MACD_Color
Indicator

TrackTrend_MACD_Color

iMACDiADXiRSI

This indicator synchronizes and visualizes real-time trend orientation across multiple timeframes by evaluating MACD main and signal line momentum shifts.

TrendForce
Indicator

TrendForce

iCCIiMACDiADXiMA