Trend-Table-1v1
Indicator

Trend-Table-1v1

iWPRiMAiSAR

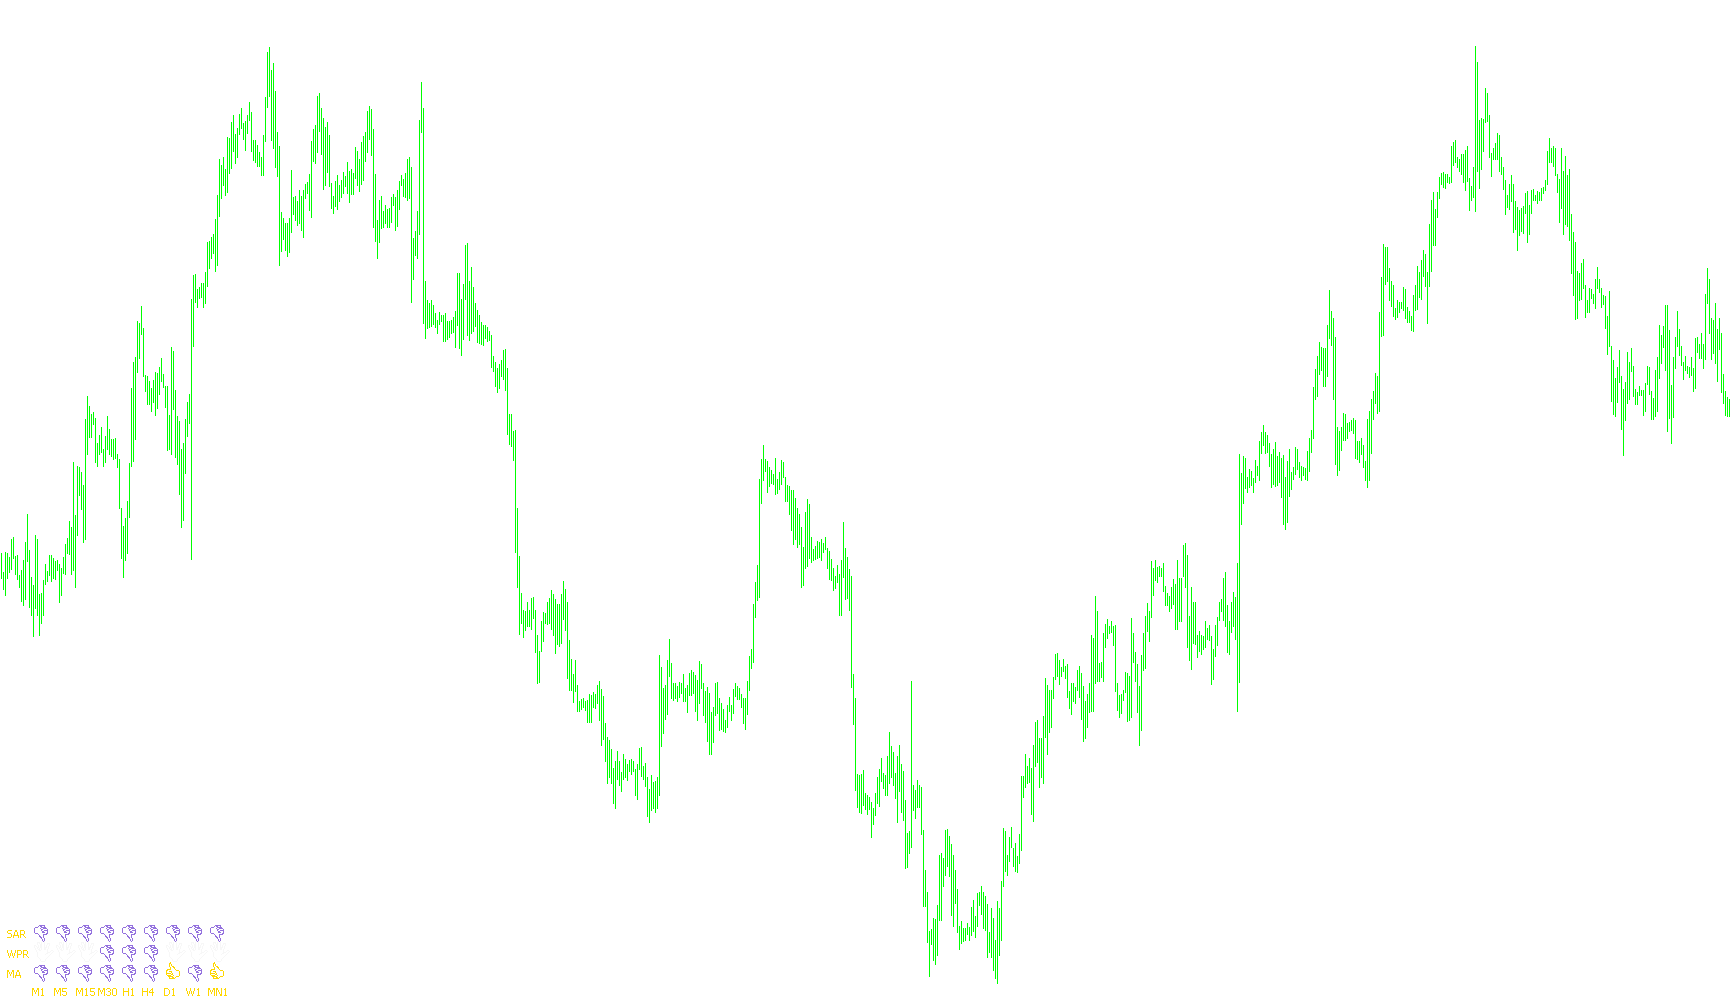
A comprehensive dashboard that visualizes concurrent trend strength and momentum signals across nine timeframes using Moving Average crossovers, Williams Percent Range extremes, and Parabolic SAR positionings.

Trendy Alert
Indicator

Trendy Alert

iBandsiCCIiADXiMA
Trendy
Indicator

Trendy

iBandsiCCIiADXiMA
VSA_ TrendDiamonds
Indicator

VSA_ TrendDiamonds

iBandsiMAiSAR

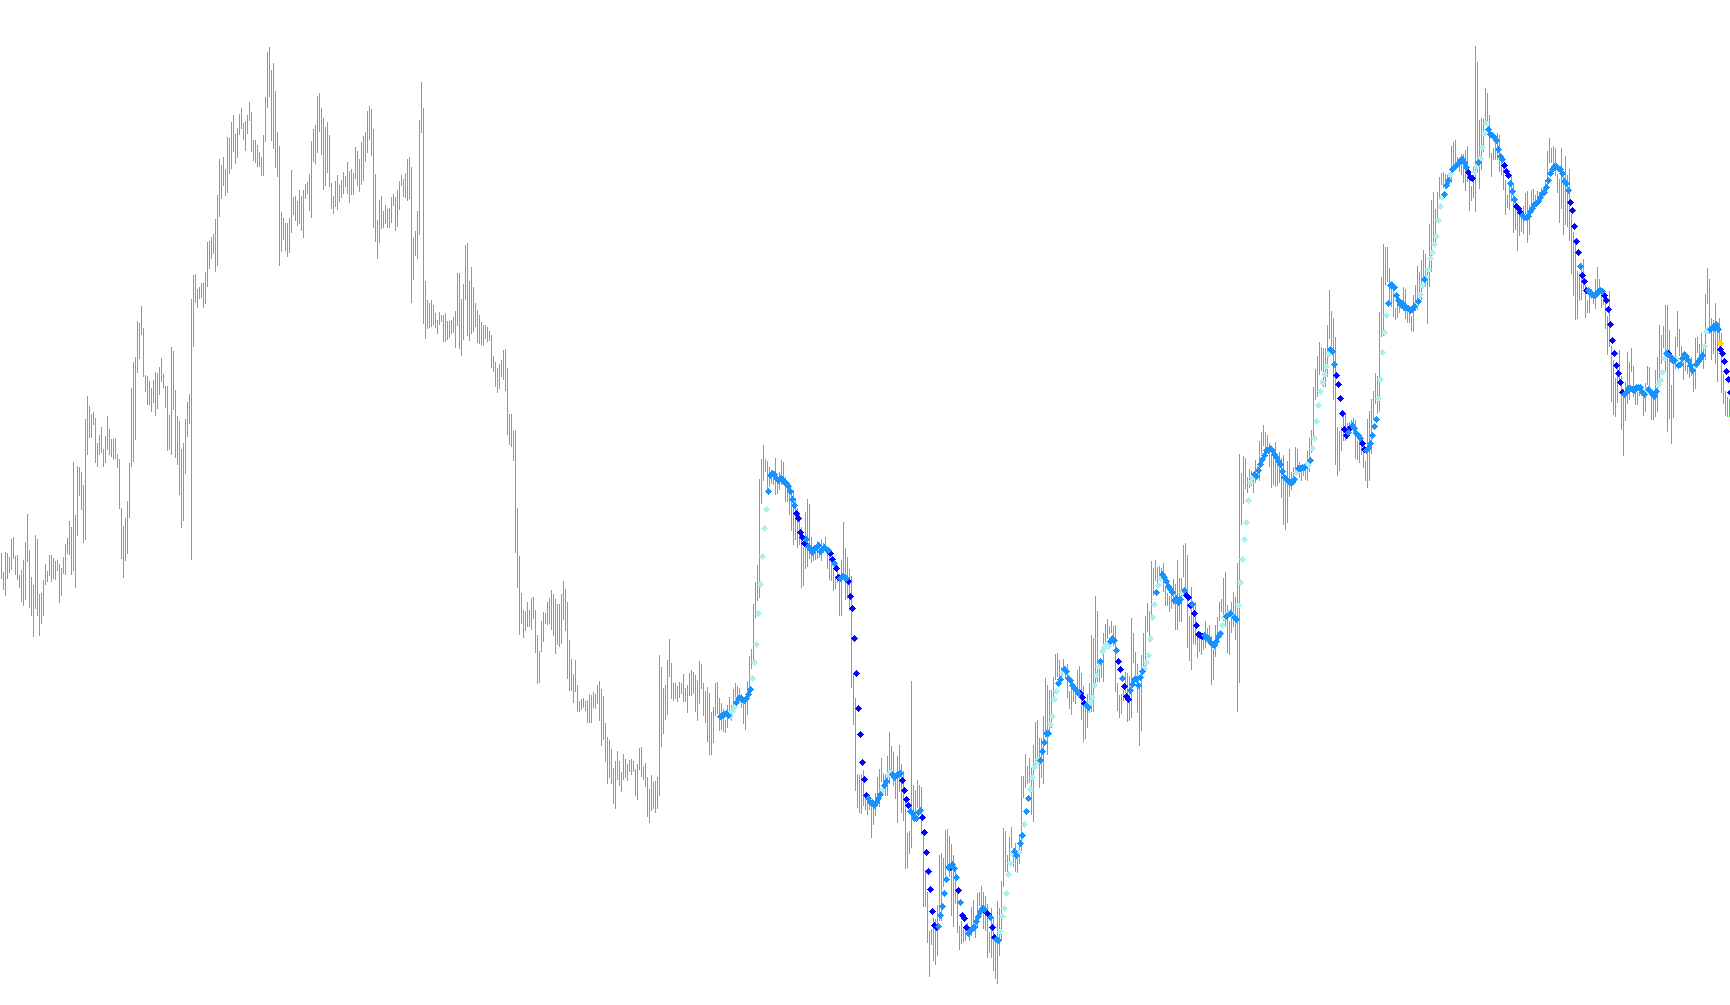
This indicator identifies directional shifts by synchronizing Smoothed Moving Average slopes with Parabolic SAR position and expanding Bollinger Band volatility thresholds.

YANSTEST 6wait
Indicator

YANSTEST 6wait

iMAiSAR

This indicator identifies high-probability trend reversals by synchronizing EMA crossover events with Parabolic SAR positional shifts and momentum filters.

YANSTEST 6wait_v1
Indicator

YANSTEST 6wait_v1

iMAiSAR

This indicator identifies high-probability momentum shifts by validating EMA crossovers and Parabolic SAR flips against specific trend duration thresholds.

YANS_IND2_01
Indicator

YANS_IND2_01

iMAiSAR

This indicator identifies trend reversal signals by detecting precise crossovers between the Parabolic SAR and 40-period EMA, validated by a trailing 10-period EMA momentum shift.

YANS_IND2_01_v1
Indicator

YANS_IND2_01_v1

iMAiSAR

This indicator identifies trend shifts by detecting Parabolic SAR crossovers relative to the EMA40, filtered by the proximity of the previous EMA10 intersection.

YANS_IND_04
Indicator

YANS_IND_04

iMAiSAR

This indicator identifies momentum shifts by synchronizing moving average crossovers with Parabolic SAR trend flips and proximity thresholds.

YANS_IND_04_v1
Indicator

YANS_IND_04_v1

iMAiSAR

This indicator identifies trend reversals and momentum shifts by synchronizing 10/40 Exponential Moving Average crossovers with Parabolic SAR flip dynamics and threshold proximity.

ZigZagOnParabolic
Indicator

ZigZagOnParabolic

iSAR

This indicator identifies market structural highs and lows by detecting price pivots triggered by Parabolic SAR reversals relative to midpoint price action.

Indicator

[i]4PMA_1_[1].Psars.Rgrssn.STD.V3

iMAiSAR
Indicator

_2523MTF_PSar

iSAR
_Channel@SAR
Indicator

_Channel@SAR

iSAR

This indicator identifies market structural extremes by detecting price reversals relative to Parabolic SAR values and maps them into dynamic support/resistance channels and ZigZag paths.

_TRO_Multi_Meter_SAR
Indicator

_TRO_Multi_Meter_SAR

iSAR

This indicator synchronizes and displays the Parabolic Stop and Reverse (SAR) trend status across multiple timeframes simultaneously on a single chart display.

_TRO_Multi_Meter_SAR_001
Indicator

_TRO_Multi_Meter_SAR_001

iSAR

This indicator aggregates Parabolic Sar values across seven distinct timeframes (M1 to D1) into a single visual dashboard to identify concurrent trend alignment.

Indicator

_TRO_SAK_MultiPair_v1

iADXiSARiRSI
Indicator

_TRO_SAK_MultiPair_v2

iADXiSARiRSI
Indicator

_TRO_SAK_MultiPair_v3

iADXiSARiRSI