i_DCG_ModStDev_v2
Indicator

i_DCG_ModStDev_v2

iMAOnArrayiStdDev

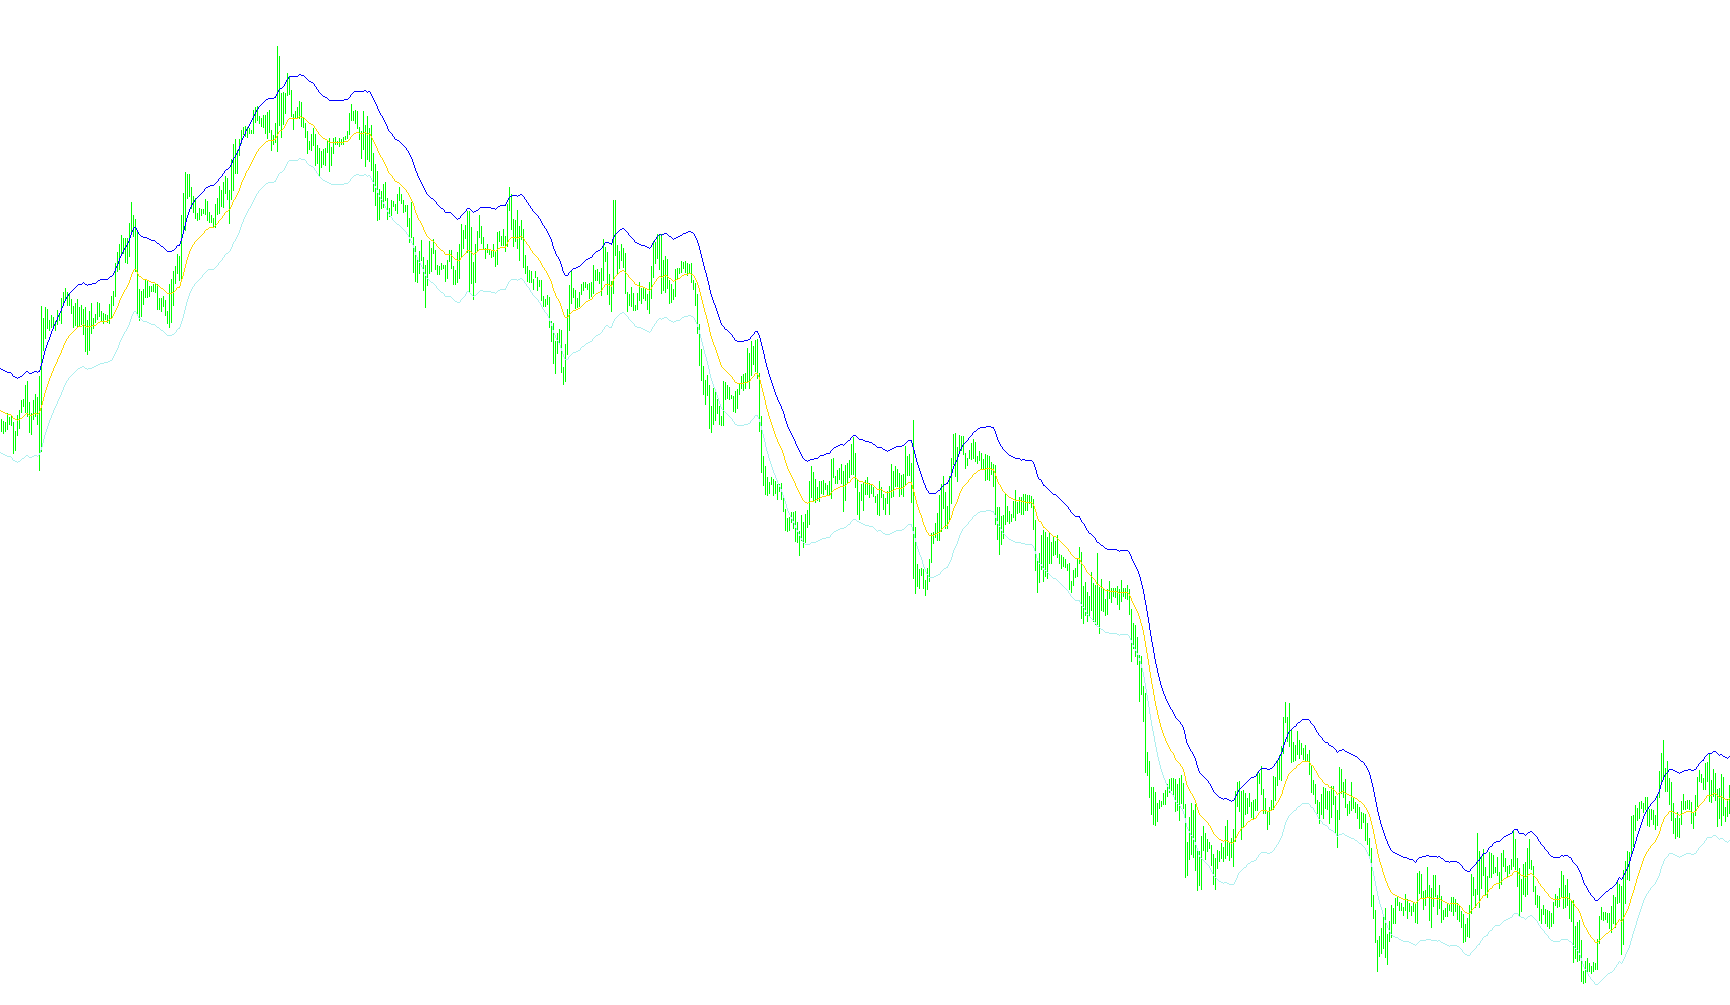
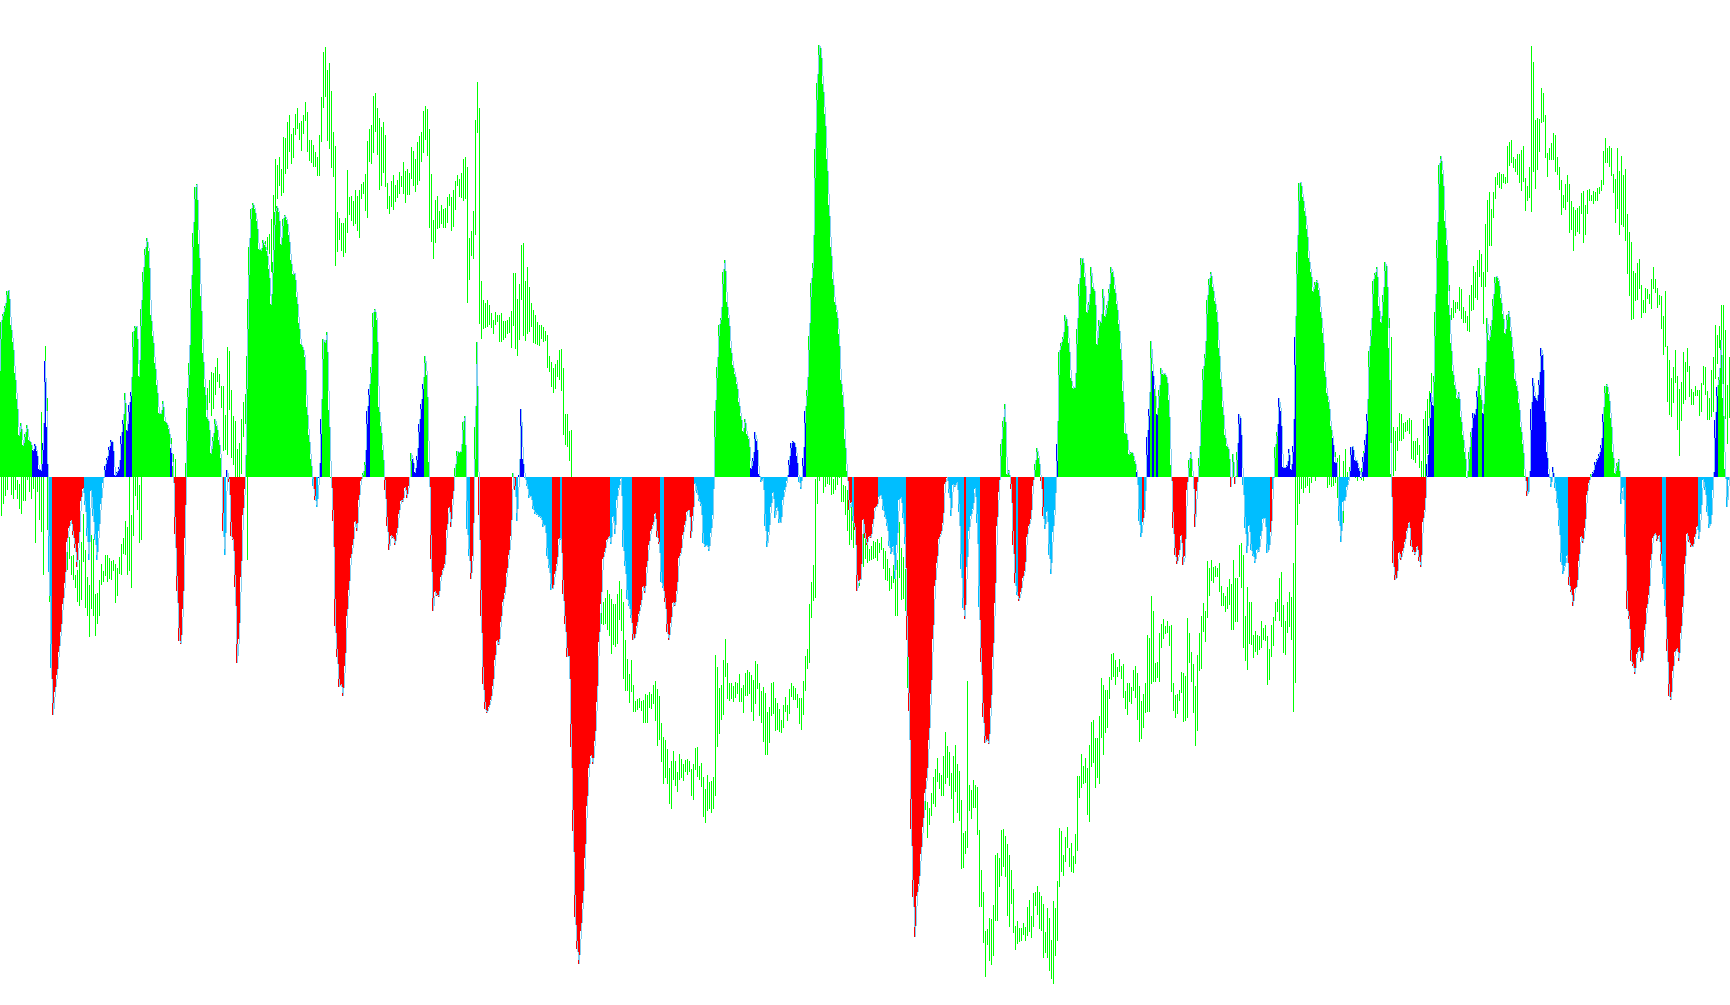
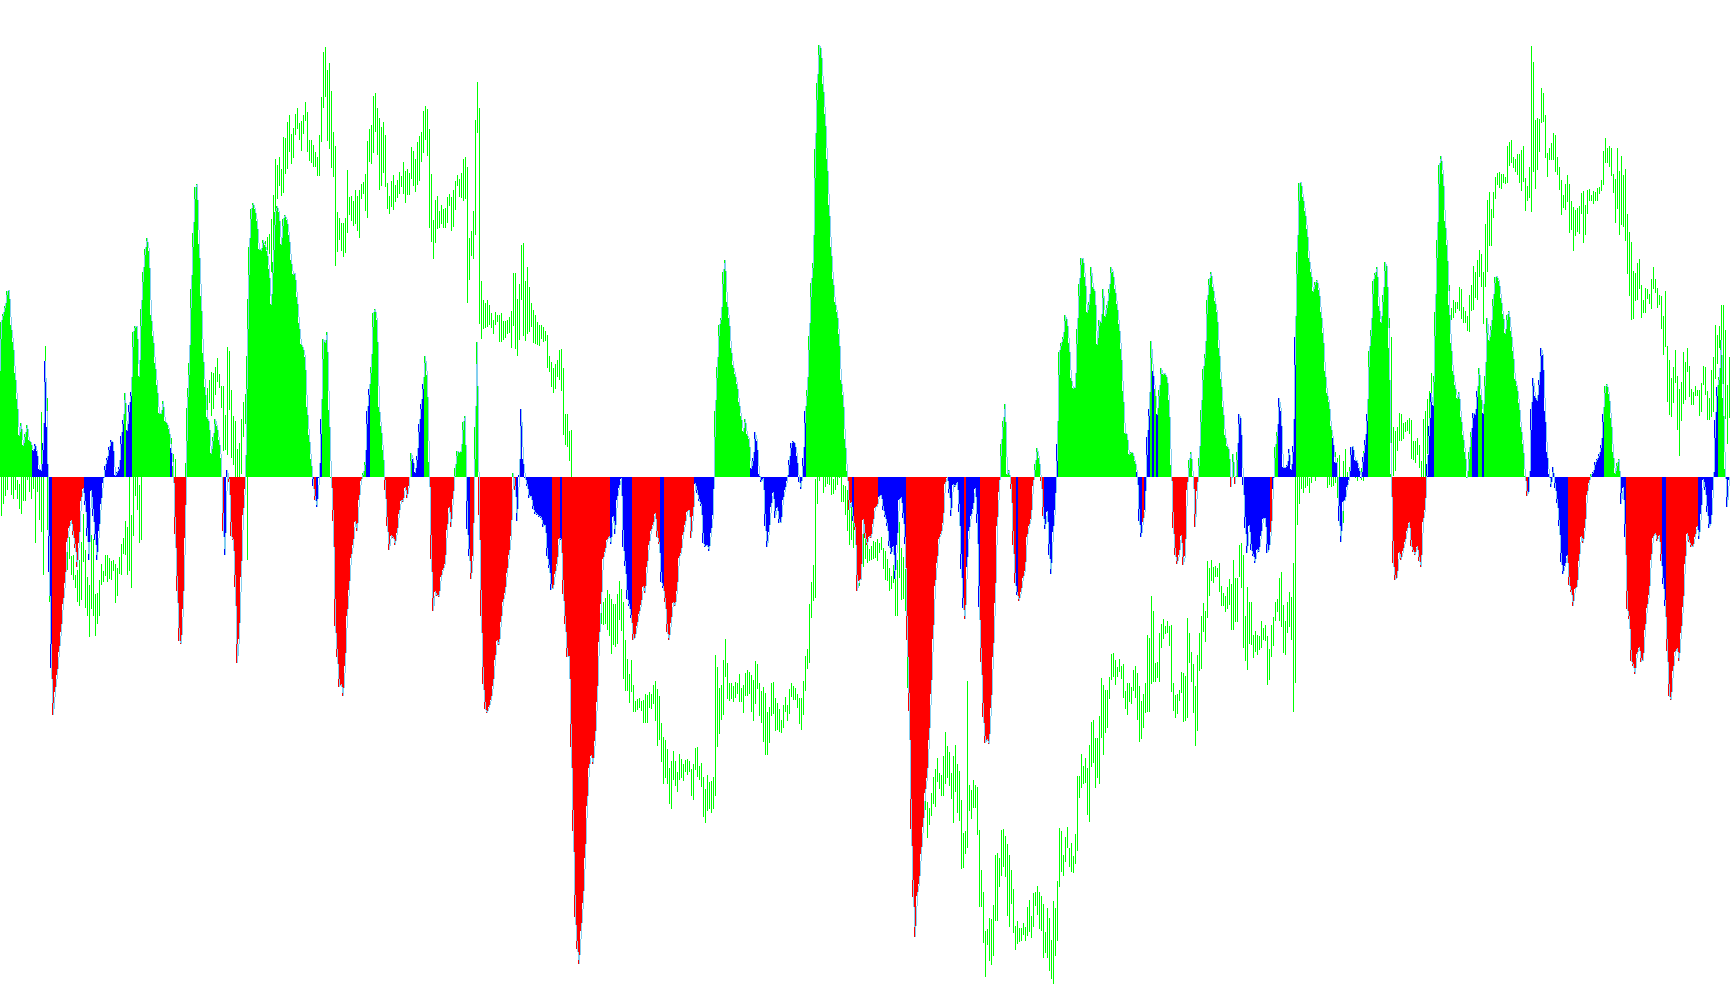
This indicator calculates the momentum of market volatility by computing the differential between dual linearly weighted moving averages applied to standard deviation values, modulated by Fibonacci scaling factors.

JB Center of Gravity
Indicator

JB Center of Gravity

iStdDev

This indicator employs a Gaussian elimination matrix algorithm to calculate the underlying polynomial curve of price action, establishing a dynamic equilibrium point and variance-based volatility bands.

JMA BBSQUEEZE
Indicator

JMA BBSQUEEZE

iATRiStdDev

This indicator identifies market compression by comparing linear regression slopes against a volatility ratio derived from standard deviation and average true range.

Juice v1.2 alert
Indicator

Juice v1.2 alert

iStdDev

This indicator identifies significant market volatility spikes by comparing the current Exponential Moving Average standard deviation against a historical average threshold.

Juice v1.2 alert_001
Indicator

Juice v1.2 alert_001

iStdDev

This indicator identifies bullish momentum by calculating the ratio between the current Exponential Moving Average standard deviation and its historical average value.

Juice-modified
Indicator

Juice-modified

iStdDev

The indicator categorizes market volatility by mapping Exponential Moving Average standard deviation values into three distinct visual zones based on user-defined price point thresholds.

Juice5Level
Indicator

Juice5Level

iStdDev

This indicator quantifies market volatility by categorizing standard deviation values into five distinct histogram-based intensity levels.

Juicenew
Indicator

Juicenew

iStdDev

This indicator categorizes market volatility by quantifying the Standard Deviation of price action into three distinct histogram zones based on predefined numerical boundaries.

Indicator

LR_R2_Trend_Sqz

iATRiMAiStdDev
Indicator

ma_i-CA

iMAiStdDev
MTF-StdDev-4
Indicator

MTF-StdDev-4

iStdDev

This indicator visualizes concurrent standard deviation values across multiple timeframes simultaneously to assess relative price fluctuations and market volatility.

MTF_Normalize
Indicator

MTF_Normalize

iStdDev

This indicator calculates a normalized price signal by applying an exponential decay function based on the squared distance from a moving average relative to its standard deviation.

Multipaires indicator_V2
Indicator

Multipaires indicator_V2

iBullsPoweriCCIiOBViRSI
my-envelope
Indicator

my-envelope

iMAiStdDev

This indicator projects upper and lower price boundaries by applying a multiplier to the standard deviation of a fast exponential moving average relative to a slower baseline.

my_squeeze
Indicator

my_squeeze

iCCIiMACDiRSIiStochastic

This indicator identifies market compression by comparing standard deviation against ATR to signal high-probability trend expansions validated by selectable momentum oscillators.

my_squeeze_Light
Indicator

my_squeeze_Light

iCCIiMACDiRSIiStochastic

This indicator identifies high-probability trend expansions by detecting price volatility compression through a Bollinger Squeeze model and validating directional momentum using selectable oscillators like MACD, RSI, or CCI.

my_squeeze_Light_001
Indicator

my_squeeze_Light_001

iCCIiMACDiRSIiStochastic

This indicator identifies high-probability breakout points by detecting periods where volatility contracts below the Keltner Channel and then confirms trend expansion via selectable oscillators like MACD, RSI, or Stochastic.

my_squeeze_Light_v2
Indicator

my_squeeze_Light_v2

iCCIiMACDiRSIiStochastic

This indicator identifies high-probability breakout points by detecting price compression through a modified Bollinger Band squeeze calculation combined with selectable momentum oscillators.

Pearson2
Indicator

Pearson2

iMAiStdDev

This indicator quantifies the linear relationship between two separate currency pairs by calculating the Pearson correlation coefficient based on moving average deviations and standard deviations.

R_Volatility_I
Indicator

R_Volatility_I

iStdDev

This indicator quantifies relative price strength by calculating the ratio between high and low standard deviations smoothed via exponential moving averages.

SD Channels
Indicator

SD Channels

iMAiStdDev

This indicator projects dual-layered price boundaries by calculating standard deviation offsets from multiple linear weighted moving averages to visualize market expansion and contraction.

Sem SAR+ADX+StDev
Indicator

Sem SAR+ADX+StDev

iADXiSARiStdDev

This indicator maps standard deviation values into four distinct histogram zones based on the intersection of Parabolic SAR trend flips and ADX directional strength.

Indicator

SFX_TOR

iATRiMAOnArrayiStdDev
Squeeze Straddle
Indicator

Squeeze Straddle

iATRiMAiStdDev

The indicator identifies market equilibrium by calculating the ratio between standard deviation and Average True Range to detect low-volatility squeeze zones.

squeeze_ra
Indicator

squeeze_ra

iATRiMAiStdDev

This indicator identifies periods of market contraction using Bollinger and Keltner Band crossovers, while visualizing smoothed momentum shifts through a linear regression-based histogram.

Indicator

StdDev_mtf

iStdDev
StochCross_CCI_v2
Indicator

StochCross_CCI_v2

iCCIiATRiStdDeviStochastic

This indicator identifies bullish and bearish reversals by synchronizing Stochastic oscillator crossovers with Trend CCI momentum, Price Action direction, and Bollinger Squeeze volatility thresholds.

Synergy_TradeSignal
Indicator

Synergy_TradeSignal

iMAiStdDev

This multi-layered indicator synthesizes Heiken Ashi trends, TDI momentum oscillators, and dynamic Standard Deviation filters to identify high-probability reversal zones and trend continuations.

Indicator

Tabelka_kontrolna_PL

iADiACiAlligatoriFractals
VIDYA
Indicator

VIDYA

iStdDev

This indicator calculates a Variable Index Dynamic Average by scaling the smoothing coefficient based on the ratio of short-term to long-term standard deviations.

VininI_CMA
Indicator

VininI_CMA

iMAiStdDev

The algorithm dynamically adjusts price smoothing by weighting the distance between a moving average and historical volatility using a coefficient-based standard deviation filter.

Indicator

WCCISqueeze v1

iCCIiATRiStdDev
X_profile
Indicator

X_profile

iStdDev

The indicator calculates a running arithmetic mean of closing prices relative to a starting point and projects multi-level volatility bands based on standard deviation.

X_profile_v1
Indicator

X_profile_v1

iStdDev

The indicator calculates a running cumulative average of closing prices to generate dynamic price channels bounded by multiple standard deviation offsets.

zscore
Indicator

zscore

iMAiStdDev

This indicator quantifies price eccentricity by calculating the number of standard deviations the current closing price sits away from its 60-period moving average.

zscore2x_mtf
Indicator

zscore2x_mtf

iMAiStdDev

This indicator calculates the relative distance of current price from moving averages normalized by standard deviation across multiple timeframes to identify overextended market conditions.

zscore_mtf
Indicator

zscore_mtf

iMAiStdDev

This indicator quantifies price extremes by calculating the distance between the closing price and its moving average, normalized by the standard deviation over a multi-timeframe scale.

Indicator

[ea]BollTrade_Ron_MT4_v04 OrderReliable News

iMAiStdDev
[i]BollTrade_Ron_MT4_v04b
Indicator

[i]BollTrade_Ron_MT4_v04b

iMAiStdDev

This indicator identifies extreme price excursions by signaling entries when the market high or low breaches the Bollinger Bands plus a specific point-based buffer.

[i]BollTrade_Ron_MT4_v04b_v1
Indicator

[i]BollTrade_Ron_MT4_v04b_v1

iMAiStdDev

Identifies extreme price action by detecting candles that penetrate beyond a set distance from the Bollinger Band envelopes.

[i]BollTrade_Ron_MT4_v04c
Indicator

[i]BollTrade_Ron_MT4_v04c

iMAiStdDev

This indicator identifies extreme price excursions by signaling when the high or low of a candle breaches the Bollinger Band boundaries by a specific predefined point distance.

[i]BollTrade_Ron_MT4_v05a
Indicator

[i]BollTrade_Ron_MT4_v05a

iATRiMAiStdDev

This indicator identifies extreme price expansions beyond Bollinger Bands by utilizing either fixed-point offsets or ATR-weighted buffers to generate reversal signals with automated take-profit and stop-loss levels.

[i]BollTrade_Ron_MT4_v05b
Indicator

[i]BollTrade_Ron_MT4_v05b

iATRiMAiStdDev

This indicator identifies potential mean reversion entries by detecting price exhaustion beyond extended Bollinger Band boundaries, utilizing optional ATR-based volatility scaling for dynamic risk management.
_2523NBS Juice
Indicator

_2523NBS Juice

iStdDev

This indicator categorizes market volatility into three distinct intensity zones by comparing current linear weighted standard deviation against a dynamically calculated historical average.

Indicator

bb_osma_v1

iMAiMAOnArrayiStdDevOnArray
Indicator

BB_MACD_v2

iMAiMAOnArrayiStdDevOnArray
Indicator

ADX-StDev_v1

iMAOnArrayiStdDevOnArray
Indicator

Change_of_Volatility_v1

iMomentumiStdDevOnArray
Indicator

COGMACD_v1

iMACDiStdDevOnArray
Indicator

COGSTOCH_v1

iStdDevOnArrayiStochastic