Indicator

iStdDev.Gap

iStdDevOnArray
Indicator

Ichimoku2

iMAOnArrayiStdDevOnArray
Indicator

FX5_SelfAdjustingRSI_v1_0

iRSIiStdDevOnArray
Indicator

FX5_SelfAdjustingRSI_v1_0b1e

iRSIiStdDevOnArray
Indicator

High_Volume_Bars

iStdDevOnArray
Indicator

+JoGET#58+

iMAiMAOnArrayiStdDevOnArray
ADX-StDev
Indicator

ADX-StDev

iMAOnArrayiStdDevOnArray

This indicator synthesizes directional movement indices with smoothed standard deviation analysis to quantify trend strength and price dispersion simultaneously.

ATR_Ratio_v2
Indicator

ATR_Ratio_v2

iATRiStdDevOnArray

This indicator quantifies relative volatility dynamics by calculating the ratio between fast and slow Average True Range values, supplemented by a secondary standard deviation variance analysis.

BB_MACD
Indicator

BB_MACD

iMAiMAOnArrayiStdDevOnArray

This indicator calculates the divergence between fast and slow exponential moving averages and overlays Bollinger Bands to identify trend exhaustion and momentum shifts.

BB_MACD3
Indicator

BB_MACD3

iMAiMAOnArrayiStdDevOnArray

This indicator overlays a Bollinger Band envelope onto a MACD calculation to identify volatility-adjusted trend shifts and momentum extremes.

BB_MACD3_v1
Indicator

BB_MACD3_v1

iMAiMAOnArrayiStdDevOnArray

This indicator overlays Bollinger Bands onto a MACD calculation to identify trend reversals and price momentum exhaustion through standard deviation variance.

BB_MACD_CCT
Indicator

BB_MACD_CCT

iMAiMAOnArrayiStdDevOnArray

This indicator synthesizes MACD momentum with Bollinger Band volatility bounds to visualize directional shifts and price-action extremes.

BB_MACD_v1.01
Indicator

BB_MACD_v1.01

iMAiMAOnArrayiStdDevOnArray

This indicator calculates a MACD signal and applies Bollinger Band envelopes to the momentum values to identify trend exhaustion and volatility extremes.

BB_MACD_v1.03
Indicator

BB_MACD_v1.03

iMAiMAOnArrayiStdDevOnArray

This indicator identifies trend shifts by applying Bollinger Band volatility filters to the differential momentum of Exponential Moving Averages.

BB_MACD_v1
Indicator

BB_MACD_v1

iMAiMAOnArrayiStdDevOnArray

This indicator overlays Bollinger Bands onto a MACD calculation to identify momentum shifts and volatility-adjusted trend reversals.

BB_MACD_v3
Indicator

BB_MACD_v3

iMAiMAOnArrayiStdDevOnArray

This indicator overlays a Bollinger Band volatility envelope onto the MACD momentum oscillator to identify extreme price velocity and trend exhaustion points.

bb_osma
Indicator

bb_osma

iMAiMAOnArrayiStdDevOnArray

This indicator synthesizes an Oscillator-based Moving Average with a dynamic volatility envelope to identify trend momentum and structural reversals.

b_Regression_Analysis_v2
Indicator

b_Regression_Analysis_v2

iStdDevOnArray

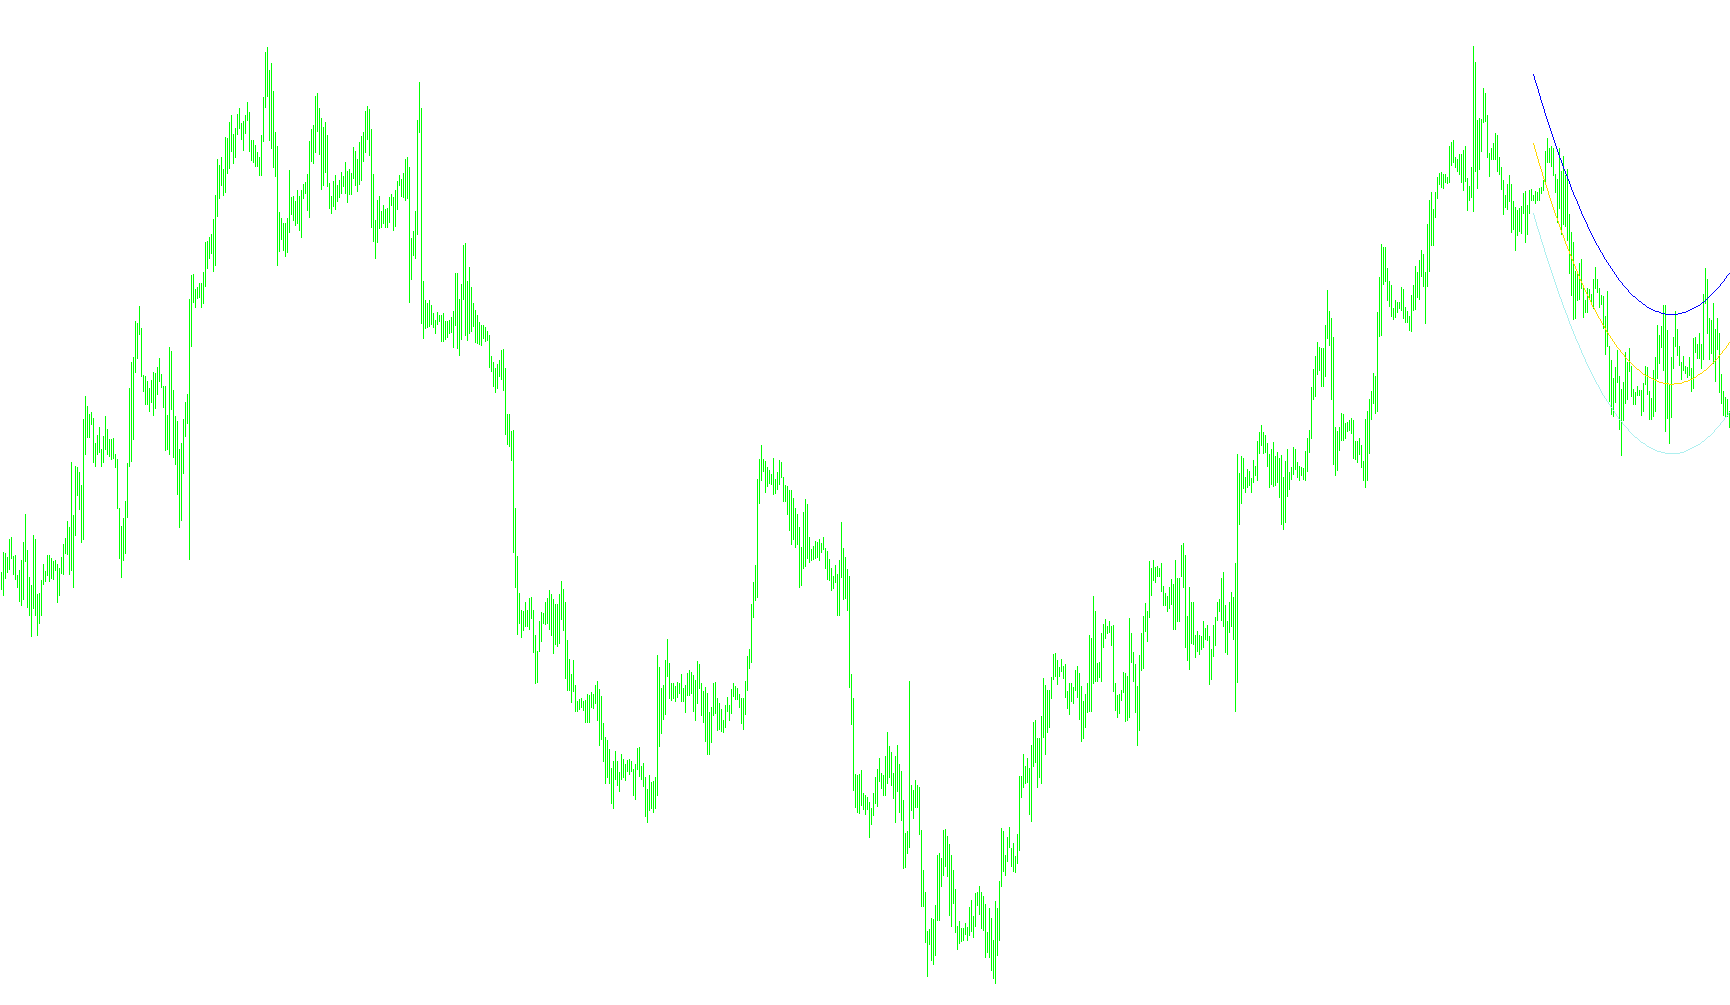
The script evaluates multiple mathematical models—linear, quadratic, logarithmic, and exponential—to automatically identify the curve with the lowest standard deviation and project its trend with confidence bands.

Indicator

Change_of_Volatility

iMomentumiStdDevOnArray
Indicator

COGMACD

iMACDiStdDevOnArray
Indicator

COGSTOCH

iStdDevOnArrayiStochastic
Detrended_Price_Oscillator
Indicator

Detrended_Price_Oscillator

iMAiStdDevOnArray

Calculates the variance between current price action and moving average benchmarks while establishing volatility-based extreme zones to identify momentum exhaustion.

FX5_SelfAdjustingRSI_v1.0[1]
Indicator

FX5_SelfAdjustingRSI_v1.0[1]

iRSIiStdDevOnArray

This indicator calculates Relative Strength Index levels that dynamically expand and contract based on smoothed price deviation or standard deviation metrics.

FX5_SelfAdjustingRSI_v1.0[1]_v1
Indicator

FX5_SelfAdjustingRSI_v1.0[1]_v1

iRSIiStdDevOnArray

This indicator calculates relative strength by generating adaptive overbought and oversold thresholds based on moving average smoothing or standard deviation of price oscillations.

HistoBands
Indicator

HistoBands

iMAOnArrayiStdDevOnArray

This indicator calculates price deviation by applying a standardized sigma-based normalization to a modified three-point average of high, low, and closing prices.

Kase CD Peak
Indicator

Kase CD Peak

iATRiMAOnArrayiStdDevOnArray

This indicator quantifies price action symmetry by normalizing high-low spreads against ATR and applying multi-stage smoothing to identify momentum shifts and volatility extremes.

KasePeakOscilator_v1
Indicator

KasePeakOscilator_v1

iATRiMAOnArrayiStdDevOnArray

This indicator identifies trend reversals by calculating a relative high-low variance normalized by volatility and filtering momentum shifts through moving average deviations.

NeutralHedge osc_v3[1].1
Indicator

NeutralHedge osc_v3[1].1

iMAOnArrayiStdDevOnArray

This indicator quantifies the price discrepancy between a primary and secondary asset by normalizing their relative ranges and identifying statistically significant deviations using standard deviation thresholds.

RangerBB
Indicator

RangerBB

iMAiMAOnArrayiStdDevOnArray

This indicator calculates a synthetic price deviation by summing the difference between closing prices and moving averages of high and low extremes, then overlaying a Bollinger Band envelope on the resulting signal.

Indicator

RSI_SelfAdjustRSI_v1.0FX5_mtf

iRSIiStdDevOnArray
Indicator

xedginves@yahoo.com__Neutral_Hedge_osc_v4.5

iMAOnArrayiStdDevOnArray
Indicator

xedginves@yahoo.com__Neutral_Hedge_osc_v4.5~

iMAOnArrayiStdDevOnArray