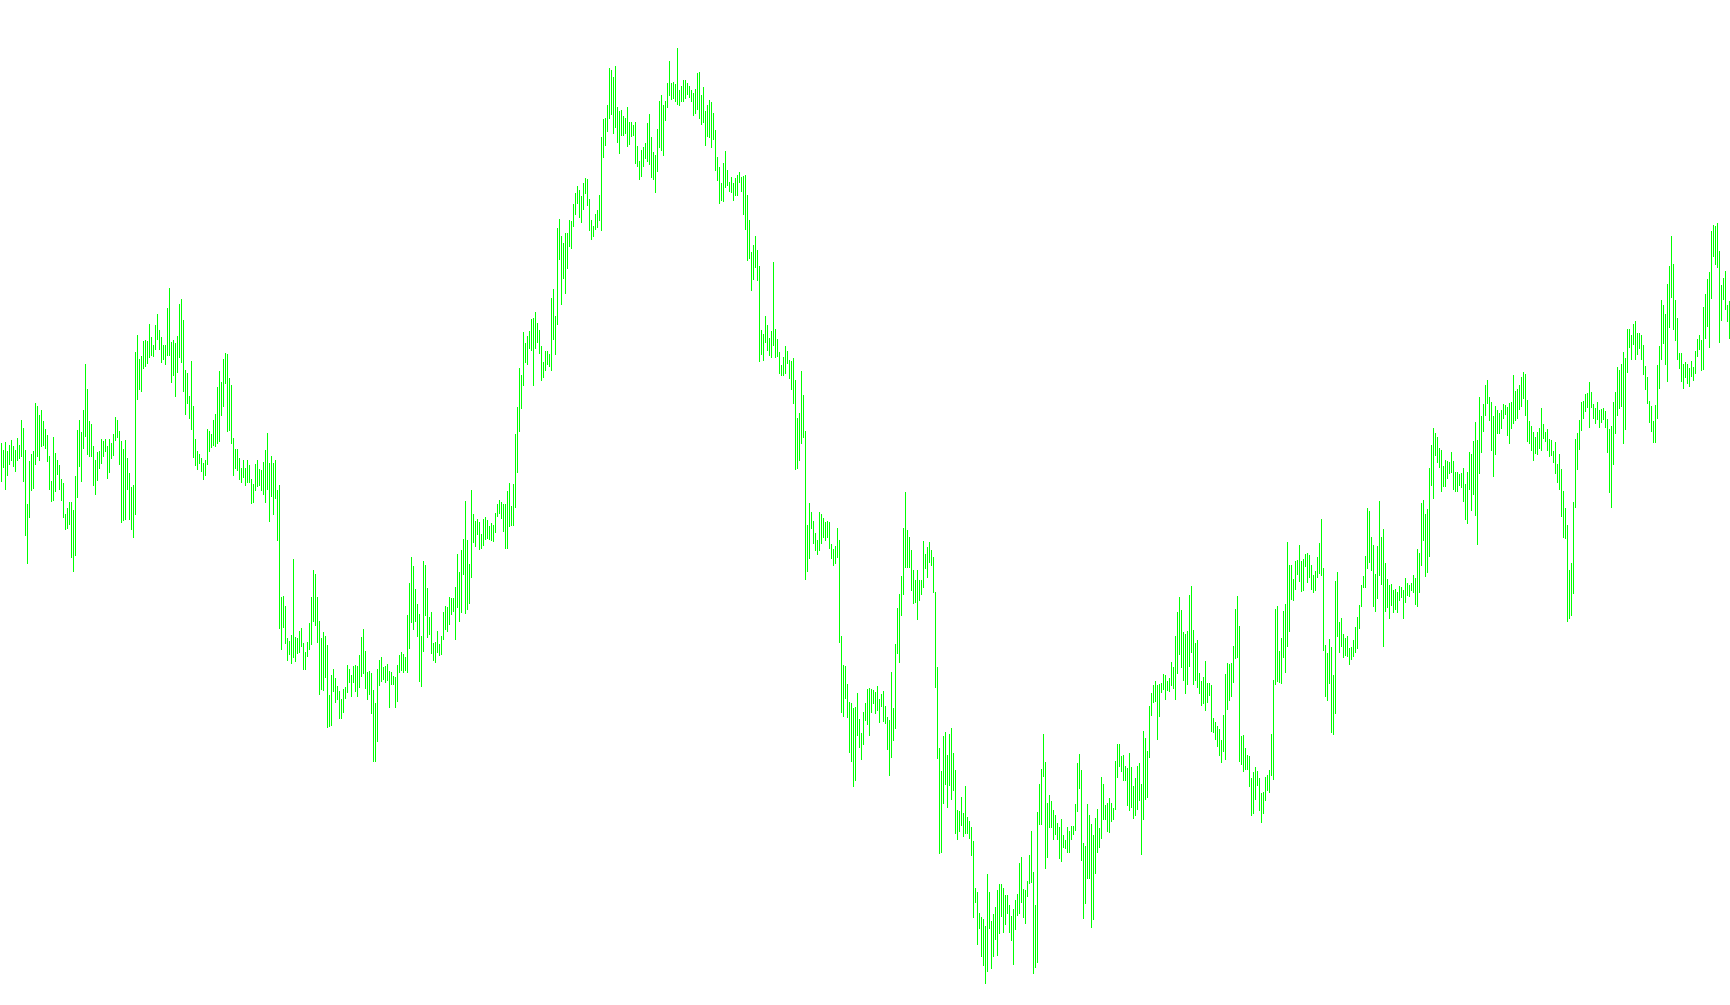
This tool, known as AggZ, is designed to provide traders with a visual representation of market momentum by comparing short-term price fluctuations against long-term historical trends. It functions by analyzing "Z-Scores," which are statistical measurements that tell us how far the current price has deviated from its average behavior.
How the Logic Works
The indicator operates by calculating two distinct types of Z-Scores simultaneously:
- Short-Term Momentum (Fast): The script looks at a very recent window of price action (the fast period) to see how quickly the price is moving relative to its immediate average.
- Long-Term Trend (Slow): The script looks at a much broader historical window to understand the overall established trend of the asset.
The AggZ Calculation
The "AggZ" value is created by combining these two perspectives. It takes the long-term Z-Score and combines it with the inverse of the short-term Z-Score. By averaging these two opposite perspectives together, the indicator attempts to balance immediate price volatility with broader market context.
Essentially, it seeks to identify where the current price sits in relation to the "normal" behavior of both the recent past and the distant past.
How to Interpret the Results
The indicator is displayed as a histogram in a separate window below your main chart. It provides a clear visual signal based on its position relative to the zero line:
- Bullish Signal: When the indicator moves above 0, it suggests that the combined data points favor an upward trend, potentially indicating a buying opportunity.
- Bearish Signal: When the indicator moves below 0, it suggests that the combined data points favor a downward trend, potentially indicating a selling opportunity.
By using this method, the script helps filter out some of the "noise" of daily price movements to give you a clearer picture of whether the current market sentiment is leaning toward growth or decline.
//+------------------------------------------------------------------+
//|                                                         AggZ.mq4 |
//|                                     Copyright ?2010, Walter Choy |
//|                                             brother3th@yahoo.com |
//+------------------------------------------------------------------+
#property copyright "Copyright ?2010, Walter Choy"
#property link      "brother3th@yahoo.com"

// The calculation is simple:
//
// AggZ = (-1*(10-day z-score)+(200-day z-score))/2
//
// where z-score = (close - sma(closing prices over last n periods))/(standard deviation(closing prices over last n periods))
//
// buy above 0, sell below 0 as a basic strategy.


#property indicator_separate_window
#property indicator_buffers 1
#property indicator_color1 OrangeRed
//---- input parameters
extern int       fast_z_period=10;
extern int       slow_z_period=252;
//---- buffers
double AggZBuffer[];
double z_score_fast[];
double z_score_slow[];
//+------------------------------------------------------------------+
//| Custom indicator initialization function                         |
//+------------------------------------------------------------------+
int init()
  {
//---- indicators
   IndicatorBuffers(3);

   SetIndexStyle(0,DRAW_HISTOGRAM);
   SetIndexBuffer(0,AggZBuffer);
   SetIndexLabel(0, "AggZ");
   SetIndexDrawBegin(0, slow_z_period);

   SetIndexBuffer(1,z_score_fast);
   SetIndexBuffer(2,z_score_slow);

   IndicatorShortName("AggZ ("+fast_z_period+","+slow_z_period+")");
//----
   return(0);
  }
//+------------------------------------------------------------------+
//| Custom indicator deinitialization function                       |
//+------------------------------------------------------------------+
int deinit()
  {
//----

//----
   return(0);
  }
//+------------------------------------------------------------------+
//| Custom indicator iteration function                              |
//+------------------------------------------------------------------+
int start()
  {
   int    counted_bars=IndicatorCounted();
   int    i, j;
   double std_fast, std_slow, ma_fast, ma_slow;
//----
   i = Bars - counted_bars - 1;
   j = i;
   while(i>=0){
      // z-score = (close - sma(closing prices over last n periods))/(standard deviation(closing prices over last n periods))
      ma_fast = iMA(NULL, 0,  fast_z_period, 0, MODE_SMA, PRICE_CLOSE, i);
      std_fast = iStdDev(NULL, 0, fast_z_period, 0, MODE_SMA, PRICE_CLOSE, i);
      if (std_fast > 0) z_score_fast[i] = (Close[i] - ma_fast)/std_fast;

      ma_slow = iMA(NULL, 0,  slow_z_period, 0, MODE_SMA, PRICE_CLOSE, i);
      std_slow = iStdDev(NULL, 0, slow_z_period, 0, MODE_SMA, PRICE_CLOSE, i);
      if (std_slow > 0) z_score_slow[i] = (Close[i] - ma_slow)/std_slow;
      i--;
   }

   while(j>=0){
      // AggZ = (-1*(10-day z-score)+(200-day z-score))/2
      AggZBuffer[j] = (-1 * z_score_fast[j] + z_score_slow[j]) / 2;
      j--;
   }
//----
   return(0);
  }
//+------------------------------------------------------------------+
Comments