Fisher_org_v12_v1
Download script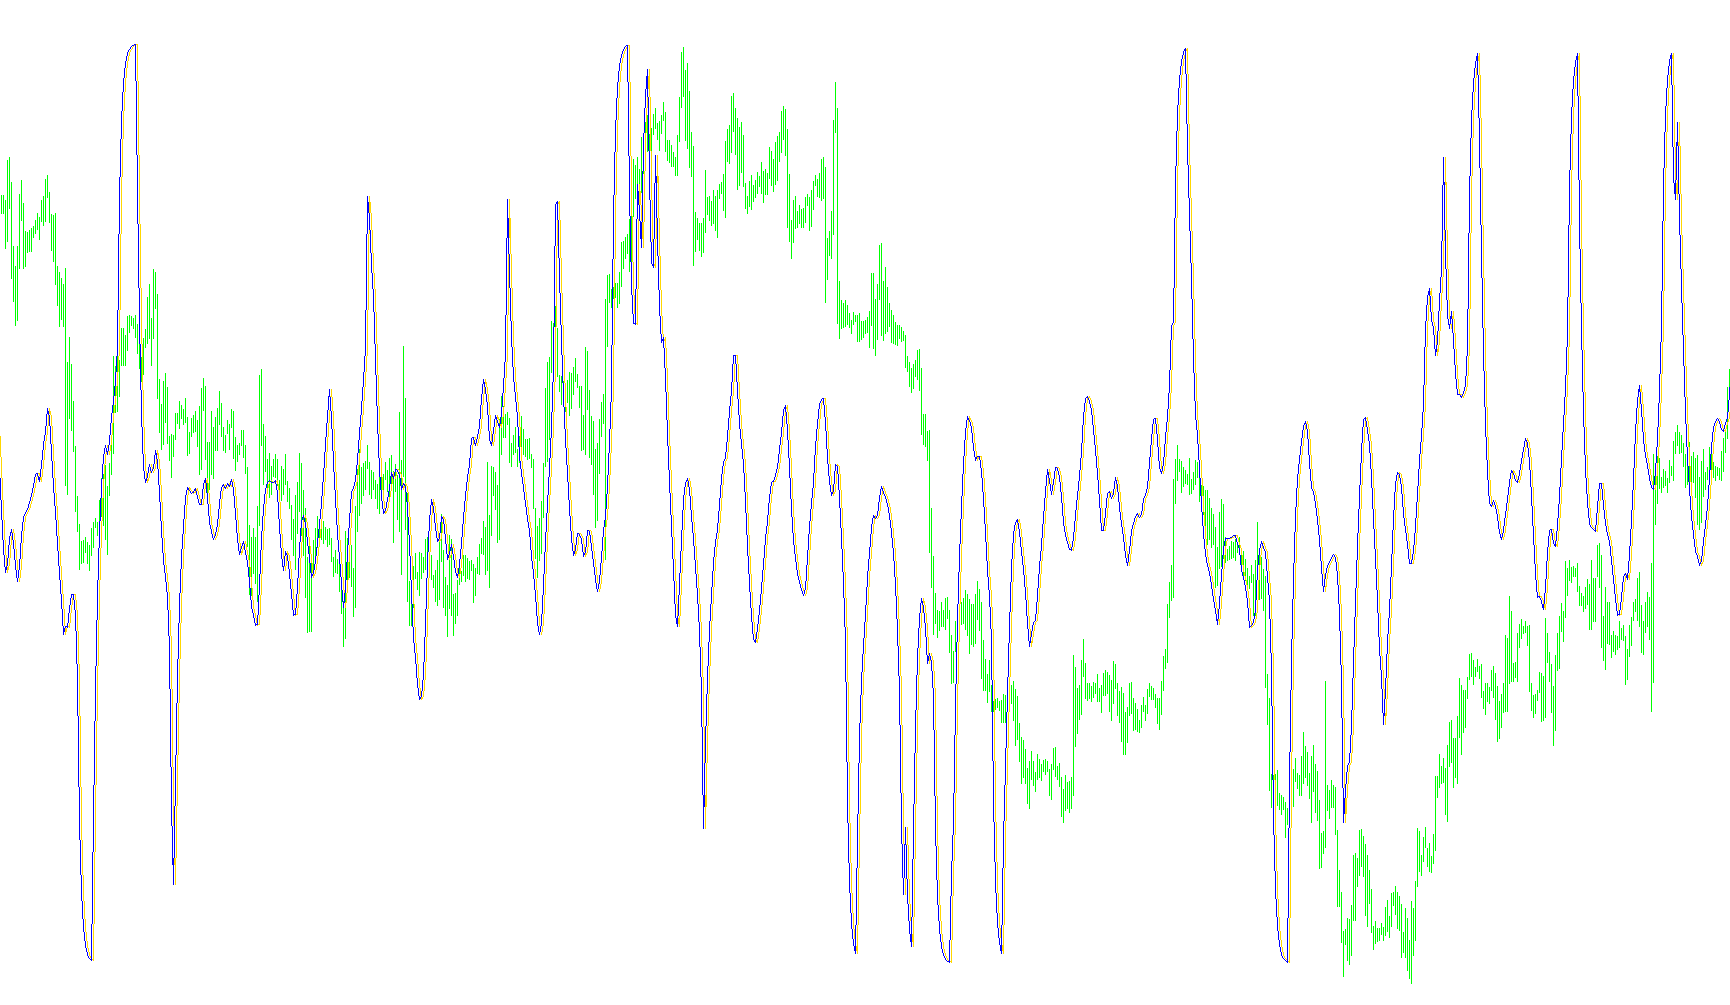
This tool is designed to help traders identify momentum and potential trend reversals by analyzing price action through a mathematical transformation. Instead of simply looking at the raw price of an asset, this indicator processes market data to highlight when the "speed" or "intensity" of a movement reaches an extreme point.
How the Logic Works
1. Identifying Price Ranges The script begins by scanning a specific window of recent history (defined by the user) to find the highest and lowest prices reached during that period. By establishing these boundaries, the tool creates a sense of the "playing field" for the current market movement.
2. Calculating Relative Position Within that high-low range, the tool determines where the current price sits. It essentially asks: Is the price currently near the top of its recent range, the bottom, or somewhere in the middle? This is converted into a numerical value that represents the asset's relative position.
3. Smoothing the Data To prevent the indicator from being "noisy" or reacting too violently to tiny, insignificant price flickers, the script applies a smoothing technique. It takes the current position and blends it with the results of the previous calculation. This ensures that the resulting line moves fluidly across your screen rather than jumping erratically.
4. The Fisher Transformation The core of this script is the "Fisher" transformation. This is a mathematical formula used to convert price relatives into a format that makes it much easier to spot extreme overbought or oversold conditions. It effectively "squashes" the data to make trends more visible and highlights moments where the momentum is becoming unsustainable.
What You See on the Chart
The indicator produces two primary visual elements in a separate window below your main price chart:
- The Fisher Line: This represents the transformed momentum of the market. It shows you the overall "strength" of the current move.
- The Trigger Line: This acts as a secondary reference point. By comparing the Fisher line against this trigger, traders look for specific crossovers—moments where the momentum shifts direction significantly enough to suggest a potential change in the trend.
In summary, this tool helps filter out market "static" so you can more clearly see when a price move is reaching an extreme and might be preparing to turn around.
/*-----------------------------+
|			       |
| Shared by www.Aptrafx.com    |
|			       |
+------------------------------*/

//+------------------------------------------------------------------+
//|                                                Fisher_org_v1.mq4 |
//|                           Copyright © 2006, TrendLaboratory Ltd. |
//|            http://finance.groups.yahoo.com/group/TrendLaboratory |
//|                                       E-mail: igorad2004@list.ru |
//+------------------------------------------------------------------+
#property copyright "Copyright © 2005, TrendLaboratory Ltd."
#property link      "http://finance.groups.yahoo.com/group/TrendLaboratory"

#property indicator_separate_window
#property indicator_buffers 2
#property indicator_color1 LightBlue
#property indicator_color2 Tomato
//---- input parameters
extern int Length=10;
extern int Price=4;
extern int NumBars=0;
//---- buffers
double Buffer[];
double Value [];
double Fisher[];

int init()
  {
  IndicatorBuffers(3);

  SetIndexStyle(0,DRAW_LINE);
  SetIndexStyle(1,DRAW_LINE);

  SetIndexBuffer(0,Buffer);
  SetIndexBuffer(1,Fisher);
  SetIndexBuffer(2,Value);

  IndicatorShortName ("FisherTransform(" + Length + "," + Price + ")");
  SetIndexLabel (0, "Fish");
  SetIndexLabel (1, "Trigger");

  SetIndexDrawBegin(0,Length);
  SetIndexDrawBegin(1,Length);

  return(0);
  }


//+------------------------------------------------------------------+
//| Fisher_org_v1                                                         |
//+------------------------------------------------------------------+
int start()
  {
  int shift;

  double smin=0,smax=0;

if (NumBars>0) int NBars=NumBars; else NBars=Bars;

for(shift=NBars;shift>=0;shift--)
   {
   Buffer[shift]=0.0;
   Value [shift]=0.0;
   Fisher[shift]=0.0;
   }

for(shift=NBars-2-Length;shift>=0;shift--)
   {
   smax = High[Highest(NULL,0,MODE_HIGH,Length,shift)];
   smin = Low[Lowest(NULL,0,MODE_LOW,Length,shift)];

   double price = iMA(NULL,0,1,0,0,Price,shift);

   if (smax==smin) smax=smin+Point;

   double wpr=(price-smin)/(smax-smin);

   Value[shift] = (wpr-0.5) + 0.67*Value[shift+1];

   if (Value[shift]> 0.99) Value[shift]= 0.999;
   if (Value[shift]<-0.99) Value[shift]=-0.999;

   Fisher[shift] = 0.5*MathLog((1.0+Value[shift])/(1.0-Value[shift]))+0.5*Fisher[shift+1];
   Buffer[shift] = Fisher [shift+1];

   }
  return(0);
  }
//+------------------------------------------------------------------+
Comments