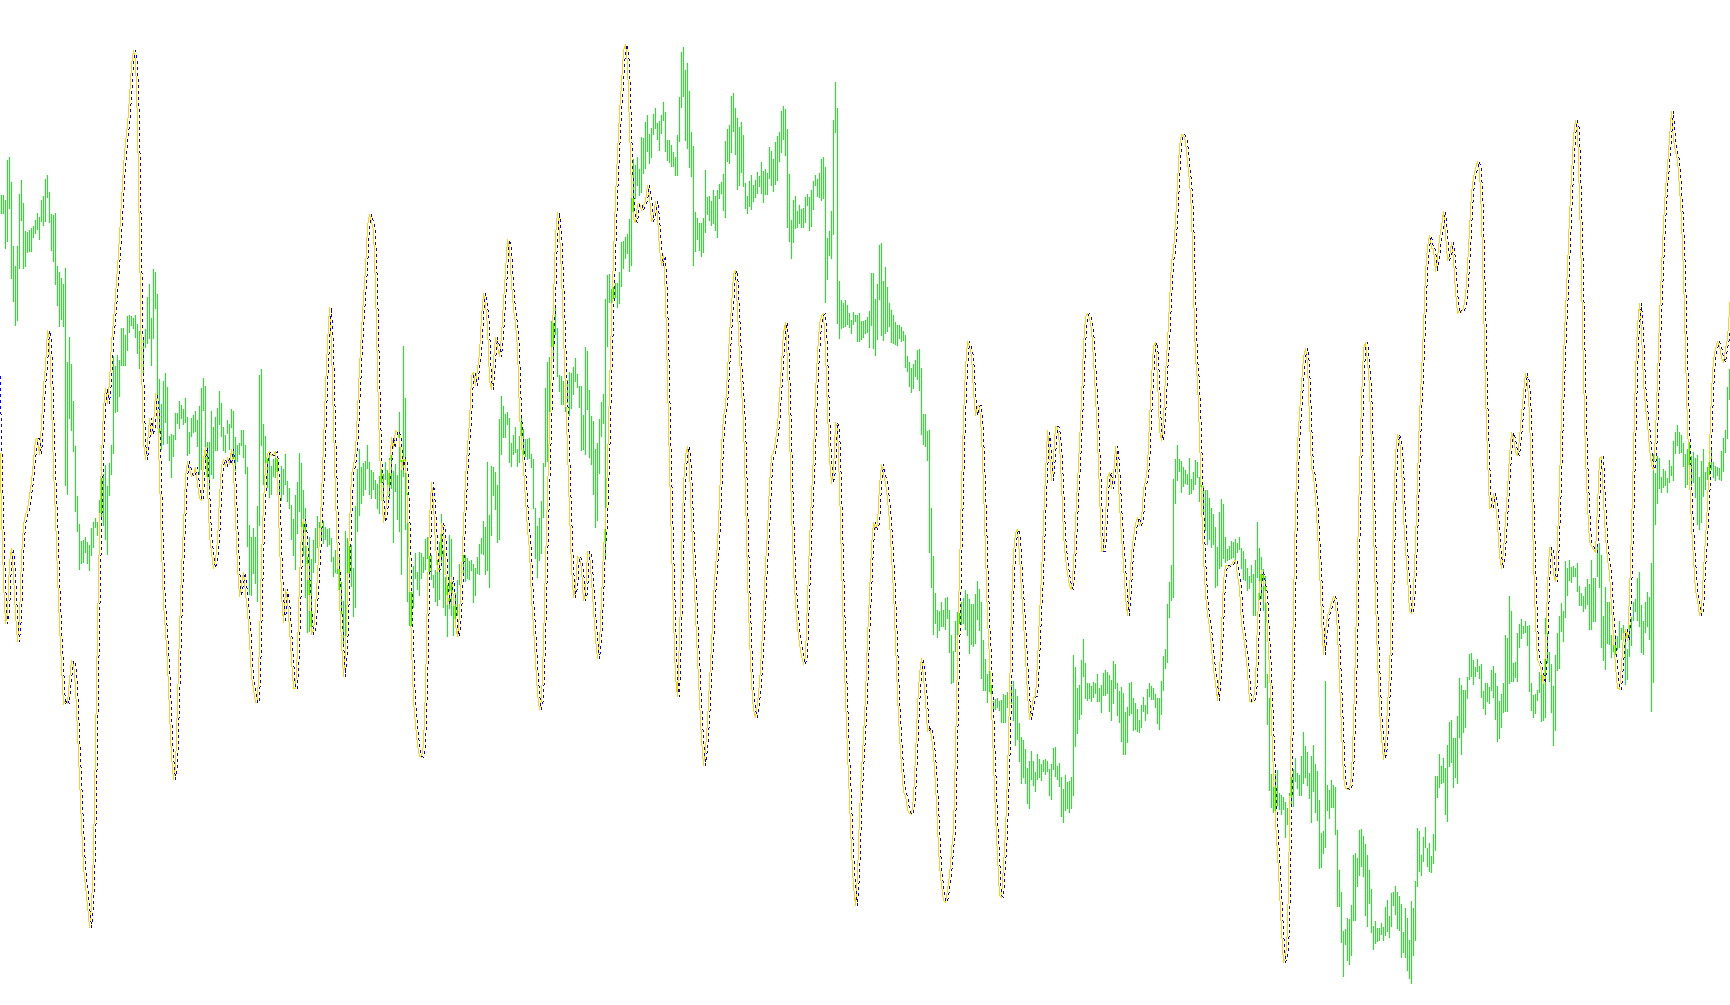
This script is a technical analysis tool designed to help traders visualize price momentum and identify potential trend reversals. It works by processing historical price data to create a smoothed, normalized representation of market movement, making it easier to spot significant changes in trend strength.
Core Logic and Process
The tool operates through a multi-step calculation process that transforms raw market prices into a readable indicator:
1. Identifying Price Boundaries The script first looks at a specific number of recent candles (defined by the "Length" setting) to determine the highest price reached and the lowest price reached during that period. These boundaries establish the local range of the market.
2. Positioning the Current Price It then determines where the current price sits relative to those highs and lows. By comparing the price to its surrounding range, the script calculates a "relative position" percentage. Essentially, it asks: "Where is the price currently located within its recent high-to-low corridor?"
3. Smoothing the Data To prevent the indicator from reacting too wildly to minor, insignificant price fluctuations, the script applies a smoothing technique. It takes the current relative position and blends it with the previous data point. This ensures that the resulting line is fluid and reflects the broader direction of the market rather than "noise."
4. The Transformation (The Fisher Logic) Once the data is smoothed and bounded, the script applies a mathematical transformation. This step converts the data into a format that highlights acceleration and deceleration. Because it uses a logarithmic-style calculation, it helps emphasize when a trend is gaining significant strength or starting to exhaust itself.
5. Final Output Options The tool provides two ways to view this information on your chart:
- Standard Mode: It displays the smoothed trend line, which helps in identifying the prevailing direction of the market.
- Rate of Change (ROCFish): If enabled, the script calculates the speed at which the indicator is moving. Instead of showing the value of the trend itself, it shows how fast that trend is accelerating or decelerating, which can be a useful early warning sign for potential trend shifts.
Summary for the User
In simple terms, this tool takes messy price movements and "irons them out" to show you the underlying momentum. It helps you see whether the market is trending strongly, moving sideways, or beginning to lose steam, providing a clearer picture of the market's "pulse" than raw price action alone.
//+------------------------------------------------------------------+
//|                                              Fisher_org_v1.2.mq4 |
//|                                  Copyright © 2006, Forex-TSD.com |
//|                         Written by IgorAD,igorad2003@yahoo.co.uk |
//|            http://finance.groups.yahoo.com/group/TrendLaboratory |
//+------------------------------------------------------------------+
#property copyright "Copyright © 2006, Forex-TSD.com "
#property link      "http://www.forex-tsd.com/"


#property indicator_separate_window
#property indicator_buffers 2
#property indicator_color1 LightBlue
#property indicator_color2 Tomato
//---- input parameters
extern int Length=10;
extern int Price=4;
extern int NumBars=0;
extern bool ROCFish = false;
//---- buffers
double Buffer[];
double Value [];
double Fisher[];

int init()
  {
  IndicatorBuffers(3);

  SetIndexStyle(0,DRAW_LINE,STYLE_SOLID,1);
  SetIndexStyle(1,DRAW_LINE,STYLE_DOT,1);

  SetIndexBuffer(1,Buffer);
  SetIndexBuffer(0,Fisher);
  SetIndexBuffer(2,Value);

  IndicatorShortName ("FisherTransform(" + Length + "," + Price + ")");
  SetIndexLabel (0, "Fish");
  SetIndexLabel (1, "Trigger");

  SetIndexDrawBegin(0,Length);
  SetIndexDrawBegin(1,Length);

  return(0);
  }


//+------------------------------------------------------------------+
//| Fisher_org_v1                                                         |
//+------------------------------------------------------------------+
int start()
  {
  int shift;

  double smin=0,smax=0,maxfish=-1000000,minfish=1000000;

if (NumBars>0) int NBars=NumBars; else NBars=Bars;

for(shift=NBars;shift>=0;shift--)
   {
   Buffer[shift]=0.0;
   Value [shift]=0.0;
   Fisher[shift]=0.0;
   }

for(shift=NBars-2-Length;shift>=0;shift--)
   {
   smax = High[Highest(NULL,0,MODE_HIGH,Length,shift)];
   smin = Low[Lowest(NULL,0,MODE_LOW,Length,shift)];

   double price = iMA(NULL,0,1,0,0,Price,shift);

   if (smax==smin) smax=smin+Point;

   double wpr=(price-smin)/(smax-smin);

   Value[shift] = 0.33*2*(wpr-0.5) + 0.67*Value[shift+1];

   if (Value[shift]> 0.99) Value[shift]= 0.999;
   if (Value[shift]<-0.99) Value[shift]=-0.999;


   Fisher[shift] = 0.5*MathLog((1.0+Value[shift])/(1.0-Value[shift]))+0.5*Fisher[shift+1];

   if (ROCFish)
   Buffer[shift] = (Fisher[shift]-Fisher [shift+1])*10;
   else Buffer[shift] = Fisher [shift+1];

   }
  return(0);
  }
//+------------------------------------------------------------------+
Comments