Fisher_v1_002
Download script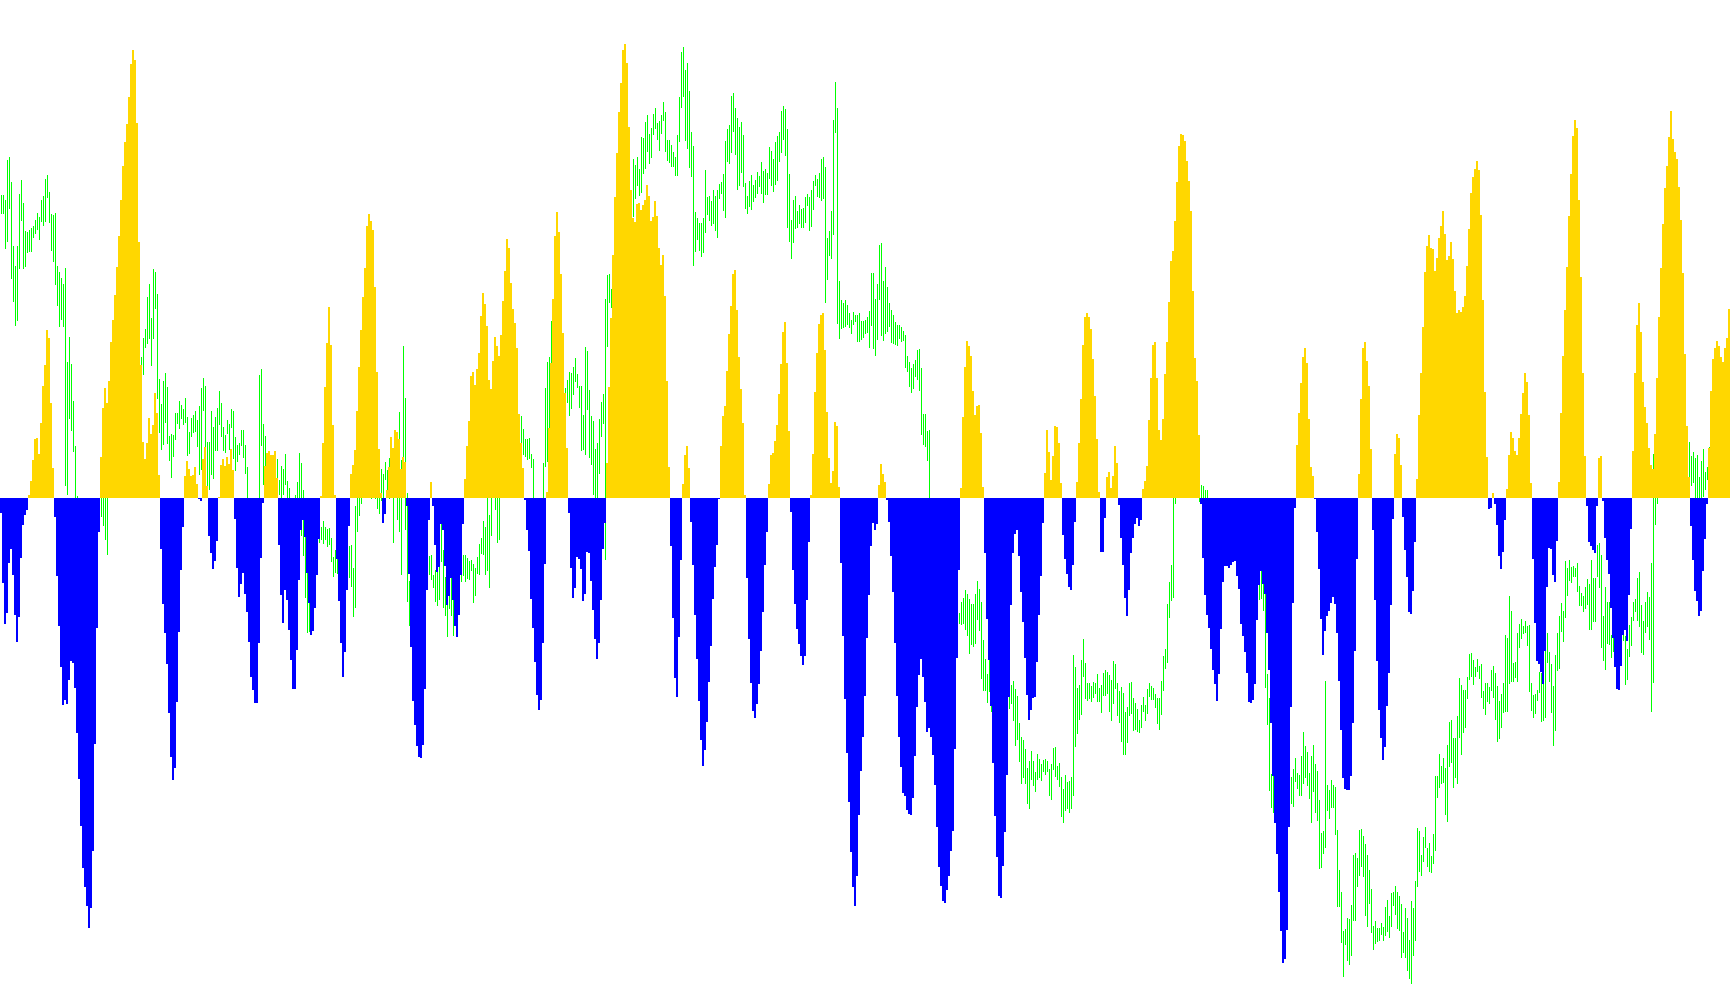
This script is designed to function as a specialized visual tool for financial charting, specifically used to identify momentum and trend directions in market price action. Rather than simply tracking the raw price of an asset, it processes data to create a smooth, oscillating indicator that helps traders distinguish between upward and downward pressure.
Core Mechanics
The logic operates by analyzing the relationship between current market prices and historical extremes over a specific timeframe (defined by the user). It focuses on three primary steps:
- Identifying Price Boundaries: The script looks back at a set number of previous candles to determine the highest high and lowest low reached during that period. This establishes the "trading range" for that window of time.
- Smoothing the Movement: Instead of reacting erratically to every tiny price tick, the script calculates a moving average of the price. It then measures where the current price sits relative to the established boundaries (the high and low). By blending this measurement with the results of the previous calculation, it creates a smoothed "Value" line that reduces market noise.
- Momentum Conversion: The logic applies a mathematical transformation (logarithmic scaling) to this smooth value. This translates the price data into a momentum oscillator. This specific calculation helps accentuate shifts in trend intensity, making it easier to see when the market is gaining strength or losing steam.
Visual Output
The final result is displayed on a separate window below your main price chart as two distinct histograms:
- Upward Momentum: When the calculated momentum value is positive, the script generates a visual histogram indicating an upward trend.
- Downward Momentum: When the value drops into negative territory, the script shifts the visualization to represent downward pressure.
By isolating these movements into a dedicated visual area, the tool allows you to see whether the market is currently favoring buyers or sellers, providing a clearer picture of the prevailing trend than raw price action alone might offer.
//+------------------------------------------------------------------+
//|                                                    Fisher_v1.mq4 |
//|                           Copyright © 2005, TrendLaboratory Ltd. |
//|            http://finance.groups.yahoo.com/group/TrendLaboratory |
//|                                       E-mail: igorad2004@list.ru |
//+------------------------------------------------------------------+
#property copyright "Copyright © 2005, TrendLaboratory Ltd."
#property link      "http://finance.groups.yahoo.com/group/TrendLaboratory"

#property indicator_separate_window
#property indicator_buffers 2
#property indicator_color1 LightBlue
#property indicator_color2 Tomato
//---- input parameters
extern int Length=10;
extern int Price=4;
extern int NumBars=0;
//---- buffers
double UpBuffer [];
double DnBuffer [];
double Value [];
double Fisher[];

int init()
  {
  IndicatorBuffers(4);

  SetIndexStyle(0,DRAW_HISTOGRAM,STYLE_SOLID,2);
  SetIndexStyle(1,DRAW_HISTOGRAM,STYLE_SOLID,2);

  SetIndexBuffer(0,UpBuffer);
  SetIndexBuffer(1,DnBuffer);
  SetIndexBuffer(2,Value);
  SetIndexBuffer(3,Fisher);

  IndicatorShortName ("Fisher(" + Length + "," + Price + ")");
  SetIndexLabel (0, "UpTrend");
  SetIndexLabel (1, "DownTrend");

  SetIndexDrawBegin(0,Length);
  SetIndexDrawBegin(1,Length);

  return(0);
  }


//+------------------------------------------------------------------+
//| Fisher_v1                                                         |
//+------------------------------------------------------------------+
int start()
  {
  int shift;

  double smin=0,smax=0;

if (NumBars>0) int NBars=NumBars; else NBars=Bars;

for(shift=NBars;shift>=0;shift--)
   {
   UpBuffer[shift]=0.0;
   DnBuffer[shift]=0.0;
   Value [shift]=0.0;
   Fisher[shift]=0.0;
   }

for(shift=NBars-1-Length;shift>=0;shift--)
   {
   smax = High[Highest(NULL,0,MODE_HIGH,Length,shift)];
   smin = Low[Lowest(NULL,0,MODE_LOW,Length,shift)];

   double price = iMA(NULL,0,1,0,0,Price,shift);

   Value[shift] = 0.33*2*((price-smin)/(smax-smin)-0.5) + 0.67*Value[shift+1];
   Value[shift] = MathMin(MathMax(Value[shift],-0.999),0.999);
   Fisher[shift] = 0.5*MathLog((1.0+Value[shift])/(1.0-Value[shift]))+0.5*Fisher[shift+1];

   if (Fisher[shift]>=0)
     {
     UpBuffer[shift] = Fisher[shift];
     DnBuffer[shift] = 0.0;
     }
   else
     {
     UpBuffer[shift] = 0.0;
     DnBuffer[shift] = Fisher[shift];
     }
   }
  return(0);
  }
//+------------------------------------------------------------------+
Comments