Golden Finger
Download script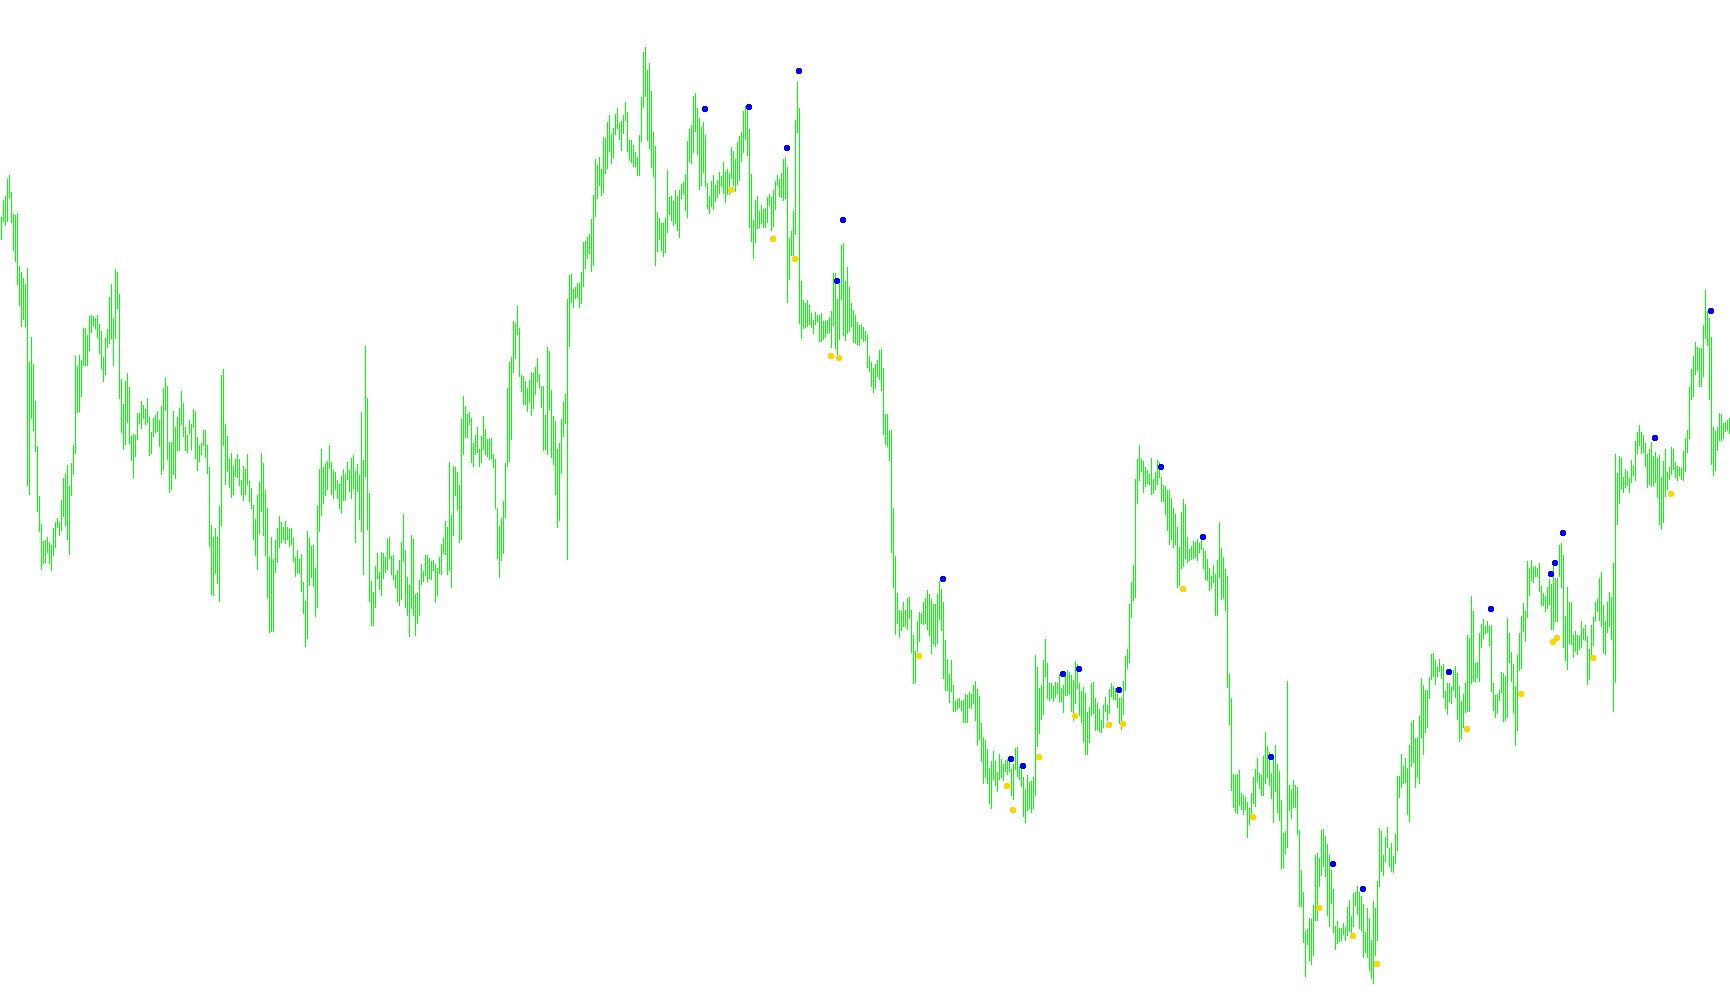
This script is a specialized technical analysis indicator designed for the MetaTrader trading platform. Its primary purpose is to identify specific price action signals—referred to internally as "Golden Finger" signals—to help traders spot potential entry points for buying and selling.
Core Logic Overview
The script operates by analyzing historical price data (highs, lows, opens, and closes) and calculating the volatility of the market over short windows. Instead of relying on a single static metric, it uses a dynamic approach to determine how "fast" or "strong" a price movement is relative to the average range of recent candles.
Key Components of the Analysis
1. Volatility and Momentum Filtering The tool first measures the average range of the last 10 candles to establish a baseline for current market volatility. It then checks for specific types of aggressive movements:
- Gap Analysis: It looks for significant "jumps" between the opening price of a candle and the closing price of the previous one.
- Distance Measurement: It evaluates how far the current price has moved compared to previous price points.
If these conditions are met, the script adjusts its internal "sensitivity" settings. This means the tool becomes more reactive during high-intensity market moves and more conservative during quiet periods.
2. The Oscillator Logic The script utilizes a modified version of the Williams Percent Range (WPR) indicator. This is used to measure whether the price is currently overextended or in a state of momentum. It looks for instances where the price pushes beyond specific "thresholds" (which are automatically adjusted based on your chosen risk settings).
3. Signal Generation (Buy and Sell) The indicator generates visual markers (arrows) on the chart based on two specific scenarios:
- Buy Signals: Triggered when the price shows a significant downward momentum but then crosses back above a high threshold, suggesting a potential reversal to the upside.
- Sell Signals: Triggered when the price shows a strong upward momentum but crosses back below a low threshold, suggesting a potential reversal to the downside.
User Experience Features
- Dynamic Alerting: When the script detects a fresh "Buy" or "Sell" signal on the most recent candles, it provides an immediate pop-up alert on the trading screen.
- Visual Feedback: The tool places distinct arrows on the chart (Aqua for Buys, Gold for Sells) to clearly highlight where the logic has identified a potential turning point.
- Risk Customization: The user can influence the sensitivity of the thresholds via a "RISK" input, which scales the underlying calculations to match different trading styles.
/*
   Generated by EX4-TO-MQ4 decompiler V4.0.224.1 []
   Website: http://purebeam.biz
   E-mail : purebeam@gmail.com
*/
#property copyright "zx815@126.com"
#property link      "zx815@126.com"

#property indicator_chart_window
#property indicator_buffers 2
#property indicator_color1 Aqua
#property indicator_color2 Gold

extern int RISK = 4;
double g_ibuf_80[];
double g_ibuf_84[];
int gi_88 = 0;
int gi_92 = 0;

int init() {
   SetIndexStyle(0, DRAW_ARROW, STYLE_SOLID, 2);
   SetIndexArrow(0, 159);
   SetIndexBuffer(0, g_ibuf_80);
   SetIndexStyle(1, DRAW_ARROW, STYLE_SOLID, 2);
   SetIndexArrow(1, 159);
   SetIndexBuffer(1, g_ibuf_84);
   return (0);
}

int deinit() {
   return (0);
}

int start() {
   double ld_0;
   double ld_8;
   int l_count_16;
   int li_20;
   int li_24;
   int li_28;
   double ld_32;
   double ld_40;
   double ld_48;
   double ld_56;
   double lda_64[500][2];
   double ld_68 = 10;
   double ld_76 = 70;
   double ld_84 = 30;
   int li_92 = IndicatorCounted();
   ld_68 = RISK * 2 + 3;
   ld_76 = RISK + 67;
   ld_84 = 33 - RISK;
   double l_period_96 = ld_68;
   if (li_92 < 0) return (-1);
   if (li_92 > 0) li_92--;
   int li_104 = Bars - li_92 - 1;
   for (int li_108 = li_104; li_108 > 0; li_108--) {
      li_20 = li_108;
      ld_32 = 0;
      ld_40 = 0;
      for (li_20 = li_108; li_20 <= li_108 + 9; li_20++) ld_40 += MathAbs(High[li_20] - Low[li_20]);
      ld_32 = ld_40 / 10.0;
      li_20 = li_108;
      l_count_16 = 0;
      while (li_20 < li_108 + 9 && l_count_16 < 1) {
         if (MathAbs(Open[li_20] - (Close[li_20 + 1])) >= 2.0 * ld_32) l_count_16++;
         li_20++;
      }
      if (l_count_16 >= 1) li_24 = li_20;
      else li_24 = -1;
      li_20 = li_108;
      l_count_16 = 0;
      while (li_20 < li_108 + 6 && l_count_16 < 1) {
         if (MathAbs(Close[li_20 + 3] - Close[li_20]) >= 4.6 * ld_32) l_count_16++;
         li_20++;
      }
      if (l_count_16 >= 1) li_28 = li_20;
      else li_28 = -1;
      if (li_24 > -1) l_period_96 = 3;
      else l_period_96 = ld_68;
      if (li_28 > -1) l_period_96 = 4;
      else l_period_96 = ld_68;
      ld_0 = 100 - MathAbs(iWPR(NULL, 0, l_period_96, li_108));
      lda_64[li_108][0] = li_108;
      lda_64[li_108][1] = ld_0;
      ld_48 = 0;
      ld_56 = 0;
      ld_8 = 0;
      if (ld_0 < ld_84) {
         for (int li_112 = 1; lda_64[li_108 + li_112][1] >= ld_84 && lda_64[li_108 + li_112][1] <= ld_76; li_112++) {
         }
         if (lda_64[li_108 + li_112][1] > ld_76) {
            ld_8 = High[li_108] + ld_32 / 2.0;
            ld_48 = ld_8;
         }
      }
      if (ld_0 > ld_76) {
         for (li_112 = 1; lda_64[li_108 + li_112][1] >= ld_84 && lda_64[li_108 + li_112][1] <= ld_76; li_112++) {
         }
         if (lda_64[li_108 + li_112][1] < ld_84) {
            ld_8 = Low[li_108] - ld_32 / 2.0;
            ld_56 = ld_8;
         }
      }
      if (ld_56 != 0.0 && gi_88 == FALSE) {
         g_ibuf_80[li_108] = ld_56 - 1.0 * Point;
         gi_88 = TRUE;
         gi_92 = FALSE;
         if (li_104 <= 2) Alert(Symbol(), " ", Period(), "M  Golden Finger BUY ");
      }
      if (ld_48 != 0.0 && gi_92 == FALSE) {
         g_ibuf_84[li_108] = ld_48 + 1.0 * Point;
         gi_92 = TRUE;
         gi_88 = FALSE;
         if (li_104 <= 2) Alert(Symbol(), " ", Period(), "M   Golden Finger SELL ");
      }
   }
   return (0);
}
Comments