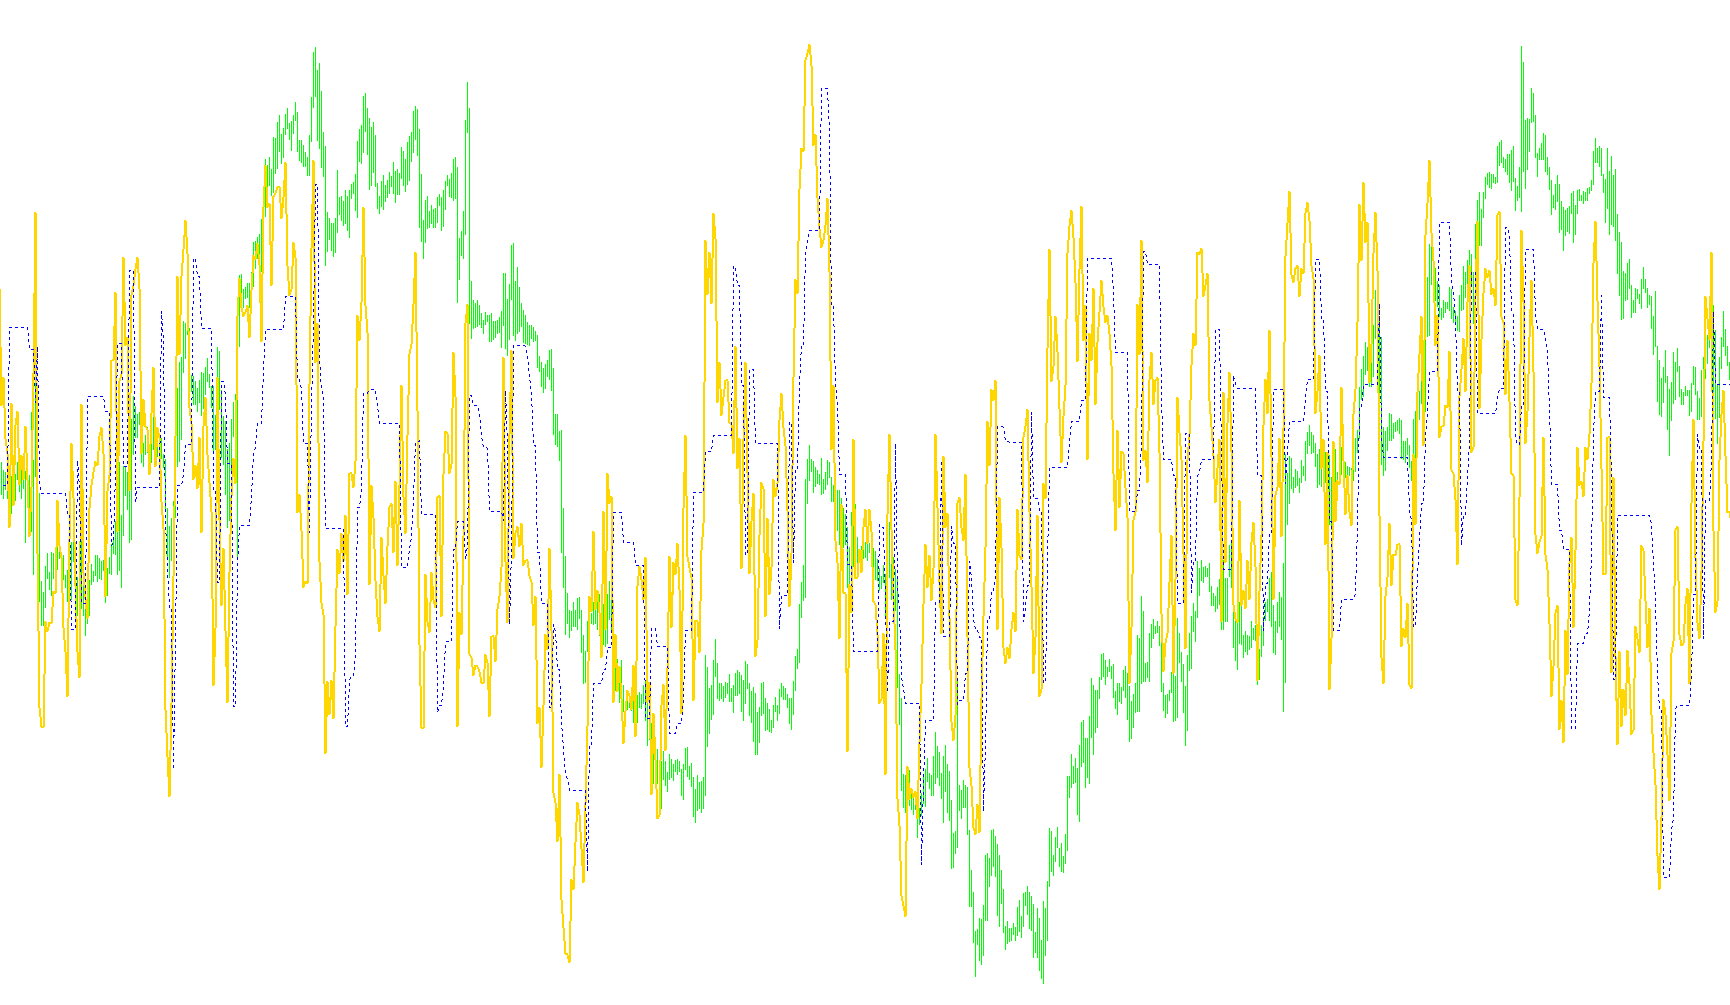
This technical tool, known as the QQE Spec, is designed to help traders identify and visualize market trends by analyzing price momentum. Instead of looking at raw price action alone, this script processes data through several layers of smoothing and mathematical transformations to filter out "market noise" and highlight significant movements.
Here is a breakdown of how the logic works in plain English:
1. Data Foundation (The RSI Core)
The script begins by calculating a Relative Strength Index (RSI). The RSI is a common momentum oscillator that measures the speed and change of price movements. By starting with this, the tool focuses on the strength of the market movement rather than just the price itself.
2. Smoothing the Momentum
To ensure the data isn't too "choppy" or erratic, the script applies an Exponential Moving Average (EMA) to the RSI values. This creates a smoother curve that represents the general direction of momentum.
It then calculates the rate of change—essentially measuring how much that smoothed momentum is moving from one moment to the next. By focusing on this change, the tool can detect when the market is accelerating or decelerating.
3. Trend Filtering and "Noise" Reduction
The script takes that rate of change and applies another layer of smoothing (a longer Exponential Moving Average). This step is crucial because it identifies the significant trends while ignoring minor, insignificant price fluctuations. This allows a trader to see the "big picture" of whether the market is gaining or losing steam.
4. The Trailing Logic (The Visual Signal)
The most unique part of this script is its "trailing" logic. Rather than just drawing a simple line, it uses a calculation that tracks peaks and troughs:
- Trend Tracking: It monitors the movement of the momentum. If the momentum breaks above a certain threshold, the indicator begins to "track" upward.
- Dynamic Adjustments: As the trend moves, the script calculates a buffer (a margin of error). This ensures that the signal doesn't flip-flop back and forth too quickly during minor pullbacks.
- The Visual Result: It creates a dynamic line that follows the price momentum closely but stays stable enough to provide clear visual cues for entries or exits.
Summary for the User
Essentially, this tool acts as a trend-following filter. It takes raw market data, strips away the "jitter" of daily price changes, and produces a smoothed signal that shows you which way the market is actually heading. When the line moves in one direction, it suggests sustained momentum; when it levels off or shifts, it indicates a potential change in the market's strength.
//+------------------------------------------------------------------+
//|                                                     QQE Spec.mq4 |
//|                      Copyright © 2007, MetaQuotes Software Corp. |
//|                                        http://www.metaquotes.net |
//+------------------------------------------------------------------+
#property copyright ""
#property link      "http://www.forex-tsd.com/indicators-metatrader-4/18585-2-qqe-combined-anchored-need-help.html#post264993"

#property indicator_separate_window
#property indicator_levelcolor Black
#property indicator_buffers 2
#property indicator_color1 Blue
#property indicator_color2 Red
#property indicator_width1 2
#property indicator_width2 2
#property indicator_level1 50.0

extern int SF = 1;
extern int RSI_Period = 8;
extern int WP = 3;
int g_period_88;
int gi_92;
double g_ibuf_96[];
double g_ibuf_100[];
double g_ibuf_104[];
double g_ibuf_108[];
double g_ibuf_112[];

int init() {
   g_period_88 = 2 * RSI_Period - 1;
   if (g_period_88 < SF) gi_92 = SF;
   else gi_92 = g_period_88;
   IndicatorBuffers(6);
   SetIndexBuffer(0, g_ibuf_112);
   SetIndexStyle(0, DRAW_LINE, STYLE_SOLID, 2);
   SetIndexLabel(0, "Value 1");
   SetIndexDrawBegin(0, gi_92);
   SetIndexStyle(1, DRAW_LINE, STYLE_DOT);
   SetIndexBuffer(1, g_ibuf_96);
   SetIndexLabel(1, "Value 2");
   SetIndexDrawBegin(1, gi_92);
   SetIndexBuffer(2, g_ibuf_100);
   SetIndexBuffer(3, g_ibuf_104);
   SetIndexBuffer(4, g_ibuf_108);
   IndicatorShortName("QQE Spec");
   return (0);
}

int start() {
   double l_ima_on_arr_8;
   double ld_24;
   double ld_40;
   if (Bars <= gi_92) return (0);
   int li_0 = IndicatorCounted();
   if (li_0 < 1) {
      for (int li_4 = Bars - gi_92; li_4 < Bars; li_4++) {
         g_ibuf_96[li_4] = 0.0;
         g_ibuf_100[li_4] = 0.0;
         g_ibuf_104[li_4] = 0.0;
         g_ibuf_108[li_4] = 0.0;
         g_ibuf_112[li_4] = 0.0;
      }
   }
   li_0 = Bars - li_0 - 1;
   for (li_4 = li_0; li_4 >= 0; li_4--) g_ibuf_108[li_4] = iRSI(NULL, 0, RSI_Period, PRICE_CLOSE, li_4);
   for (li_4 = li_0; li_4 >= 0; li_4--) {
      g_ibuf_112[li_4] = iMAOnArray(g_ibuf_108, 0, SF, 0, MODE_EMA, li_4);
      g_ibuf_100[li_4] = MathAbs(g_ibuf_112[li_4 + 1] - g_ibuf_112[li_4]);
   }
   for (li_4 = li_0; li_4 >= 0; li_4--) g_ibuf_104[li_4] = iMAOnArray(g_ibuf_100, 0, g_period_88, 0, MODE_EMA, li_4);
   li_4 = li_0 + 1;
   double ld_32 = g_ibuf_96[li_4];
   for (double l_ima_on_arr_16 = iMAOnArray(g_ibuf_108, 0, SF, 0, MODE_EMA, li_4); li_4 > 0; l_ima_on_arr_16 = l_ima_on_arr_8) {
      li_4--;
      l_ima_on_arr_8 = iMAOnArray(g_ibuf_108, 0, SF, 0, MODE_EMA, li_4);
      ld_24 = iMAOnArray(g_ibuf_104, 0, g_period_88, 0, MODE_EMA, li_4) * WP;
      ld_40 = ld_32;
      if (l_ima_on_arr_8 < ld_32) {
         ld_32 = l_ima_on_arr_8 + ld_24;
         if (l_ima_on_arr_16 < ld_40)
            if (ld_32 > ld_40) ld_32 = ld_40;
      } else {
         if (l_ima_on_arr_8 > ld_32) {
            ld_32 = l_ima_on_arr_8 - ld_24;
            if (l_ima_on_arr_16 > ld_40)
               if (ld_32 < ld_40) ld_32 = ld_40;
         }
      }
      g_ibuf_96[li_4] = ld_32;
   }
   return (0);
}
Comments