LabTrend2_v1
Download script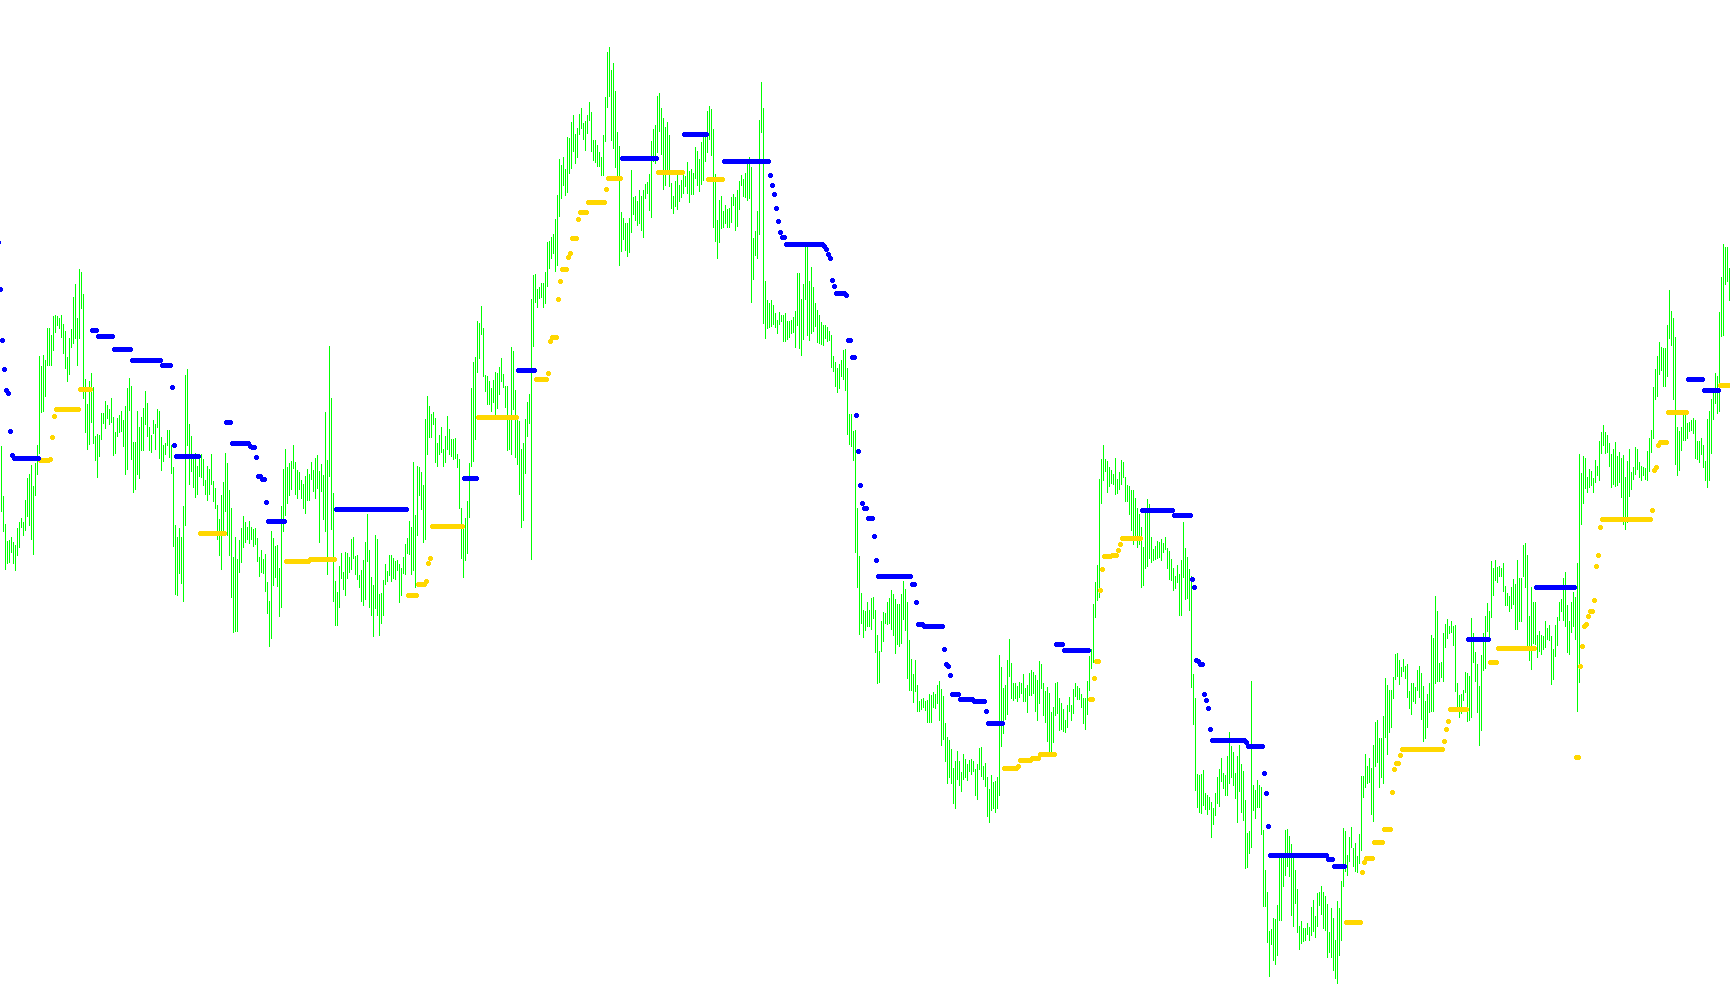
This tool is designed to analyze market trends by identifying potential "stopping points" or key levels where price movement might encounter resistance or exhaustion. Instead of just showing a simple moving average, it calculates dynamic boundaries based on the current volatility and historical price action.
How the Logic Works
1. Volatility Assessment The script begins by looking at the market's recent activity to determine how much the price is "swinging." It measures current volatility and compares it against a longer-term average. If the current volatility is unusually low, the script adjusts its internal calculations to match the average, ensuring that the signals remain consistent even during quiet periods in the market.
2. Trend Identification To determine the direction of the market, the tool uses two different moving averages of varying lengths. By comparing these two averages, the script identifies whether the momentum is currently leaning upward (bullish) or downward (bearish). It specifically looks for a significant enough difference between these averages to confirm a trend before making any calculations.
3. Dynamic Boundary Calculation Once a trend is established, the tool calculates theoretical upper and lower boundaries (maximums and minimums):
- In an Upward Trend: It focuses on identifying a "floor" or support level.
- In a Downward Trend: It focuses on identifying a "ceiling" or resistance level.
These boundaries are not static; they are calculated using a combination of the price's high/low points and the volatility measurement mentioned earlier. This means that during periods of high market activity, the boundaries widen, while in calmer markets, they contract.
4. Smoothing and Safety Offsets The logic includes a "Memory" feature. As it moves backward through time, it checks the previous calculated levels to ensure the boundaries don't jump erratically. It also applies an "Offset Factor," which provides a safety buffer. This ensures that the identified trend levels aren't triggered by minor price fluctuations, but rather by significant movements that respect the market's current breathing room.
5. Visual Output Finally, the script plots these levels on your chart as specific markers. These markers serve as visual cues for potential trend reversals or areas where the price might struggle to move further in its current direction, helping traders visualize "safe" zones or potential turning points based on the prevailing market strength.
//+------------------------------------------------------------------+
//|                                                 LabTrend2_v1.mq4 |
//|                                  Copyright © 2006, Forex-TSD.com |
//|                         Written by IgorAD,igorad2003@yahoo.co.uk |
//|            http://finance.groups.yahoo.com/group/TrendLaboratory |
//+------------------------------------------------------------------+
#property copyright "Copyright © 2006, Forex-TSD.com "
#property link      "http://www.forex-tsd.com/"

#property indicator_chart_window
#property indicator_buffers 2
#property indicator_color1 Chartreuse
#property indicator_color2 Orange
//---- input parameters

extern int    Risk=3;         // Sensivity Factor
extern double MoneyRisk=2.00; // Offset Factor
extern int    BarsNumber=1000;
//---- indicator buffers
double UpTrendBuffer[];
double DownTrendBuffer[];

//+------------------------------------------------------------------+
//| Custom indicator initialization function                         |
//+------------------------------------------------------------------+
  int init()
  {
   string short_name;
//---- indicator line

   SetIndexBuffer(0,UpTrendBuffer);
   SetIndexBuffer(1,DownTrendBuffer);

   SetIndexStyle(0,DRAW_ARROW);
   SetIndexStyle(1,DRAW_ARROW);

   SetIndexArrow(0,159);
   SetIndexArrow(1,159);

   IndicatorDigits(MarketInfo(Symbol(),MODE_DIGITS));
//---- name for DataWindow and indicator subwindow label
   short_name="LabTrend2("+Risk+","+MoneyRisk+")";
   IndicatorShortName(short_name);
   SetIndexLabel(0,"UpTrend Stop");
   SetIndexLabel(1,"DownTrend Stop");
//----
   SetIndexDrawBegin(0,10);
   SetIndexDrawBegin(1,10);
   SetIndexDrawBegin(2,10);
   SetIndexDrawBegin(3,10);
   SetIndexDrawBegin(4,10);
   SetIndexDrawBegin(5,10);
//----
   return(0);
  }

//+------------------------------------------------------------------+
//| LabTrend2_v1                                             |
//+------------------------------------------------------------------+
int start()
  {
   int    i,shift,trend;
   double smax[25000],smin[25000];

   int Nbars=BarsNumber+100;
   int    Length=10;      // Volatility(ATR) Period
   double delta=MathAbs(Bid-Ask)/Point;
   //double delta=3;
   for (shift=Nbars;shift>=0;shift--)
   {
   UpTrendBuffer[shift]=0;
   DownTrendBuffer[shift]=0;
   }

   for (shift=Nbars-Length-101;shift>=0;shift--)
   {
     double Range=iATR(NULL,0,Length,shift);
     double sum=0;
     for (i=1;i<=100;i++) sum+=iATR(NULL,0,Length,shift+i);
     double AvgRange=sum/100.0;
     if (Range<AvgRange) Range=AvgRange;

     smax[shift]=High[shift]+(1.5+0.1*Risk)*Range;
	  smin[shift]=Low[shift]-(1.5+0.1*Risk)*Range;

	  double sma1=iMA(NULL,0,9,0,MODE_SMA,PRICE_CLOSE,shift);
	  double sma2=iMA(NULL,0,18+3*Risk,0,MODE_SMA,PRICE_CLOSE,shift);

	  if (sma1-sma2>delta*Point) trend=1;
	  if (sma2-sma1>delta*Point) trend=-1;

	  if(trend>0)
	  {
	  if(Low[shift]-smin[shift]<MoneyRisk*Range) smin[shift]=Low[shift]-MoneyRisk*Range;
	  if(smin[shift]<smin[shift+1]) smin[shift]=smin[shift+1];
	  }

	  if(trend<0)
	  {
	  if(smax[shift]-High[shift]<MoneyRisk*Range) smax[shift]=High[shift]+MoneyRisk*Range;
	  if(smax[shift]>smax[shift+1]) smax[shift]=smax[shift+1];
	  }

	  if (trend>0)
	  {
	     if (UpTrendBuffer[shift+1]==-1.0)
	     {
	     smin[shift]=Low[shift]-Range;
	     UpTrendBuffer[shift]=smin[shift];
	     }
	     else
	     {
	     UpTrendBuffer[shift]=smin[shift];
	     }
	  DownTrendBuffer[shift]=-1.0;
	  }
	  if (trend<0)
	  {
	  if (DownTrendBuffer[shift+1]==-1.0)
	     {
	     smax[shift]=High[shift]+Range;
	     DownTrendBuffer[shift]=smax[shift];
	     }
	     else
	     {
	     DownTrendBuffer[shift]=smax[shift];
	     }
	  UpTrendBuffer[shift]=-1.0;
	  }

	 }
	return(0);
 }
Comments