RSIFilter_v1_001
Download script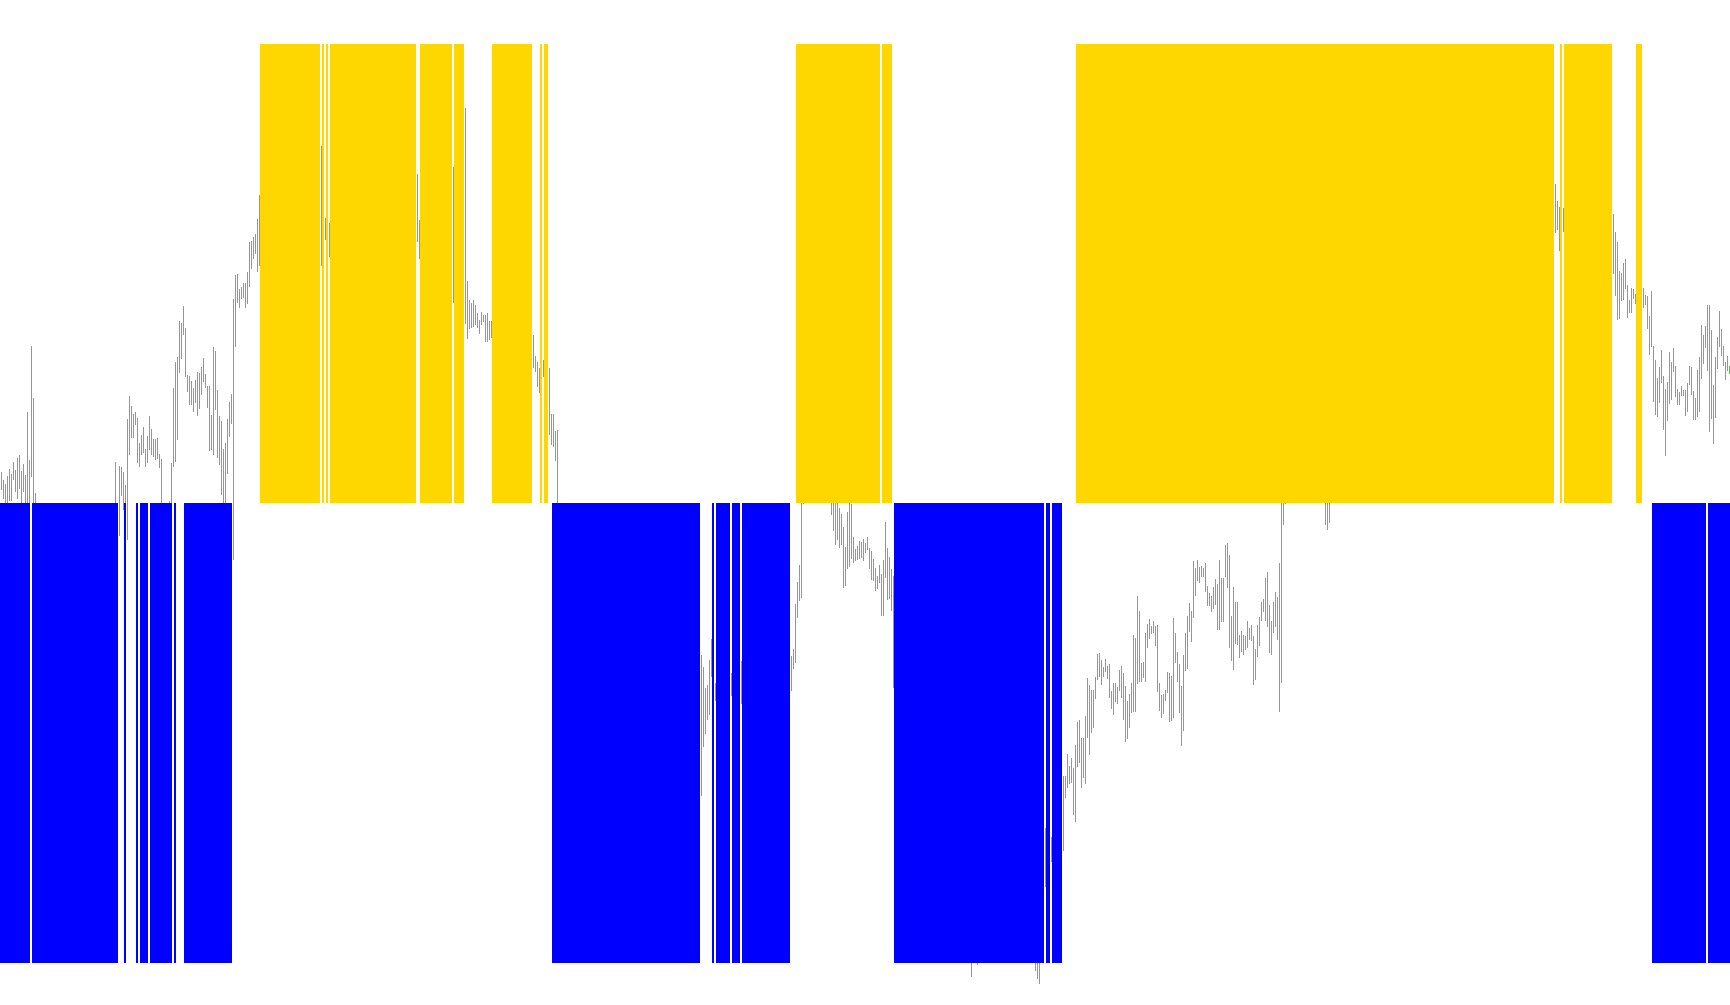
Overview of the RSI Filter Tool
This technical indicator is designed to help traders identify and visualize prevailing market trends by filtering price action through a specialized Relative Strength Index (RSI). Instead of providing a simple momentum reading, this tool translates complex market movements into a clear, visual "UpTrend" or "DownTrend" signal.
How the Logic Works
The tool operates by analyzing the historical momentum of a currency pair or asset over a specific timeframe (the period defined in the settings). It follows a three-step logic process to determine what it displays on your chart:
1. Identifying Extreme Momentum The indicator first looks for "extreme" conditions in the market. It monitors whether the RSI reaches high levels (above 70) or low levels (below 30). These zones act as the primary triggers to determine the underlying direction of the current trend.
2. Establishing Trend Direction Once an extreme is detected, the script assigns a "memory" to the trend:
- If the momentum pushes above the high threshold, it recognizes an Upward Trend.
- If the momentum drops below the low threshold, it recognizes a Downward Trend.
3. Filtering for Visual Clarity To prevent "noise" and ensure you aren't trading against a strong move, the tool applies a secondary filter before drawing anything on your screen:
- For Upward Trends: The indicator will only display a visual signal if the current momentum remains relatively strong (staying above a 40 level). If the strength wanes, the signal disappears.
- For Downward Trends: The indicator will only display a visual signal if the current momentum remains relatively weak (staying below a 60 level). If the momentum spikes too high, the signal disappears.
Visual Presentation
The result is a clean, two-color histogram displayed in a separate window:
- Blue Histograms: Represent confirmed upward trend strength.
- OrangeRed Histograms: Represent confirmed downward trend strength.
By using this logic, the tool helps filter out minor market fluctuations, highlighting only the sustained movements that meet specific strength criteria, making it easier for a trader to see the "big picture" of the current market direction.
//+------------------------------------------------------------------+
//|                                                 RSIFilter_v1.mq4 |
//|                                  Copyright © 2006, Forex-TSD.com |
//|                         Written by IgorAD,igorad2003@yahoo.co.uk |
//|            http://finance.groups.yahoo.com/group/TrendLaboratory |
//+------------------------------------------------------------------+
#property copyright "Copyright © 2006, Forex-TSD.com "
#property link      "http://www.forex-tsd.com/"

#property indicator_separate_window
#property indicator_minimum -2
#property indicator_maximum 2
#property indicator_buffers 2
#property indicator_color1 Blue
#property indicator_color2 OrangeRed

//---- input parameters
extern int PeriodRSI=14;
//---- indicator buffers
double UpBuffer[];
double DnBuffer[];
//+------------------------------------------------------------------+
//| Custom indicator initialization function                         |
//+------------------------------------------------------------------+
  int init()
  {
   string short_name;
//---- indicator line
   SetIndexStyle(0,DRAW_HISTOGRAM,STYLE_SOLID,2);
   SetIndexStyle(1,DRAW_HISTOGRAM,STYLE_SOLID,2);
   SetIndexBuffer(0,UpBuffer);
   SetIndexBuffer(1,DnBuffer);
   IndicatorDigits(MarketInfo(Symbol(),MODE_DIGITS));
//---- name for DataWindow and indicator subwindow label
   short_name="RSI Filter("+PeriodRSI+")";
   IndicatorShortName(short_name);
   SetIndexLabel(0,"UpTrend");
   SetIndexLabel(1,"DownTrend");
//----
   SetIndexDrawBegin(0,PeriodRSI);
   SetIndexDrawBegin(1,PeriodRSI);
//----
   return(0);
  }

//+------------------------------------------------------------------+
//| RSIFilter_v1                                                         |
//+------------------------------------------------------------------+
int start()
  {
   int shift,trend;
   double RSI0;


   for(shift=Bars-PeriodRSI-1;shift>=0;shift--)
   {
   RSI0=iRSI(NULL,0,PeriodRSI,PRICE_CLOSE,shift);

	  if (RSI0>70)  trend=1;
	  if (RSI0<30)  trend=-1;

	  if (trend>0)
	  {
	  if (RSI0 > 40) UpBuffer[shift]=1.0;
	  else UpBuffer[shift] = EMPTY_VALUE;
	  DnBuffer[shift]=0;
	  }
	  if (trend<0)
	  {
	  if (RSI0 < 60) DnBuffer[shift]=-1.0;
	  else DnBuffer[shift] = EMPTY_VALUE;
	  UpBuffer[shift]=0;
	  }
	}
	return(0);
 }
Comments