RSIFilter_v1_v1
Download script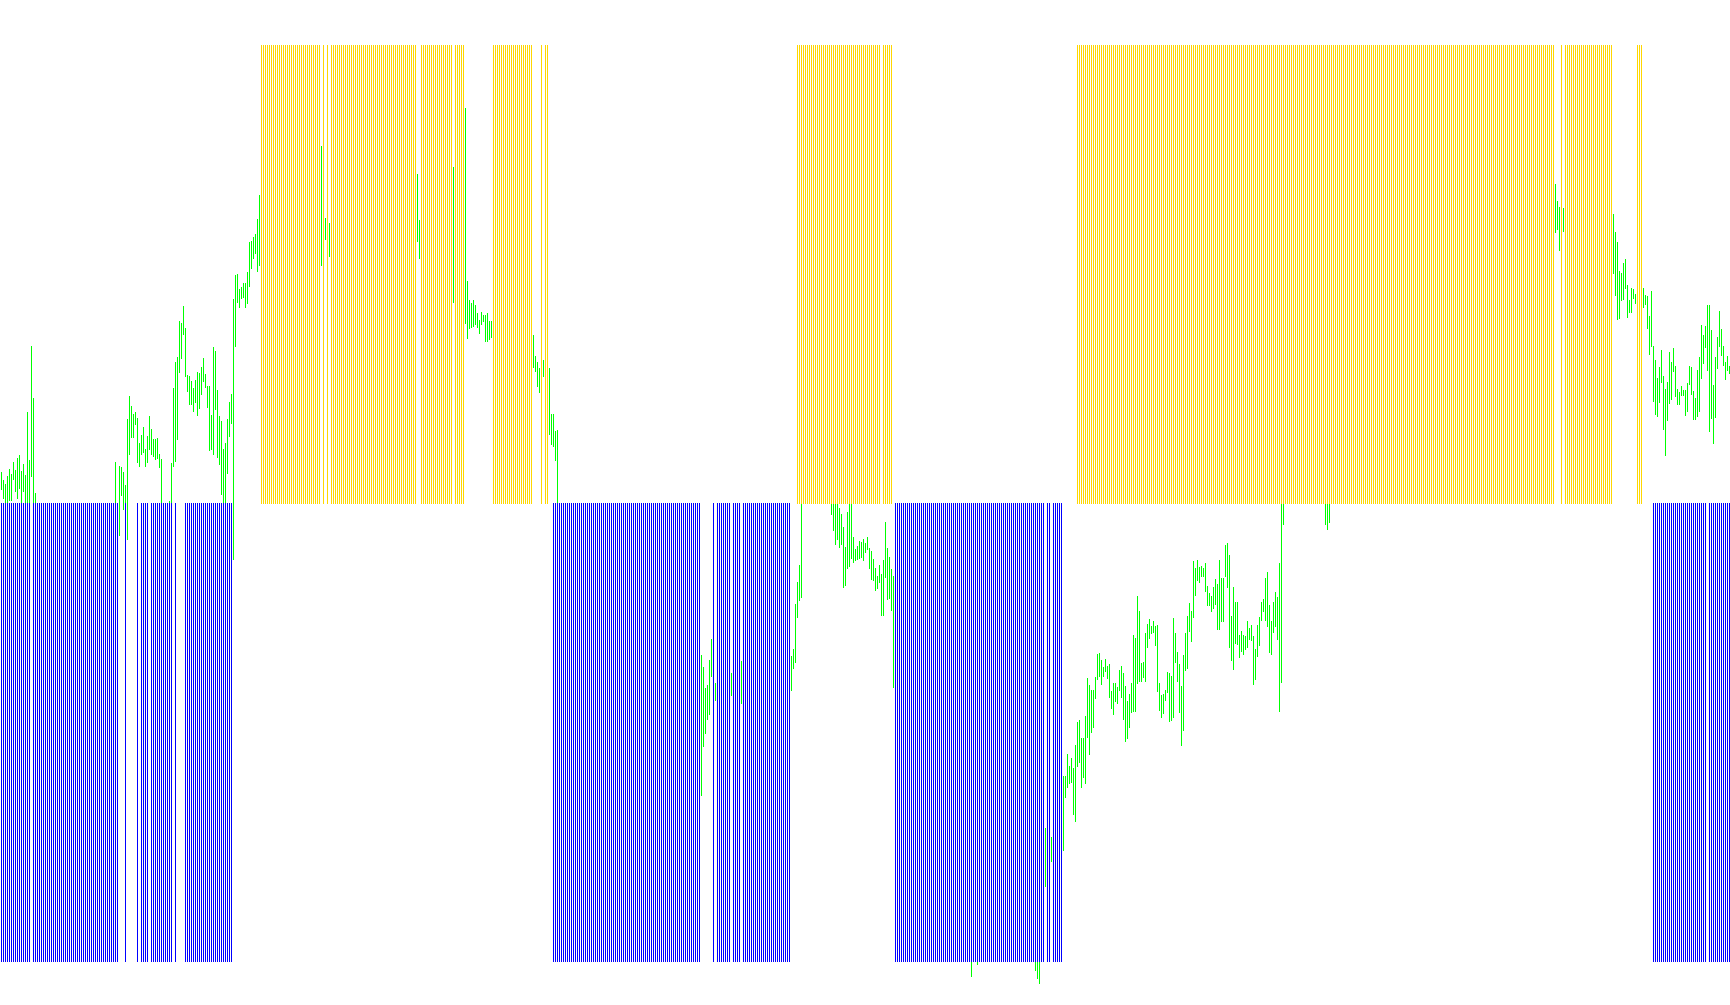
This tool is designed as a visual trend filter for the MetaTrader platform, specifically built to help traders identify market momentum and potential reversal zones using the Relative Strength Index (RSI). Instead of just showing you a raw line of numbers, this script interprets RSI data to highlight specific "Up" and "Down" trends on your chart.
How the Logic Works
The core purpose of this script is to filter out "market noise" and clearly illustrate which direction the market is leaning based on two main criteria: extreme momentum thresholds and a secondary confirmation zone.
1. Identifying Market Extremes The script constantly monitors the RSI value (a standard momentum indicator). It looks for two specific triggers:
- Overbought territory: When the RSI rises above 70, it flags a potential "Up" trend.
- Oversold territory: When the RSI falls below 30, it flags a potential "Down" trend.
2. Trend Confirmation and Filtering Unlike a standard RSI which can be erratic, this script adds a layer of logic to ensure the trend is sustained before displaying it visually:
- For Upward Trends: Once an upward trend is triggered (RSI > 70), the script only shows a visual "Up" signal if the RSI remains above a secondary floor of 40. This ensures that you aren't viewing "fake" signals during brief moments of weakness.
- For Downward Trends: Once a downward trend is triggered (RSI < 30), the script only shows a visual "Down" signal if the RSI remains below a secondary ceiling of 60. Similarly, this confirms that the downward momentum is still dominant enough to be relevant.
Visual Representation
The tool translates these calculations into two distinct colored histograms:
- SkyBlue Histogram: Represents confirmed upward momentum.
- Orange Histogram: Represents confirmed downward momentum.
By using this logic, the script simplifies complex technical data into a clear visual guide. It helps traders see where the market is showing strong enough persistence to move in a specific direction, while filtering out the fluctuations that occur when the market is moving sideways or lacks clear conviction.
//+------------------------------------------------------------------+
//|                                                 RSIFilter_v1.mq4 |
//|                                  Copyright © 2006, Forex-TSD.com |
//|                         Written by IgorAD,igorad2003@yahoo.co.uk |
//|            http://finance.groups.yahoo.com/group/TrendLaboratory |
//+------------------------------------------------------------------+
#property copyright "Copyright © 2006, Forex-TSD.com "
#property link      "http://www.forex-tsd.com/"

#property indicator_separate_window
#property indicator_minimum -2
#property indicator_maximum 2
#property indicator_buffers 2
#property indicator_color1 SkyBlue
#property indicator_color2 Orange

//---- input parameters
extern int PeriodRSI=14;
//---- indicator buffers
double UpBuffer[];
double DnBuffer[];
//+------------------------------------------------------------------+
//| Custom indicator initialization function                         |
//+------------------------------------------------------------------+
  int init()
  {
   string short_name;
//---- indicator line
   SetIndexStyle(0,DRAW_HISTOGRAM,STYLE_SOLID,1);
   SetIndexStyle(1,DRAW_HISTOGRAM,STYLE_SOLID,1);
   SetIndexBuffer(0,UpBuffer);
   SetIndexBuffer(1,DnBuffer);
   IndicatorDigits(MarketInfo(Symbol(),MODE_DIGITS));
//---- name for DataWindow and indicator subwindow label
   short_name="RSI Filter("+PeriodRSI+")";
   IndicatorShortName(short_name);
   SetIndexLabel(0,"UpTrend");
   SetIndexLabel(1,"DownTrend");
//----
   SetIndexDrawBegin(0,PeriodRSI);
   SetIndexDrawBegin(1,PeriodRSI);
//----
   return(0);
  }

//+------------------------------------------------------------------+
//| RSIFilter_v1                                                         |
//+------------------------------------------------------------------+
int start()
  {
   int shift,trend;
   double RSI0;


   for(shift=Bars-PeriodRSI-1;shift>=0;shift--)
   {
   RSI0=iRSI(NULL,0,PeriodRSI,PRICE_CLOSE,shift);

	  if (RSI0>70)  trend=1;
	  if (RSI0<30)  trend=-1;

	  if (trend>0)
	  {
	  if (RSI0 > 40) UpBuffer[shift]=1.0;
	  else UpBuffer[shift] = EMPTY_VALUE;
	  DnBuffer[shift]=0;
	  }
	  if (trend<0)
	  {
	  if (RSI0 < 60) DnBuffer[shift]=-1.0;
	  else DnBuffer[shift] = EMPTY_VALUE;
	  UpBuffer[shift]=0;
	  }
	}
	return(0);
 }
Comments