RSIFilter_v1_v2
Download script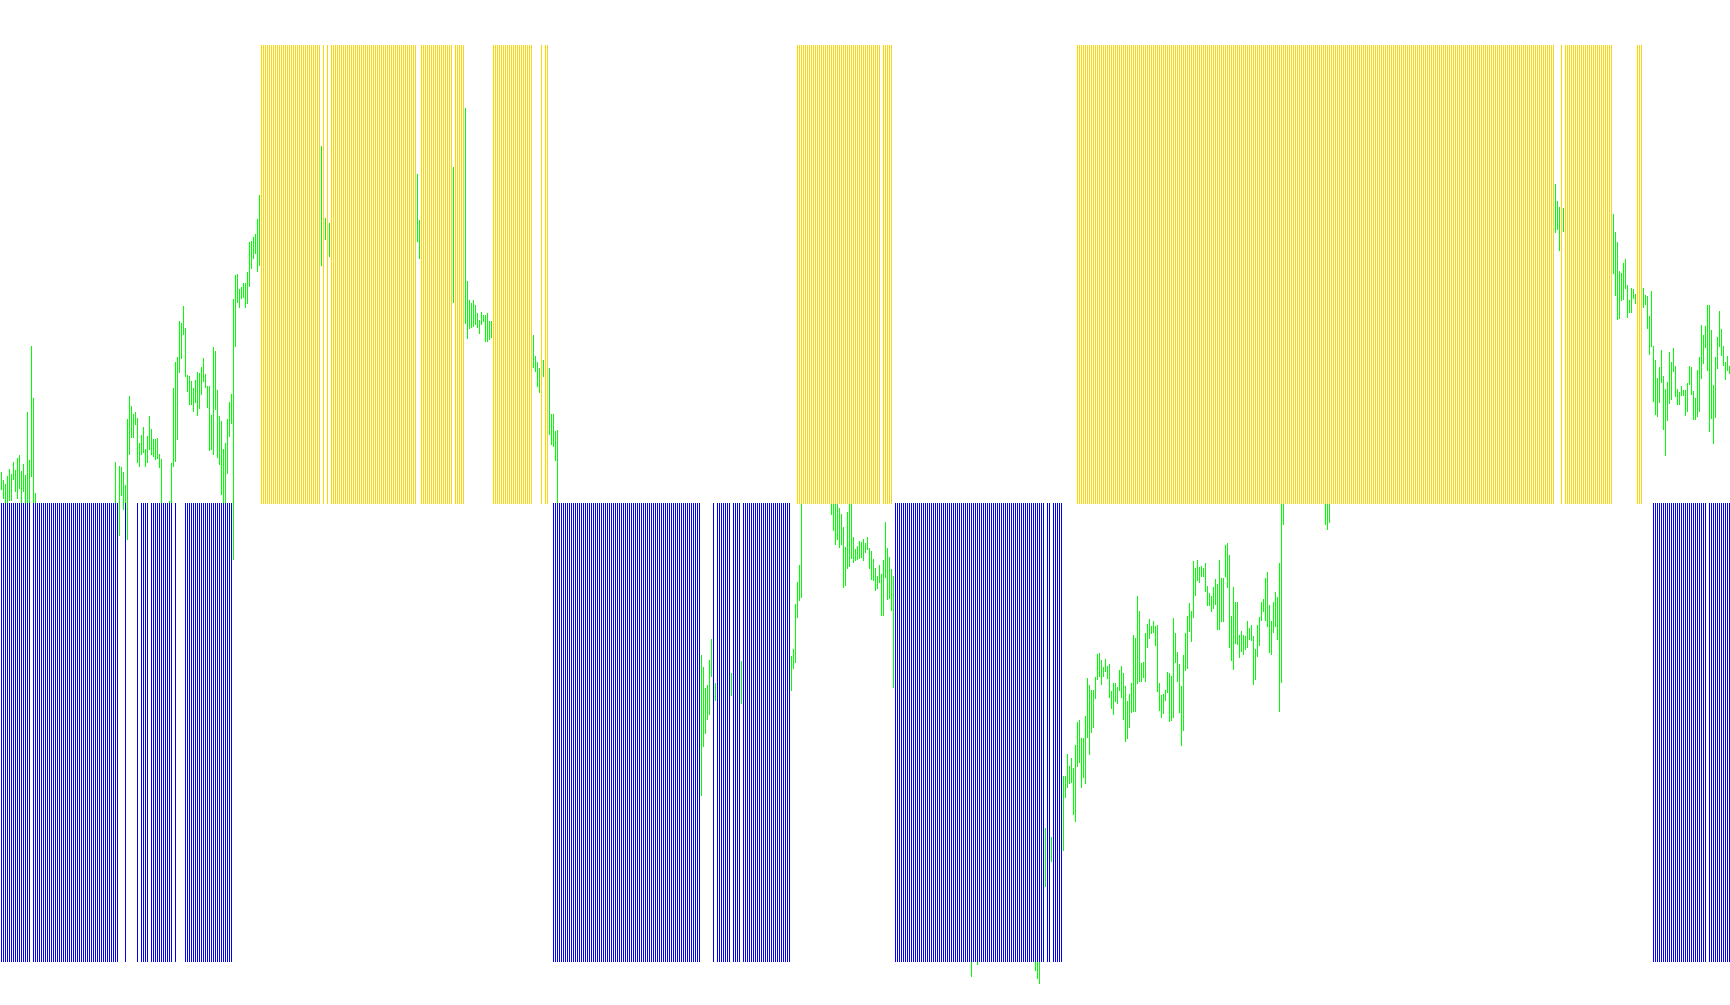
This tool is designed to help traders visualize market momentum by acting as a specialized filter for the Relative Strength Index (RSI). Instead of showing the standard RSI value, this script translates technical data into clear visual signals that highlight whether the market is currently exhibiting an "Up" or "Down" trend based on specific price velocity thresholds.
How the Logic Works
The script operates by monitoring price movements over a set number of periods (defaulting to 14). It analyzes these movements to determine the underlying momentum and then categorizes the market into three states:
1. Identifying Trend Direction The tool first looks for "extremes" to establish the primary direction of the market:
- If the momentum reaches a high level (above 70), the script identifies an Upward Trend.
- If the momentum drops to a low level (below 30), the script identifies a Downward Trend.
2. Filtering the Signal Once a trend is established, the tool applies a secondary filter to ensure the signal remains valid. It doesn't just react to the extreme highs or lows; it validates the strength of that move:
- In an Upward Trend: The tool will only display a positive signal if the momentum remains relatively strong (staying above a level of 40). If the momentum weakens significantly during this phase, the signal is hidden.
- In a Downward Trend: The tool will only display a negative signal if the momentum remains sufficiently weak (staying below a level of 60). If the momentum begins to recover too much, the signal is removed.
Visual Representation
The result is a clean, visual histogram displayed in a separate window:
- Upward Signals: Represented by an orange histogram, showing active strength in the upward direction.
- Downward Signals: Represented by a sky-blue histogram, showing active strength in the downward direction.
By filtering out "noisy" price action and only displaying signals when specific momentum criteria are met, this tool helps traders stay aligned with the prevailing market direction while ignoring minor fluctuations that might otherwise lead to false interpretations.
//+------------------------------------------------------------------+
//|                                                 RSIFilter_v1.mq4 |
//|                                  Copyright © 2006, Forex-TSD.com |
//|                         Written by IgorAD,igorad2003@yahoo.co.uk |
//|            http://finance.groups.yahoo.com/group/TrendLaboratory |
//+------------------------------------------------------------------+
#property copyright "Copyright © 2006, Forex-TSD.com "
#property link      "http://www.forex-tsd.com/"

#property indicator_separate_window
#property indicator_minimum -2
#property indicator_maximum 2
#property indicator_buffers 2
#property indicator_color1 Orange
#property indicator_color2 SkyBlue
//---- input parameters
extern int PeriodRSI=14;
//---- indicator buffers
double UpBuffer[];
double DnBuffer[];
//+------------------------------------------------------------------+
//| Custom indicator initialization function                         |
//+------------------------------------------------------------------+
  int init()
  {
   string short_name;
//---- indicator line
   SetIndexStyle(0,DRAW_HISTOGRAM,STYLE_SOLID,1);
   SetIndexStyle(1,DRAW_HISTOGRAM,STYLE_SOLID,1);
   SetIndexBuffer(0,UpBuffer);
   SetIndexBuffer(1,DnBuffer);
   IndicatorDigits(MarketInfo(Symbol(),MODE_DIGITS));
//---- name for DataWindow and indicator subwindow label
   short_name="RSI Filter("+PeriodRSI+")";
   IndicatorShortName(short_name);
   SetIndexLabel(0,"UpTrend");
   SetIndexLabel(1,"DownTrend");
//----
   SetIndexDrawBegin(0,PeriodRSI);
   SetIndexDrawBegin(1,PeriodRSI);
//----
   return(0);
  }

//+------------------------------------------------------------------+
//| RSIFilter_v1                                                         |
//+------------------------------------------------------------------+
int start()
  {
   int shift,trend;
   double RSI0;


   for(shift=Bars-PeriodRSI-1;shift>=0;shift--)
   {
   RSI0=iRSI(NULL,0,PeriodRSI,PRICE_CLOSE,shift);

	  if (RSI0>70)  trend=1;
	  if (RSI0<30)  trend=-1;

	  if (trend>0)
	  {
	  if (RSI0 > 40) UpBuffer[shift]=1.0;
	  else UpBuffer[shift] = EMPTY_VALUE;
	  DnBuffer[shift]=0;
	  }
	  if (trend<0)
	  {
	  if (RSI0 < 60) DnBuffer[shift]=-1.0;
	  else DnBuffer[shift] = EMPTY_VALUE;
	  UpBuffer[shift]=0;
	  }
	}
	return(0);
 }
Comments