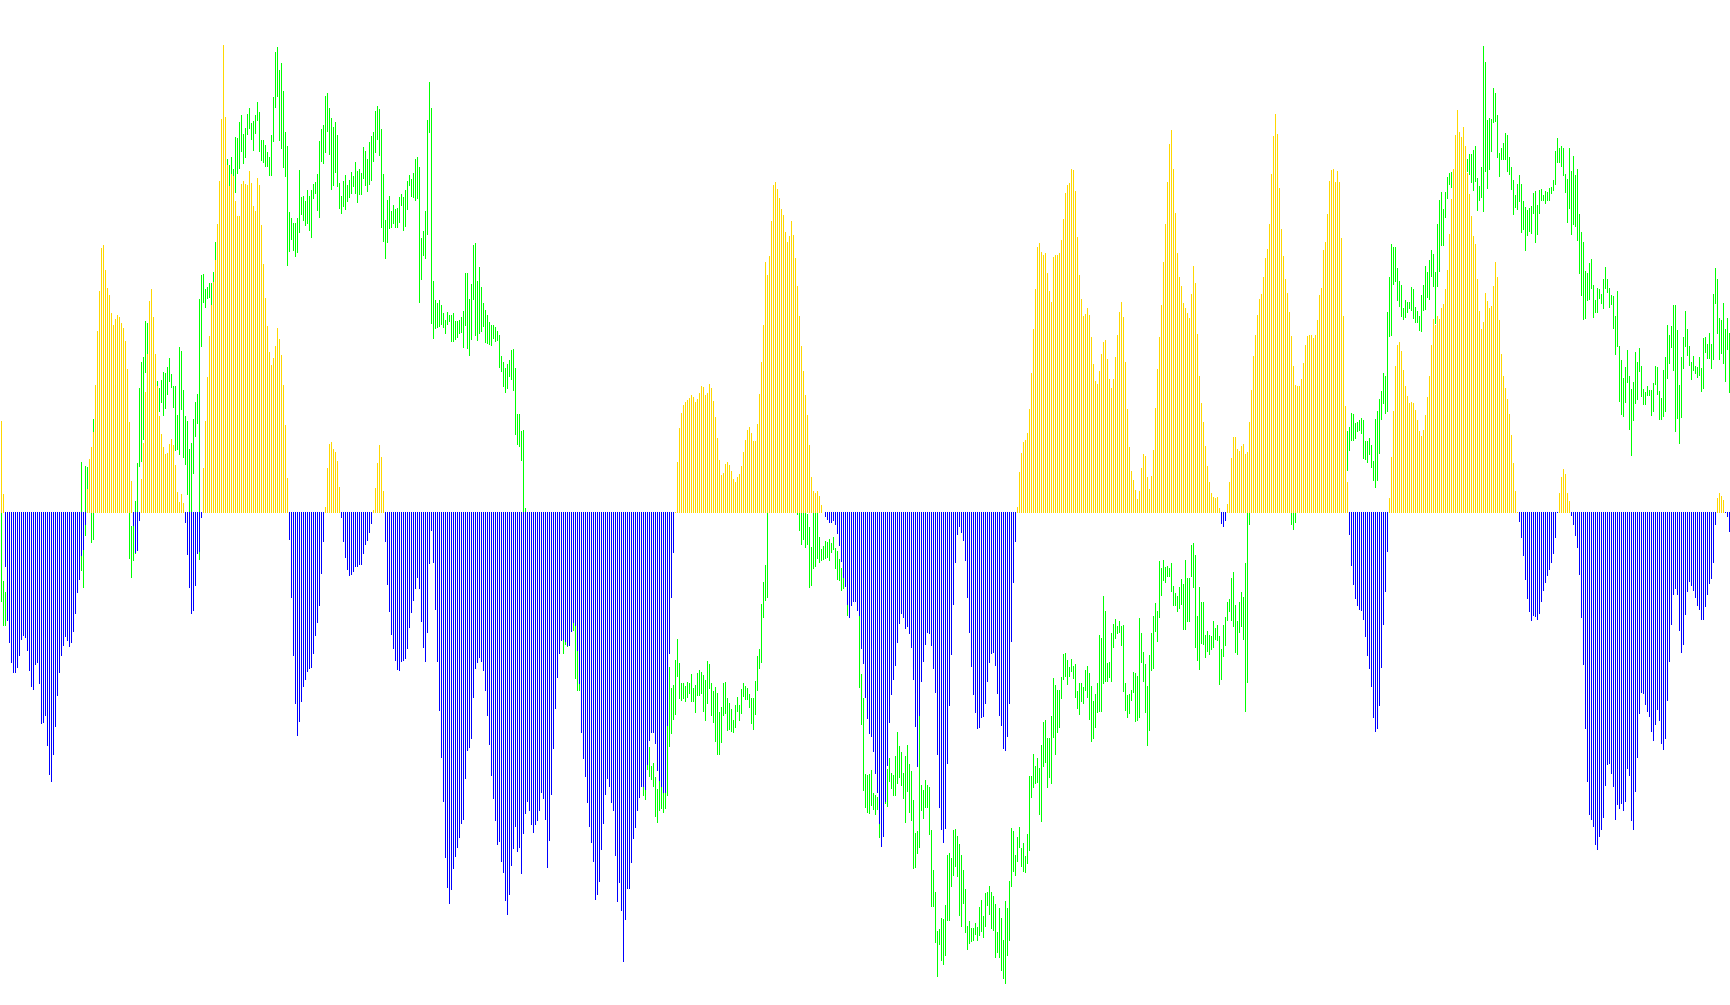
The StepFisher v2 is a sophisticated technical analysis tool designed to help traders identify market trends and momentum by smoothing out price fluctuations. Unlike standard indicators that might react too quickly to "noise" or move too slowly to capture significant shifts, this script combines several mathematical layers to provide a clearer picture of where the market is heading.
Core Logic & Methodology
The indicator functions through a multi-stage process to translate raw price action into a visual trend signal:
1. Dynamic Volatility Measurement The tool begins by calculating the current market volatility using an Average True Range (ATR). By establishing this baseline, the script can determine a "Step Size." This ensures that the indicator adapts to different market conditions—expanding its sensitivity during high-volatility periods and tightening during calmer markets.
2. Trend Identification via Price Breaks The script establishes upper and lower boundaries based on current price levels and the volatility steps. It looks for specific "breakouts":
- If the price climbs above a certain threshold, it identifies an upward trend.
- If the price falls below a corresponding floor, it identifies a downward trend. The logic ensures that these boundaries are respected consistently, preventing the indicator from switching directions prematurely due to minor price ticks.
3. Normalized Value Calculation Once a trend is established, the tool calculates a relative position (a "Sto" value). This measures where the current price sits between the upper and lower boundaries. It then applies a weighted smoothing technique:
- It blends the current relative position with the previous data point.
- This prevents jagged movements and creates a fluid transition, allowing the indicator to stay steady while the trend is healthy but reacting clearly when a real shift occurs.
4. Logarithmic Smoothing (The Fisher Transform) The final stage applies a mathematical transformation known as a Fisher Transform. This specific calculation is used to convert price values into a format that makes it easier to identify "overextended" movements and trends. It effectively compresses the data so that significant changes appear more distinct.
Visual Representation
The results are displayed in a separate window on your chart:
- Upward Momentum: When the final calculation is positive, the indicator displays as a light blue histogram above the zero line.
- Downward Momentum: When the final calculation is negative, it displays as an orange histogram below the zero line.
By combining volatility-based boundaries with smoothed logarithmic transformations, the StepFisher v2 aims to filter out market "noise," providing traders with a cleaner, more reliable visualization of the prevailing trend.
//+------------------------------------------------------------------+
//|                                                StepFisher_v2.mq4 |
//|                           Copyright © 2006, TrendLaboratory Ltd. |
//|            http://finance.groups.yahoo.com/group/TrendLaboratory |
//|                                       E-mail: igorad2004@list.ru |
//+------------------------------------------------------------------+
#property copyright "Copyright © 2005, TrendLaboratory Ltd."
#property link      "http://finance.groups.yahoo.com/group/TrendLaboratory"

#property indicator_separate_window
#property indicator_buffers 2
#property indicator_color1 LightBlue
#property indicator_color2 Orange
//---- input parameters
extern int    Length=10;
extern int    Price=4;
extern double Kv=1.0;
extern int    NumBars=0;
//---- indicator buffers
double UpBuffer[];
double DnBuffer[];
double Fisher[];
double Value[];
double smax[];
double smin[];
//+------------------------------------------------------------------+
//| Custom indicator initialization function                         |
//+------------------------------------------------------------------+
  int init()
  {
   string short_name;
//---- indicator line
   IndicatorBuffers(6);
   SetIndexStyle(0,DRAW_HISTOGRAM,STYLE_SOLID,1);
   SetIndexStyle(1,DRAW_HISTOGRAM,STYLE_SOLID,1);
   SetIndexBuffer(0,UpBuffer);
   SetIndexBuffer(1,DnBuffer);
   SetIndexBuffer(2,Fisher);
   SetIndexBuffer(3,Value);
   SetIndexBuffer(4,smax);
   SetIndexBuffer(5,smin);

   IndicatorDigits(MarketInfo(Symbol(),MODE_DIGITS));
//---- name for DataWindow and indicator subwindow label
   short_name="StepFisher v2("+Length+","+Price+","+Kv+")";
   IndicatorShortName(short_name);
   SetIndexLabel(0,"UpTrend");
   SetIndexLabel(1,"DownTrend");
//----
   SetIndexDrawBegin(0,Length);
   SetIndexDrawBegin(1,Length);
//----
   return(0);
  }

//+------------------------------------------------------------------+
//| StepFisher_v2                                                       |
//+------------------------------------------------------------------+
int start()
  {
   int      shift,trend;
   double   ATR0,ATRmax=-10000000;
   double   line,bsmin,bsmax;

   if (NumBars>0) int NBars=NumBars; else NBars=Bars;

   for(shift=NBars;shift>=0;shift--)
   {
   UpBuffer[shift]=0.0;
   DnBuffer[shift]=0.0;
   smax[shift]=0.0;
   smin[shift]=0.0;
   Value [shift]=0.0;
   Fisher[shift]=0.0;
   }

   for(shift=NBars-1-Length;shift>=0;shift--)
   {
	ATR0 = iATR(NULL,0,Length,shift);

	ATRmax=MathMax(ATR0,ATRmax);

	double StepSize=(Kv*ATRmax);

	  smax[shift]=Close[shift]+2*StepSize;
	  smin[shift]=Close[shift]-2*StepSize;

	  if(Close[shift]>smax[shift+1]) trend=1;
	  if(Close[shift]<smin[shift+1]) trend=-1;

	  if(trend>0)
	  {
	  if(smin[shift]<smin[shift+1]) smin[shift]=smin[shift+1];
	  line=smin[shift]+StepSize;
	  }
	  if(trend<0)
	  {
	  if(smax[shift]>smax[shift+1]) smax[shift]=smax[shift+1];
	  line=smax[shift]-StepSize;
	  }

	  bsmin=line-StepSize;
	  bsmax=line+StepSize;

	  double price = iMA(NULL,0,1,0,0,Price,shift);
     if (bsmax==bsmin) bsmax=bsmin+0.0001;

     double sto=(price-bsmin)/(bsmax-bsmin);

     Value[shift] = 0.33*2*(sto-0.5) + 0.67*Value[shift+1];

     if (Value[shift]> 0.99) Value[shift]= 0.999;
     if (Value[shift]<-0.99) Value[shift]=-0.999;

     Fisher[shift] = 0.5*MathLog((1.0+Value[shift])/(1.0-Value[shift]))+0.5*Fisher[shift+1];

   if (Fisher[shift]>=0)
     {
     UpBuffer[shift] = Fisher[shift];
     DnBuffer[shift] = 0.0;
     }
   else
     {
     UpBuffer[shift] = 0.0;
     DnBuffer[shift] = Fisher[shift];
     }

	 }
	return(0);
 }
Comments