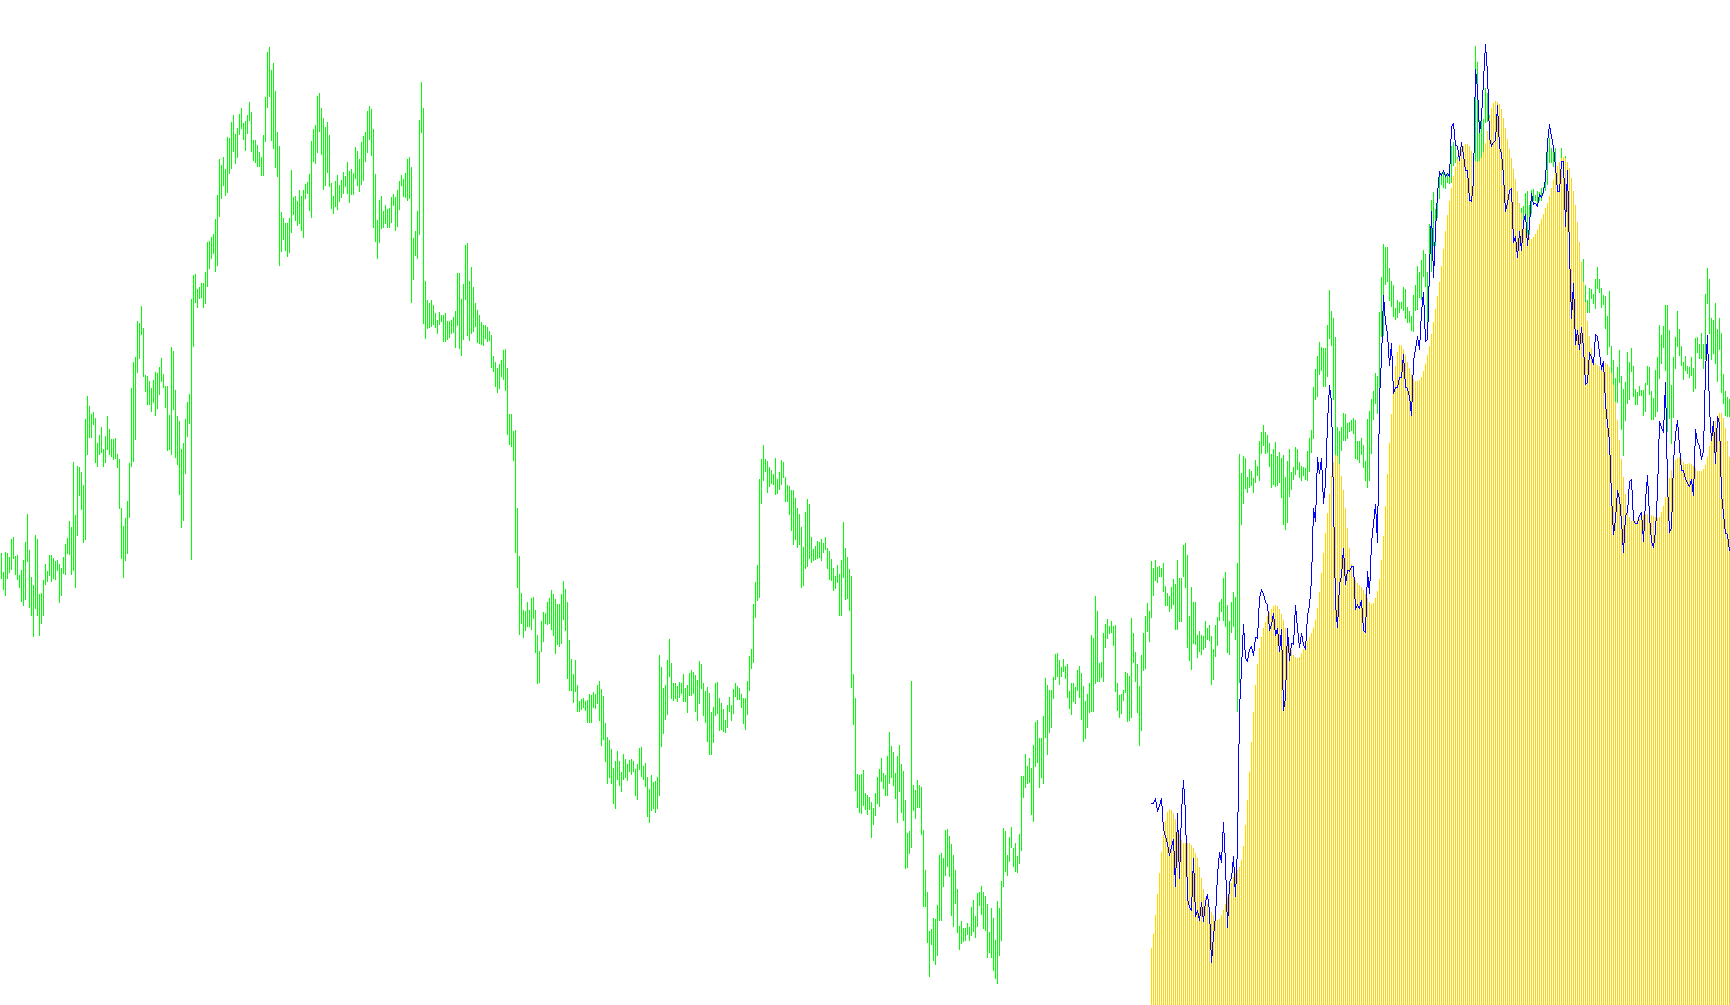
This technical tool is designed to provide traders with a visual representation of price momentum and trend cycles by processing historical market data through a specialized mathematical filter. It operates in its own dedicated window, separate from the main price chart, allowing users to observe specific trends without clutter.
Core Logic Overview
The script functions by analyzing price action over a specific timeframe (defined by the period settings) to identify smooth, underlying movements while filtering out insignificant market "noise." It accomplishes this through three primary stages:
1. Data Smoothing and Weighting Instead of looking at raw price spikes, the tool first calculates a simple moving average of the closing prices. It then applies a multi-layered smoothing process. By taking a moving average and repeating that calculation across several consecutive "layers" (represented as e1 through e6), the tool creates a very fluid curve that emphasizes the long-term trend over short-term volatility.
2. The T3 Transformation The script utilizes a sophisticated filtering logic known as the "T3" method. This involves applying specific coefficients to those smoothed layers. By combining these layers with unique mathematical weights, the tool balances two competing goals:
- Responsiveness: Ensuring the indicator reacts quickly enough to significant price changes.
- Smoothness: Preventing the indicator from "jittering" or creating false signals during minor market fluctuations.
3. Visual Output The final result is displayed in two distinct visual formats:
- A Histogram (Green): This represents the processed trend values, giving the user a clear look at the magnitude and direction of the calculated momentum.
- A Line Graph (Dark Violet): This tracks the actual closing prices, allowing the user to visually compare the raw market movement against the smoothed T3 calculation.
Summary for the User
In essence, this script acts as a "lens" that simplifies complex market movements. It takes messy price data, runs it through a series of smoothing filters to strip away distractions, and projects a clearer picture of the trend's direction and strength. This allows traders to better visualize where the market is heading by comparing actual price action against a refined, mathematically smoothed trend line.
//+------------------------------------------------------------------+
//|                                                    T3_DPO-v1.mq4 |
//|                                                                  |
//|                                        Ramdass - Conversion only |
//+------------------------------------------------------------------+

#property indicator_separate_window
#property indicator_buffers 2
#property indicator_color1 Green
#property indicator_color2 DarkViolet
//---- input parameters
extern int x_prd=0;
extern int t3_period=8;
extern double b=0.7;
extern int CountBars=300;
//---- buffers
double t3[];
double prise[];
//+------------------------------------------------------------------+
//| Custom indicator initialization function                         |
//+------------------------------------------------------------------+
int init()
  {
//---- indicator line
   IndicatorBuffers(2);
   SetIndexBuffer(0,t3);
   SetIndexBuffer(1,prise);
   SetIndexStyle(0,DRAW_HISTOGRAM);
   SetIndexStyle(1,DRAW_LINE);

//----

//----
   return(0);
  }
//+------------------------------------------------------------------+
//| T3_DPO-v1                                                         |
//+------------------------------------------------------------------+
int start()
  {
   SetIndexDrawBegin(0,Bars-CountBars+t3_period+1);
   SetIndexDrawBegin(1,Bars-CountBars+t3_period+1);
   int i,counted_bars=IndicatorCounted();
   double e1,e2,e3,e4,e5,e6,c1,c2,c3,c4,n,w1,w2, b2,b3,dpo,Prise;
//----
   if(Bars<=t3_period) return(0);
//---- initial zero
   if(counted_bars<t3_period)
   {
      for(i=1;i<=t3_period;i++) prise[Bars-i]=0.0;
      for(i=1;i<=t3_period;i++) t3[Bars-i]=0.0;
   }
//----
b2=b*b;
b3=b2*b;
c1=-b3;
c2=(3*(b2+b3));
c3=-3*(2*b2+b+b3);
c4=(1+3*b+b3+3*b2);
n=t3_period;

if (n<1) n=1;
n = 1 + 0.5*(n-1);
w1 = 2 / (n + 1);
w2 = 1 - w1;
//----
   i=Bars-CountBars-1;
   if(counted_bars>=t3_period) i=CountBars-counted_bars-1;
   while(i>=0)
     {
      dpo=iMA(NULL,0,t3_period,0,MODE_SMA,PRICE_CLOSE,i);

  e1 = w1*dpo + w2*e1;
  e2 = w1*e1 + w2*e2;
  e3 = w1*e2 + w2*e3;
  e4 = w1*e3 + w2*e4;
  e5 = w1*e4 + w2*e5;
  e6 = w1*e5 + w2*e6;

  t3[i] = c1*e6 + c2*e5 + c3*e4 + c4*e3;

   prise[i]=Close[i];

      i--;
     }
   return(0);
  }
//+------------------------------------------------------------------+
Comments