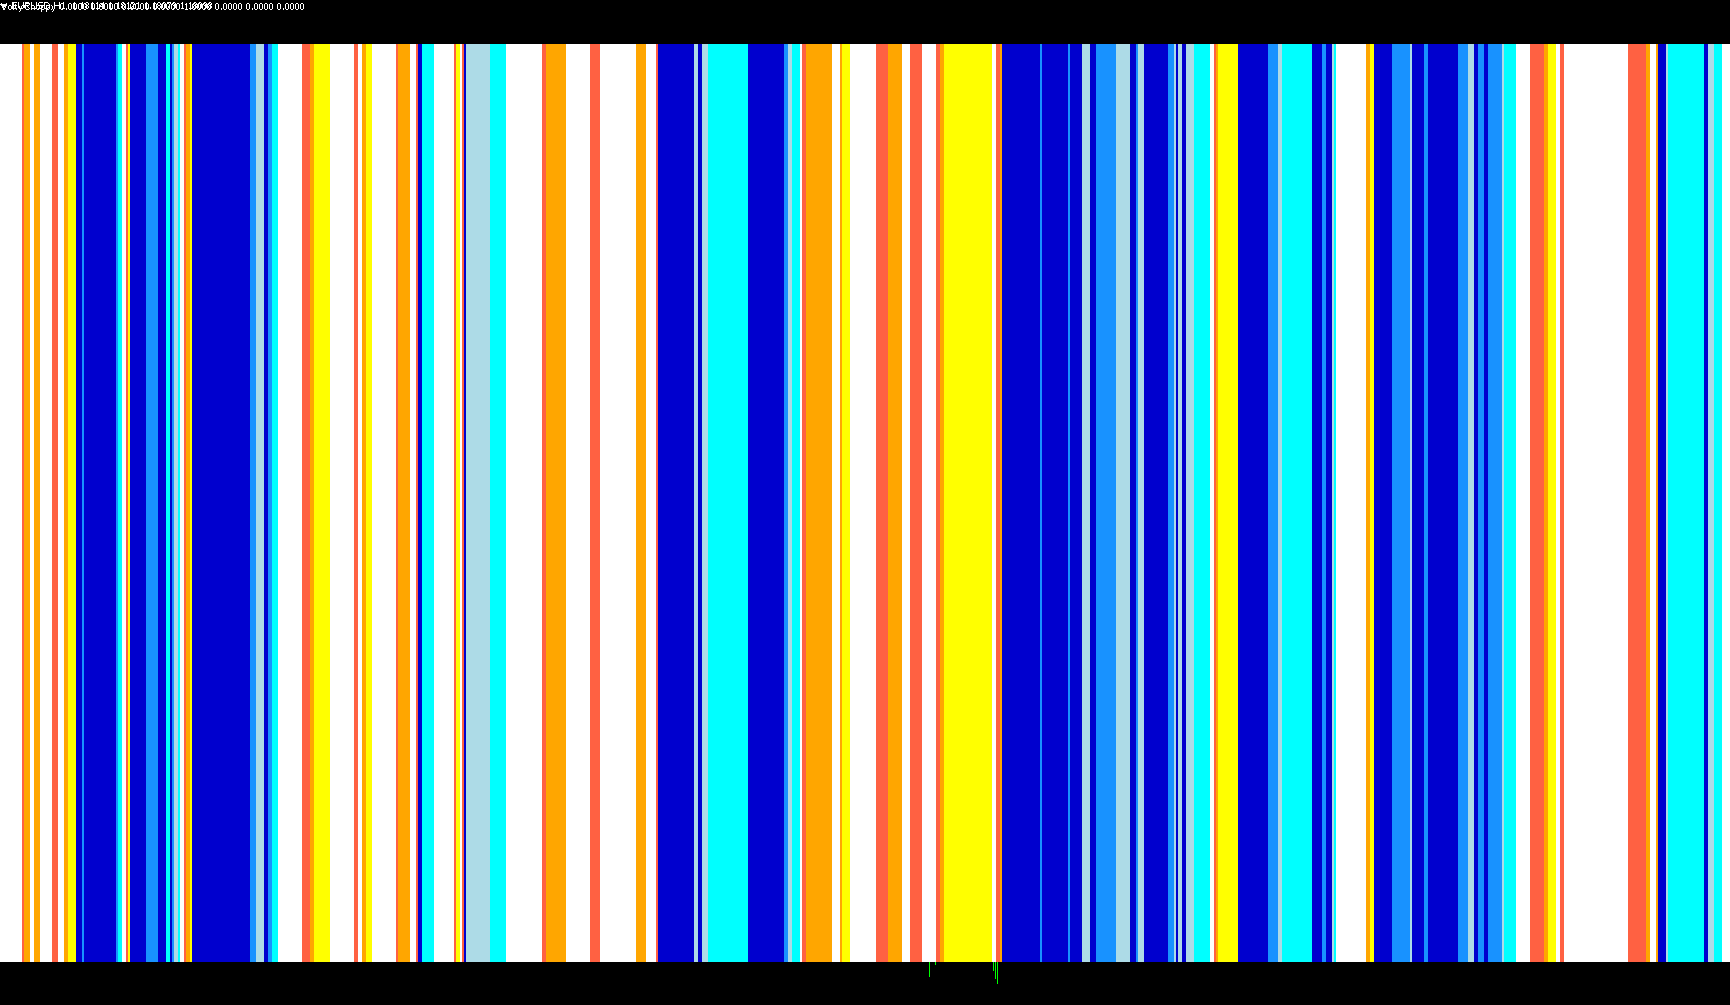
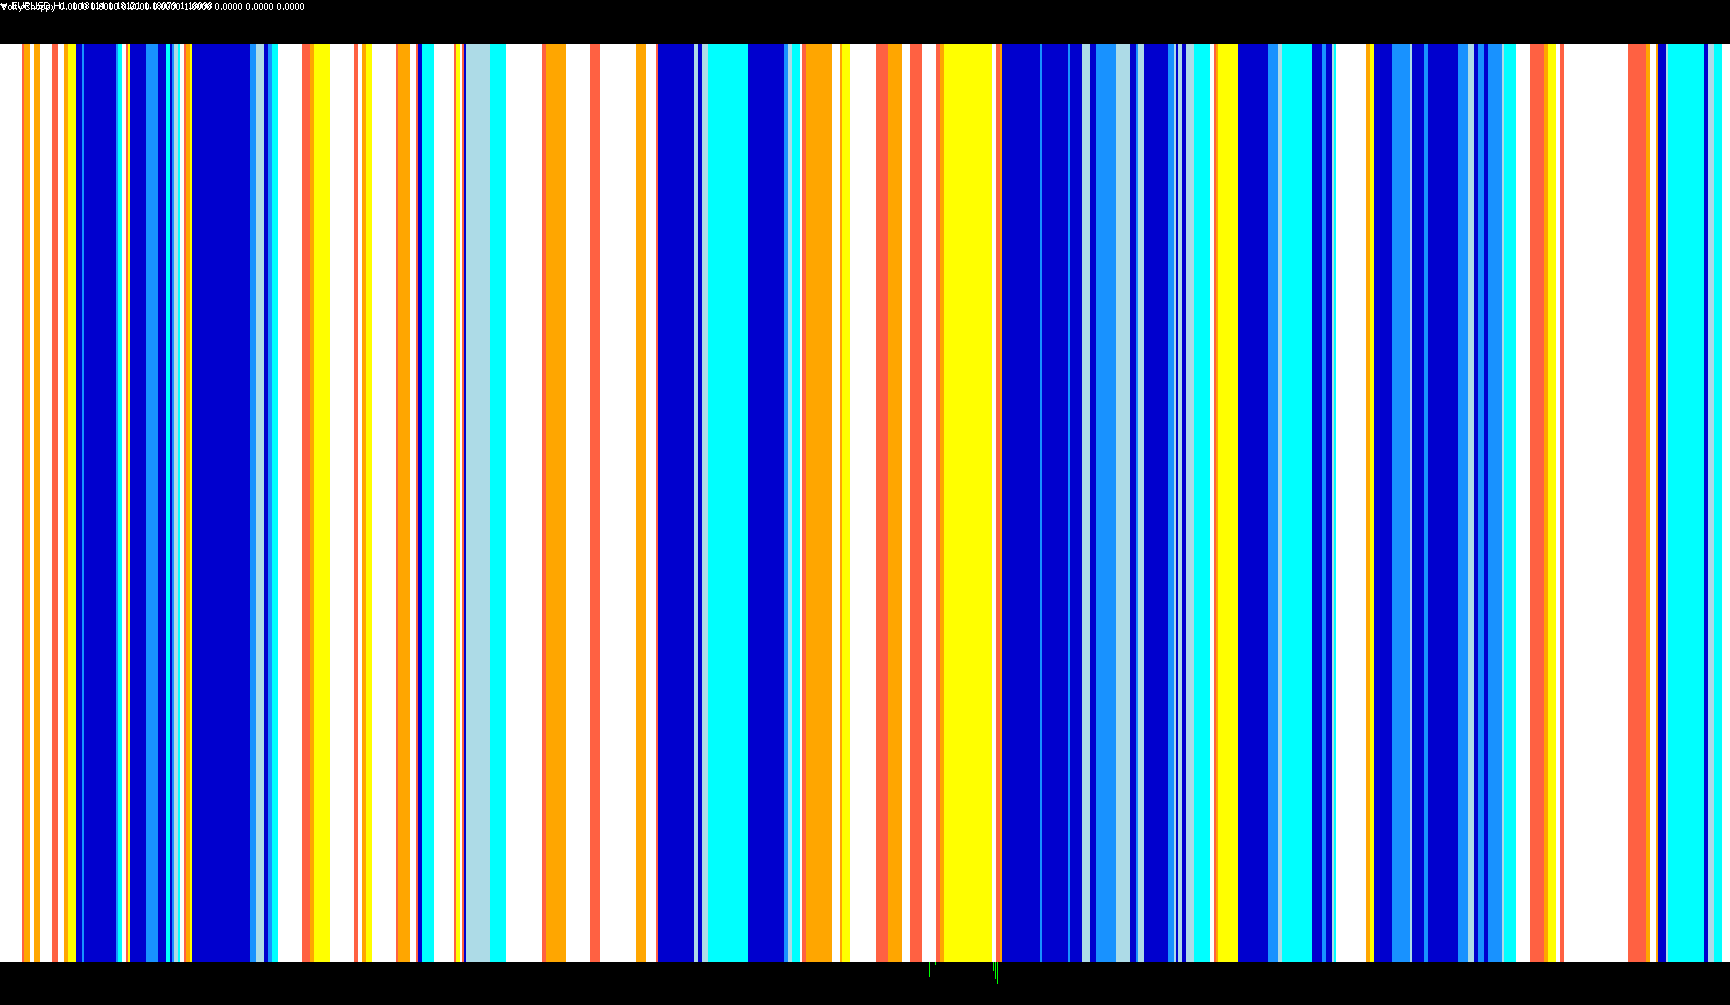
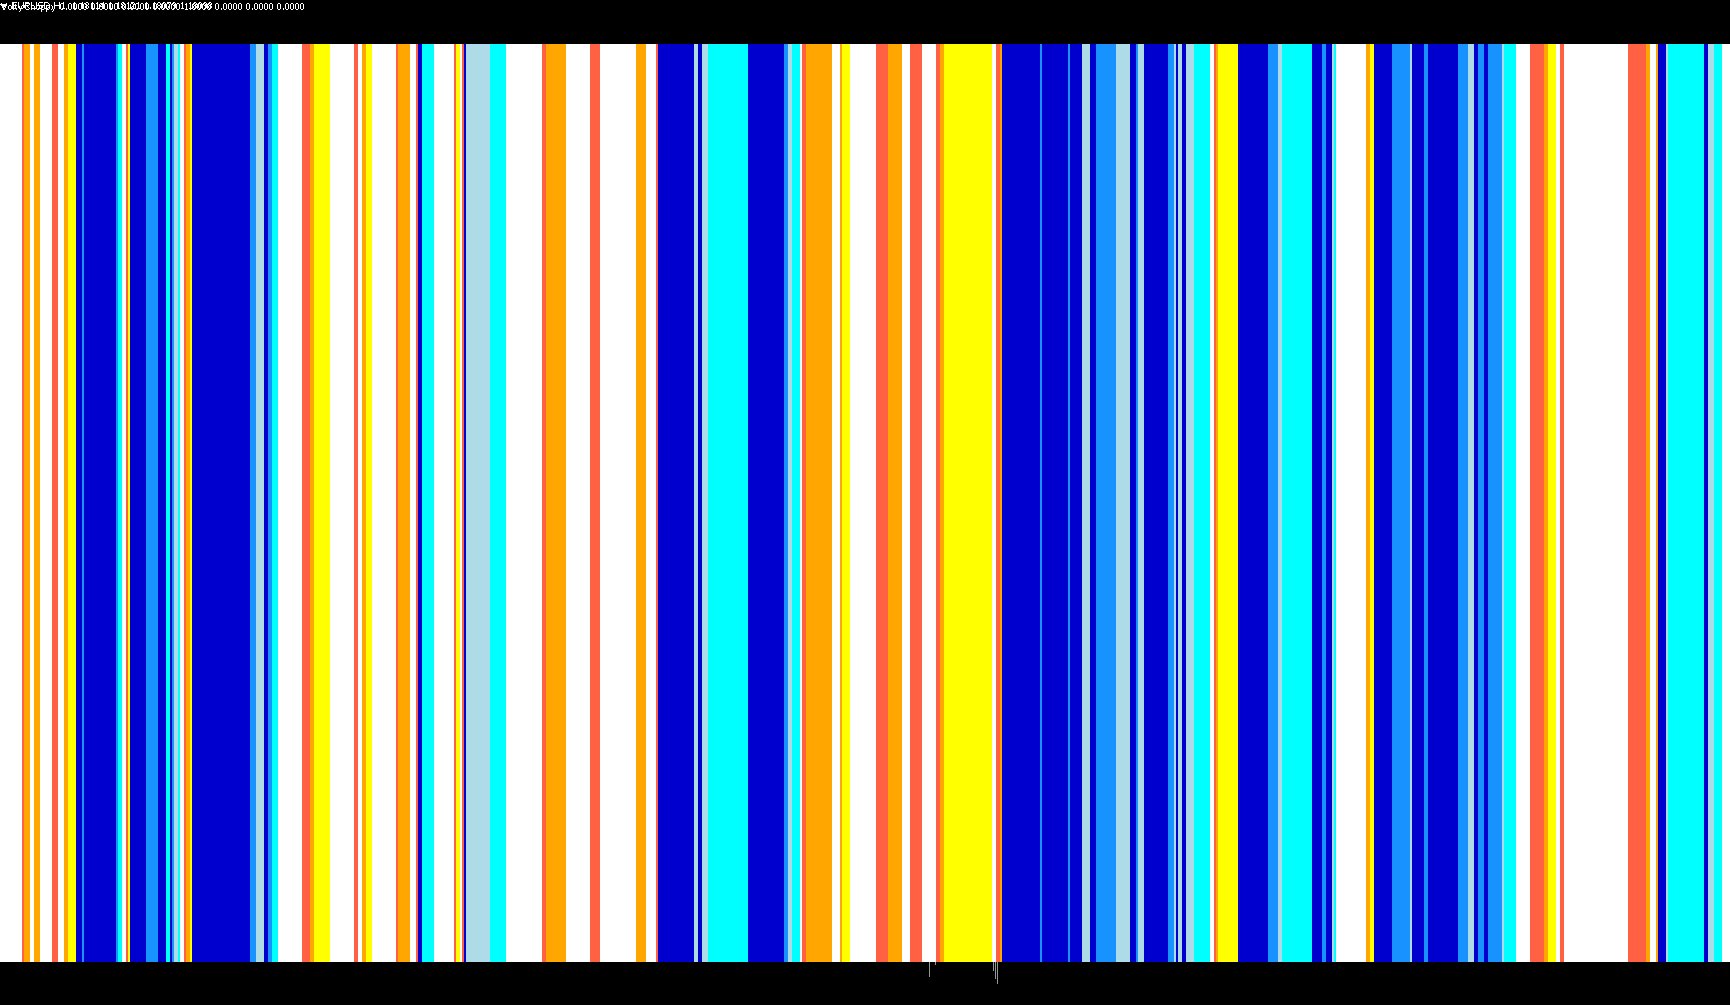
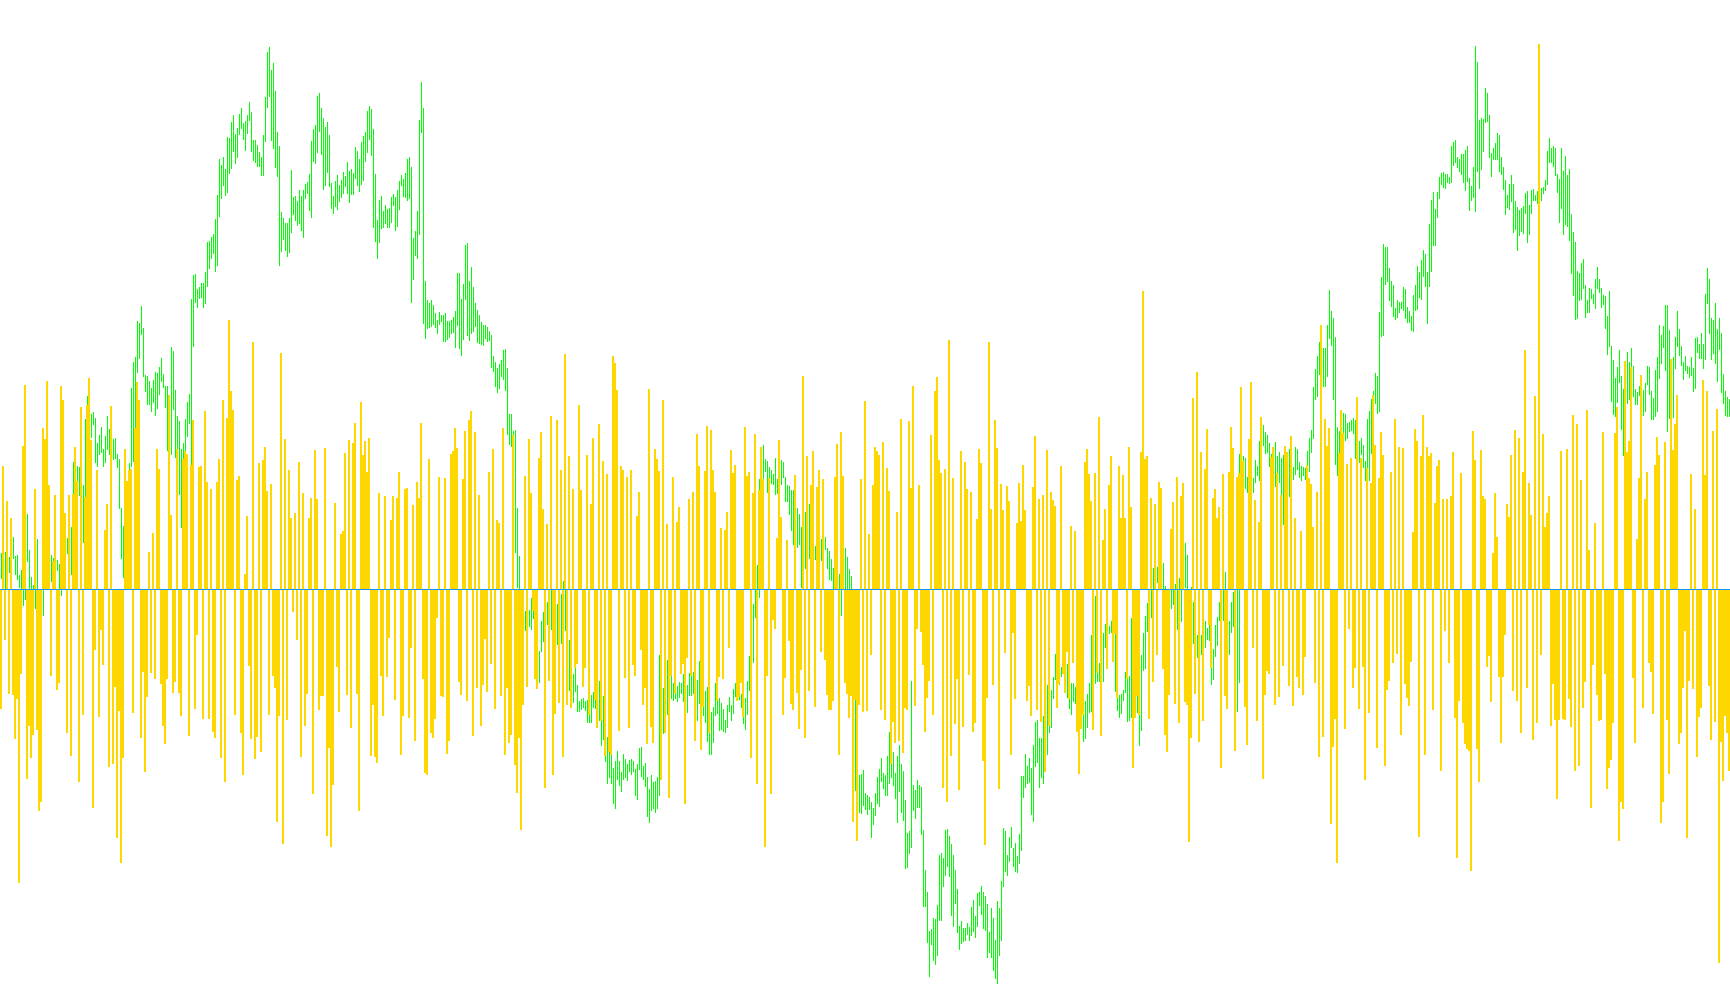
VoltyChoppy_v1_002
Indicator

VoltyChoppy_v1_002

iATR

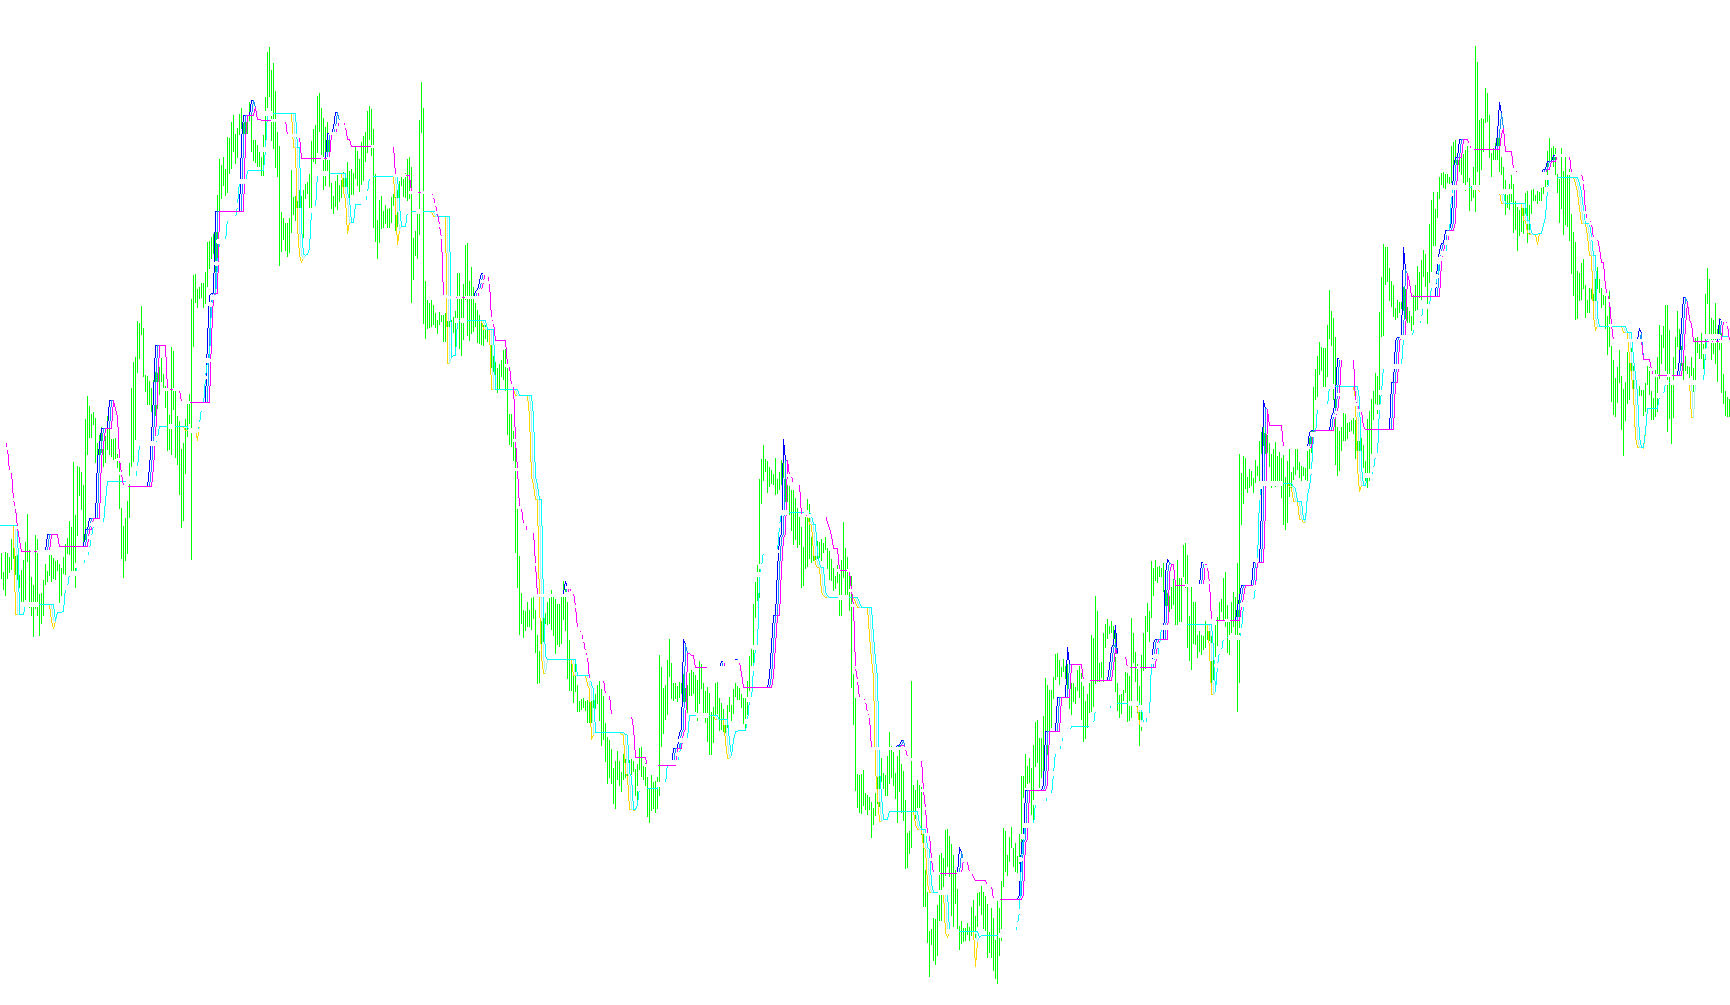
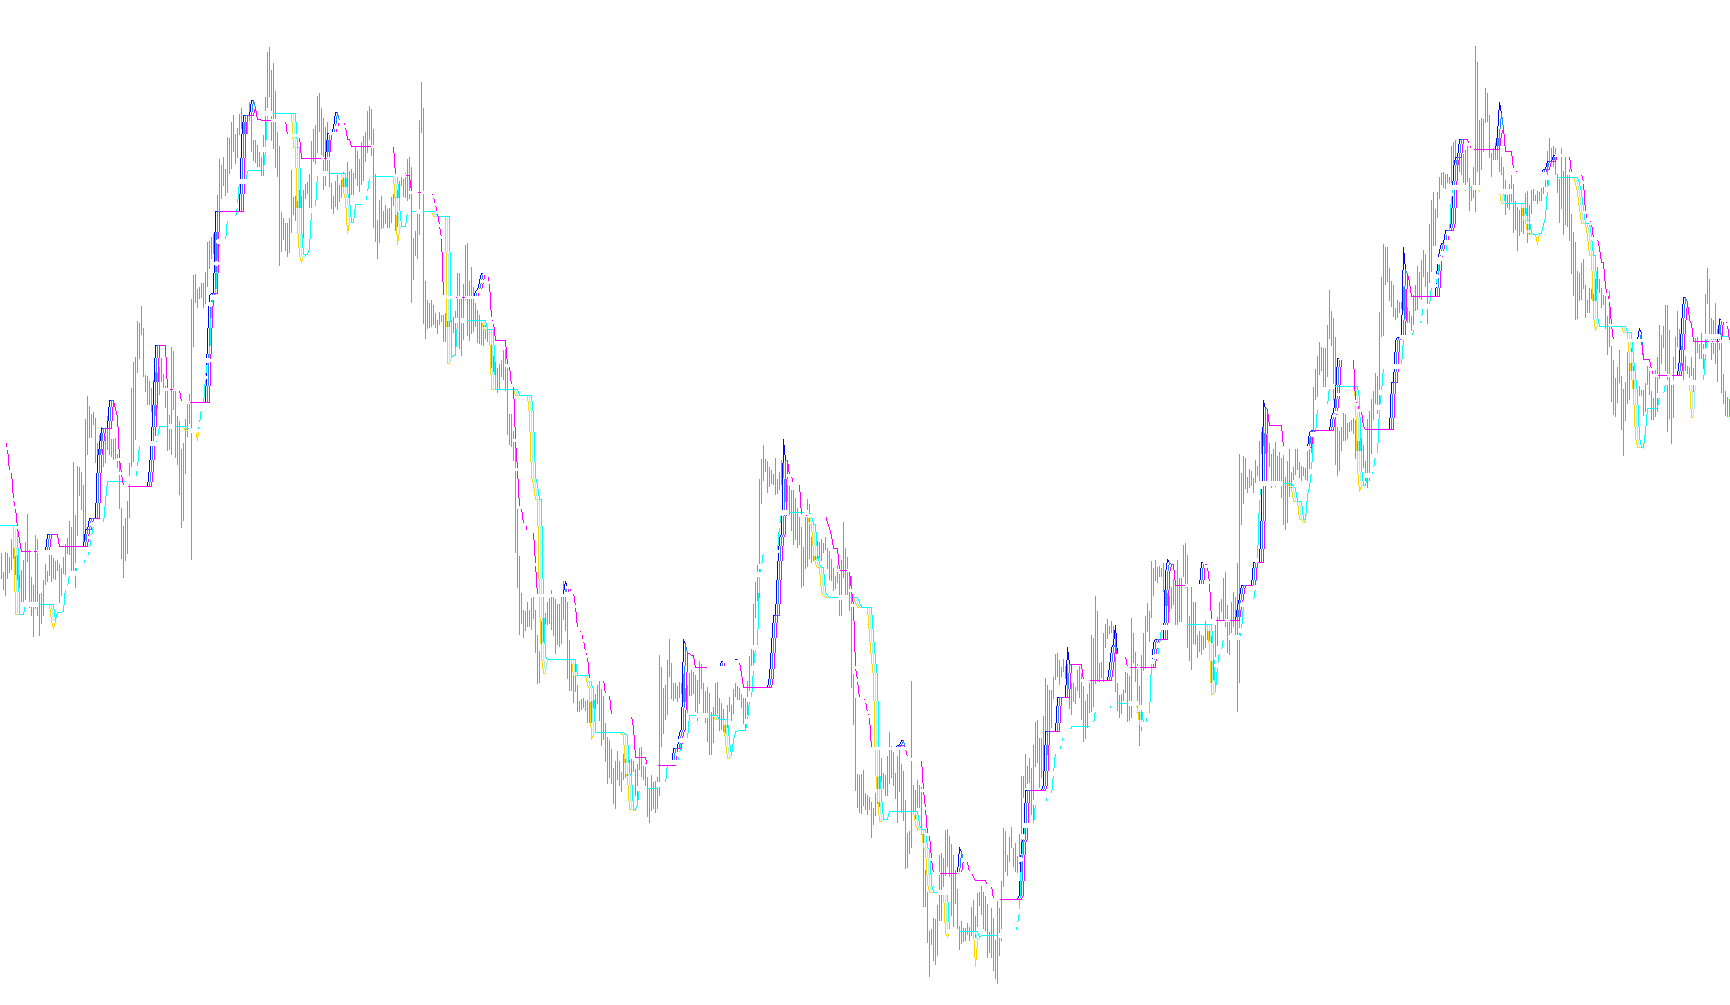
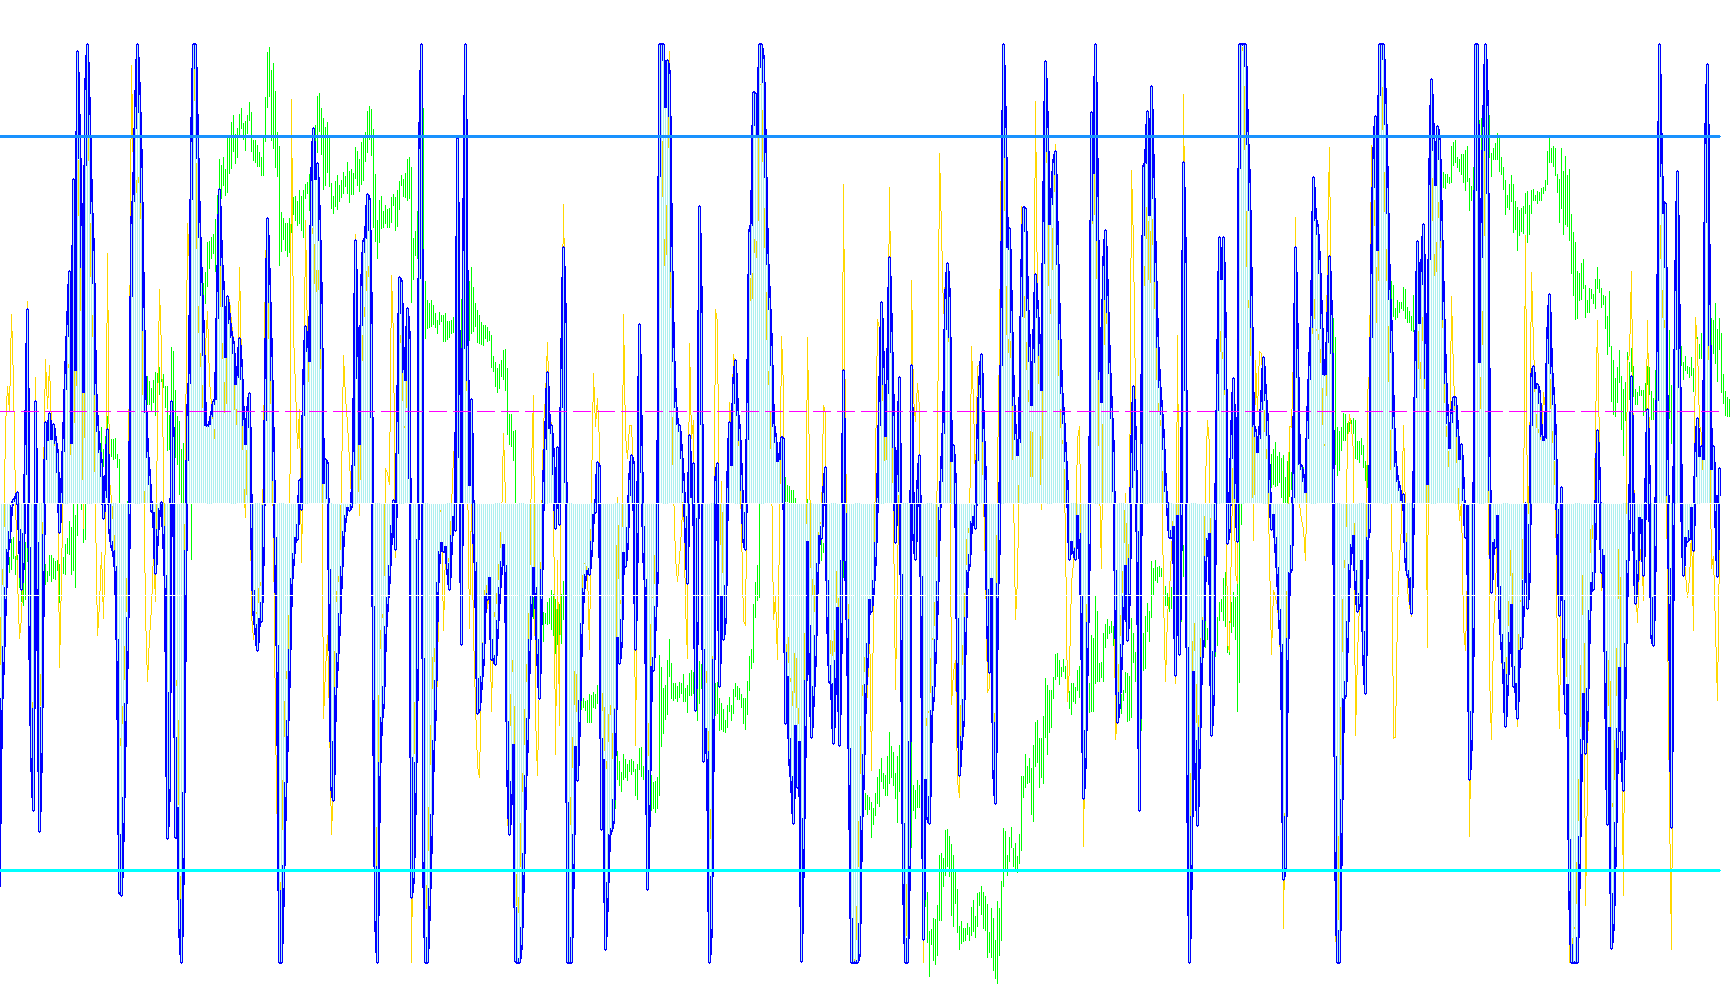
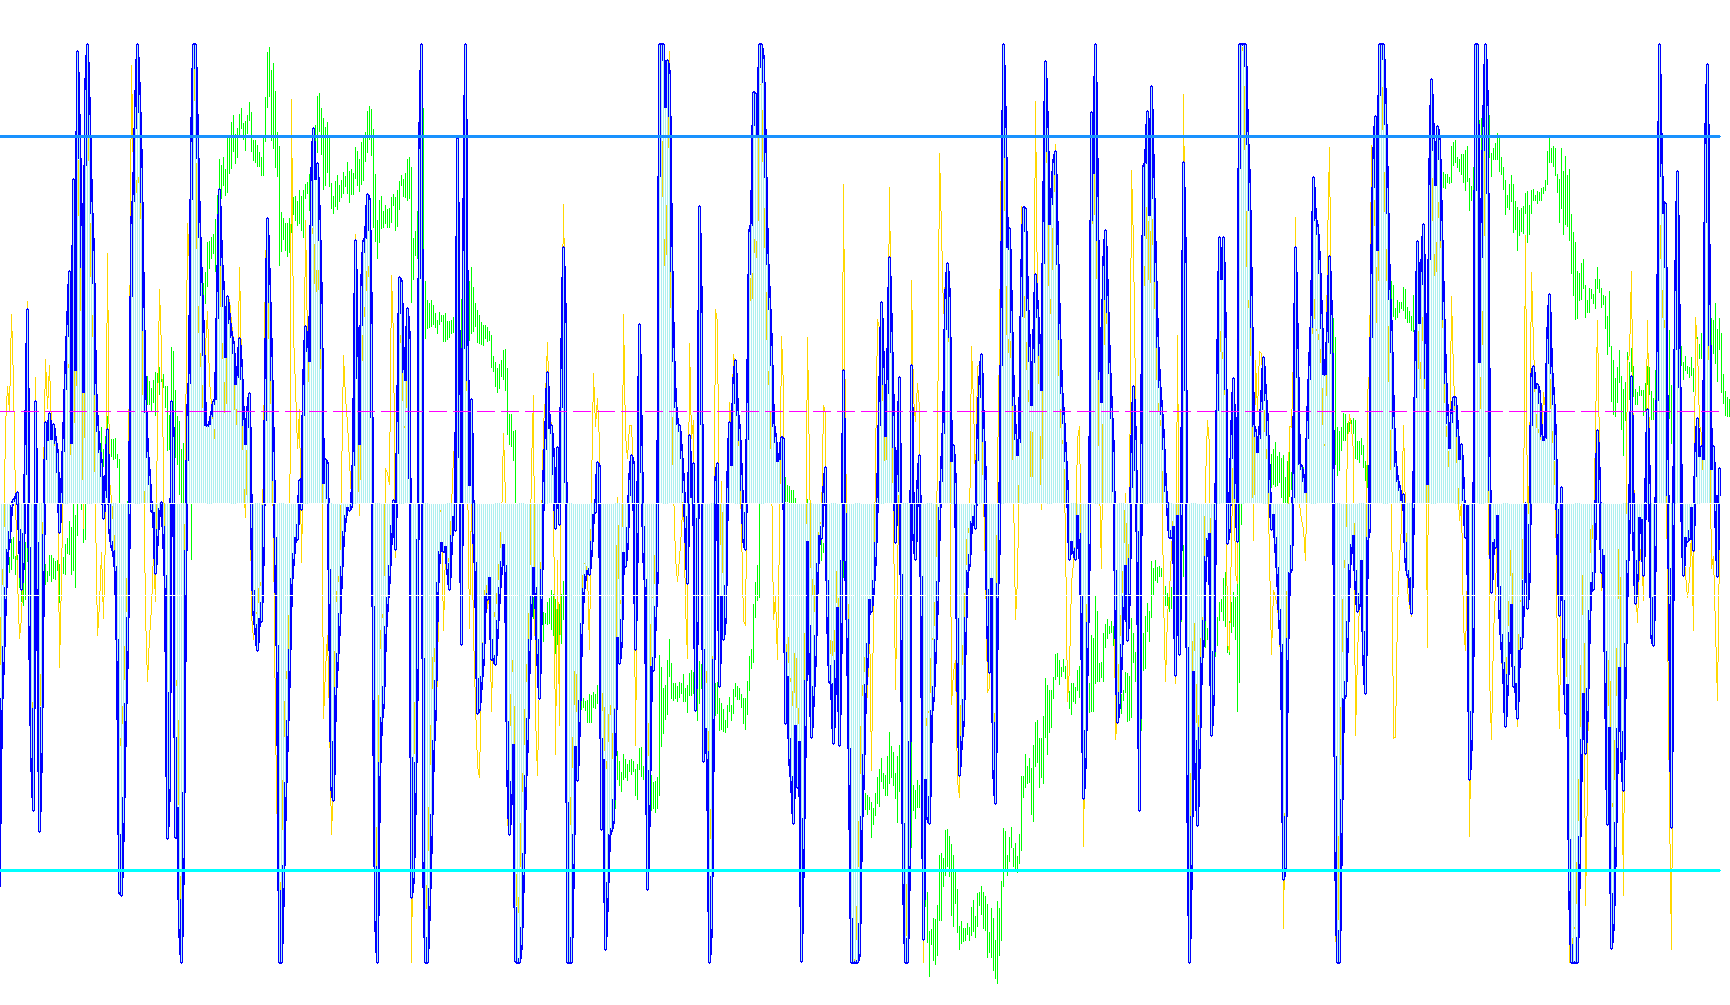
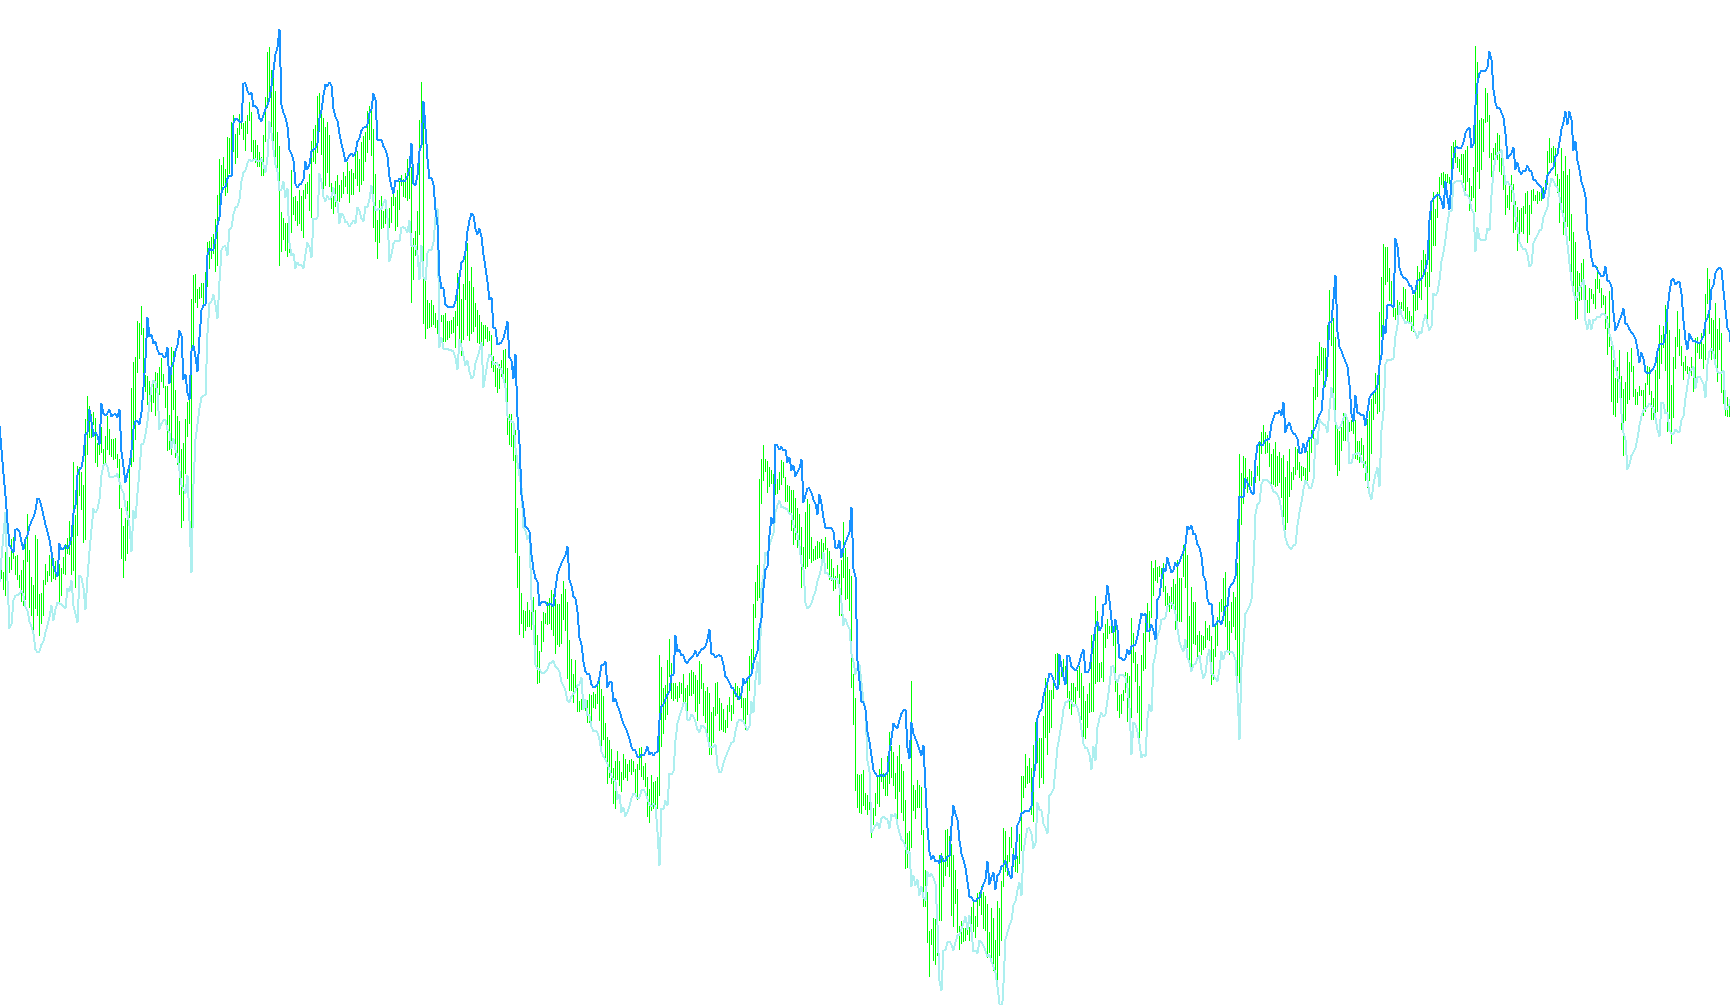
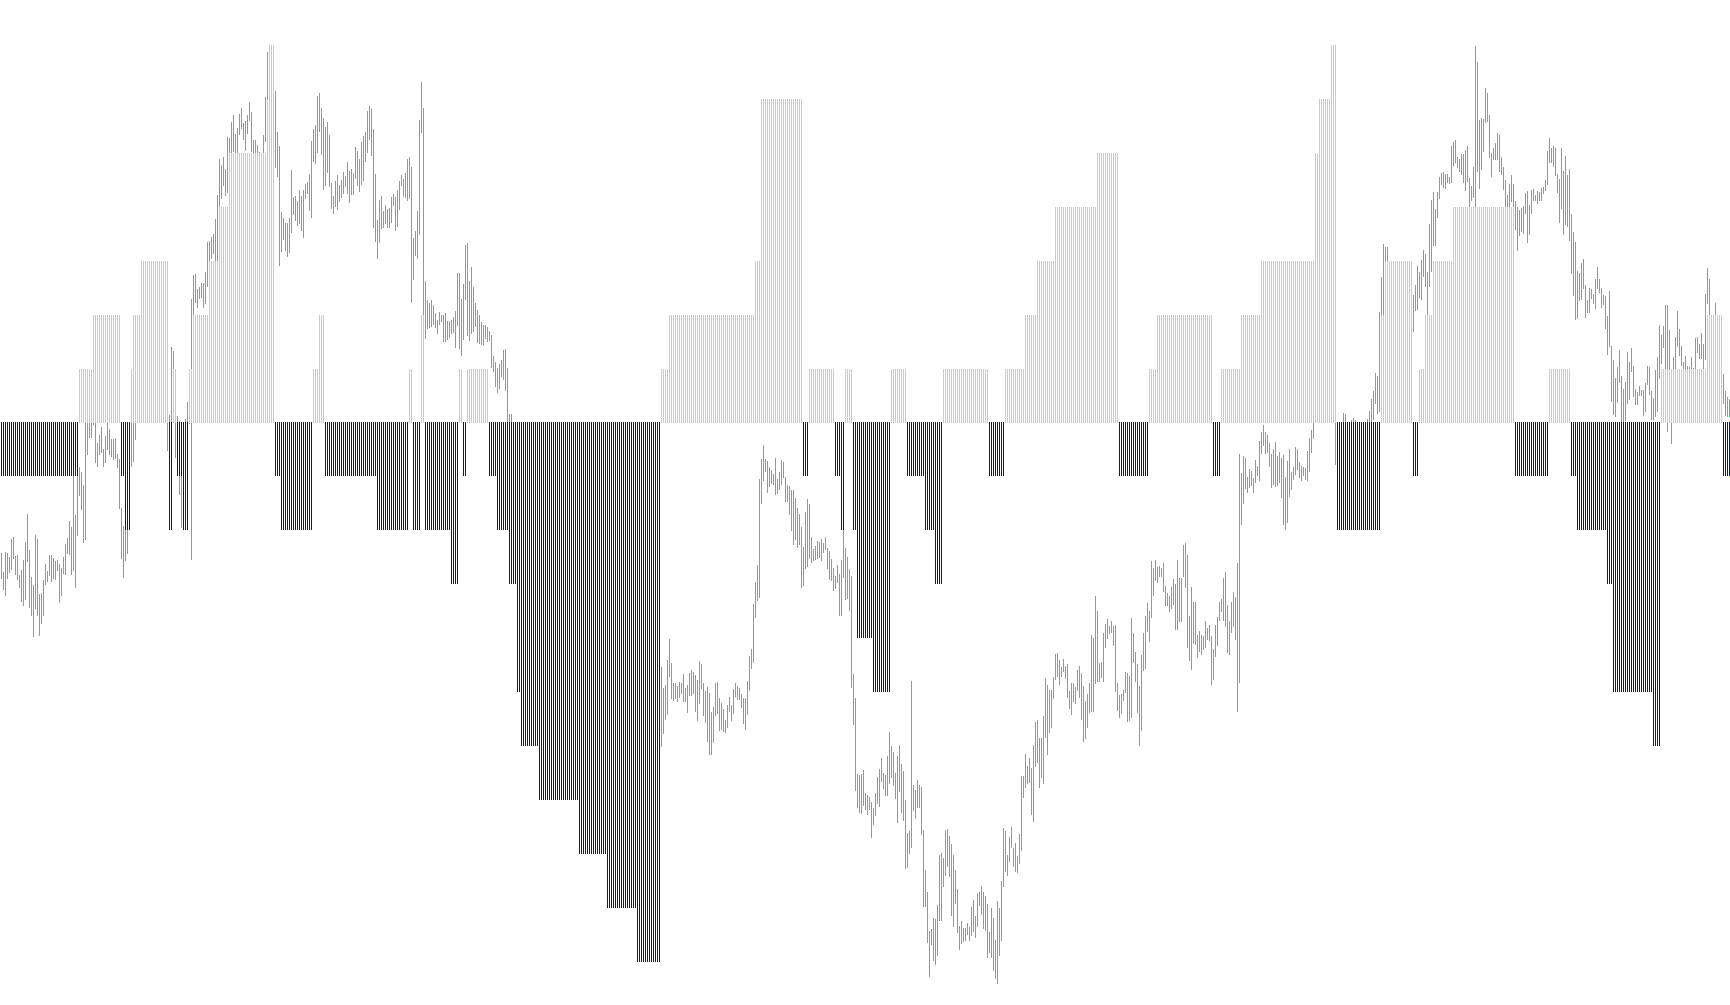
This indicator categorizes market dynamics into four distinct phases by measuring the expansion of price action against ATR-based volatility boundaries to identify trend strength and structural transitions.

VoltyChoppy_v1_005
Indicator

VoltyChoppy_v1_005

iATR

This indicator quantifies market momentum by calculating four distinct levels of price volatility relative to Average True Range (ATR) bands to identify trend strength, retracements, and transitionary phases.

VoltyChoppy_v1_sounds
Indicator

VoltyChoppy_v1_sounds

iATR

This indicator dynamically categorizes market momentum into four distinct phases by evaluating price action against multiple scaled Average True Range (ATR) thresholds.

VoltyChoppy_v1_sounds_001
Indicator

VoltyChoppy_v1_sounds_001

iATR

This indicator utilizes nested ATR-based volatility bands to categorize market dynamics into four distinct states of trend strength, retracement, and exhaustion.

Vortex Indicator
Indicator

Vortex Indicator

iATR

This indicator calculates the relative strength of upward versus downward price movement by normalizing the sum of positive and negative movements against the cumulative True Range.

Vortex Oscillator
Indicator

Vortex Oscillator

iATR

This indicator quantifies price action strength by calculating the differential between upward and downward movement vectors normalized by the cumulative true range.

VSA-wick0[1].3
Indicator

VSA-wick0[1].3

iATR

This indicator quantifies price rejection by calculating the cumulative distance between candle extremes and the closing price, optionally overlaid with ATR-based volatility bounds.

VSA_v2
Indicator

VSA_v2

iATRiMA

This indicator quantifies market sentiment by calculating the net difference between bullish and bearish volume flows, conditioned by moving average crossovers and ATR volatility expansions.

VSpread2
Indicator

VSpread2

iATR

This indicator quantifies relative price velocity by normalizing traded volume against the range of each candle to identify accumulation and distribution intensity.

VTS_G2
Indicator

VTS_G2

iATR

The algorithm calculates price boundaries using Average True Range multipliers and applies successive recursive extrema to identify nested support and resistance levels.

VTS_G3
Indicator

VTS_G3

iATR

This indicator generates a nested series of recursive volatility bands by iteratively applying Max and Min functions to price levels offset by a multiple of the Average True Range.

VTS_TS
Indicator

VTS_TS

iATR

This indicator identifies potential trend exhaustion points by calculating recursive maximum and minimum price boundaries derived from ATR-based volatility bands.

VTS_VG_G1
Indicator

VTS_VG_G1

iATR

This indicator identifies extreme price boundaries by recursively applying maximum and minimum calculations to multi-layered Average True Range offsets.

VTS_VG_G2
Indicator

VTS_VG_G2

iATR

This indicator generates a nested volatility envelope by recursively applying maximum and minimum price extremes to an Average True Range expansion.

VTS_VG_G3
Indicator

VTS_VG_G3

iATR

This indicator generates dynamic price boundaries by applying successive recursive maximum and minimum calculations over a base Average True Range volatility band.

VTS_VG_TS
Indicator

VTS_VG_TS

iATR

This indicator identifies price breakout points by recursively calculating nested maximum and minimum thresholds based on a multiplier of the Average True Range.

VTS_VG_TS_setka
Indicator

VTS_VG_TS_setka

iATR

This indicator generates a multi-layered recursive volatility ceiling and floor by iteratively applying maximum and minimum calculations to ATR-based price envelopes.

VTS_VG_TS_setka_v1
Indicator

VTS_VG_TS_setka_v1

iATR

This indicator identifies extreme price boundaries by recursively nesting multiple layers of Average True Range (ATR) expansions and high-water mark calculations to detect structural exhaustion.

VTS_VG_TS_setka_v2
Indicator

VTS_VG_TS_setka_v2

iATR

This indicator calculates multi-layered price envelopes using recursive ATR extremes to identify nested volatility channels and automated breakout signals.

VTS_VG_TS_v1
Indicator

VTS_VG_TS_v1

iATR

This indicator identifies trend reversal points by calculating multi-layered recursive extrema based on price deviations from the Average True Range.

WATR
Indicator

WATR

iATR

This indicator identifies structural market shifts by dynamically projecting price boundaries using Average True Range volatility and filtering out counter-trend bar anomalies.

Indicator

WCCISqueeze v1

iCCIiATRiStdDev
Weighted WCCI
Indicator

Weighted WCCI

iCCIiATR

This indicator dynamically scales the Commodity Channel Index (CCI) using a volatility ratio derived from Average True Range (ATR) to normalize momentum across different market conditions.

WeightedCCI
Indicator

WeightedCCI

iCCIiATR

This indicator calculates a dynamic momentum profile by applying an ATR-based volatility weight to the CCI and Turbo CCI values while enforcing specific boundary constraints.

WeightedCCI2
Indicator

WeightedCCI2

iCCIiATR

This indicator scales standard Commodity Channel Index (CCI) values by a dynamic ratio of short-term to long-term Average True Range (ATR) to normalize momentum against market volatility.

WeightedCCI_v1
Indicator

WeightedCCI_v1

iCCIiATR

This indicator scales the Commodity Channel Index (CCI) by a dynamic volatility ratio derived from ATR differences to identify weighted trend momentum.

wick0.2
Indicator

wick0.2

iATR

This indicator quantifies the magnitude of upper and lower price wicks relative to the body, providing visual metrics on price rejection and volatility extremes.

wick0.3
Indicator

wick0.3

iATR

This indicator quantifies price rejection by calculating the distance between candle bodies and extremes, providing a visual representation of upper and lower shadow magnitudes.

Wilder Volatility System
Indicator

Wilder Volatility System

iATR

This indicator projects dynamic price corridors based on local extrema and multiple ATR deviations to identify structural breakout points.

XOAtr
Indicator

XOAtr

iATR

This indicator tracks momentum by measuring price breaches beyond ATR-adjusted thresholds, accumulating directional intensity as a histogram.

ZUP_v39
Indicator

ZUP_v39

iATR

A comprehensive technical analysis tool that integrates multiple ZigZag algorithms with dynamic Fibonacci fans, Pitchfork projections, and Pesavento retracement levels to identify complex harmonic patterns.

ZUP_v39_v1
Indicator

ZUP_v39_v1

iATR

A multi-functional technical analysis tool that integrates various ZigZag algorithms with dynamic Fibonacci fans, Pitchfork channels, and recursive harmonic pattern recognition based on Pesavento ratios.

ZUP_v40
Indicator

ZUP_v40

iATR

A comprehensive multi-functional toolkit that overlays ZigZag price action with Pesavento retracement levels, dynamic/static Fibonacci fans, and automated harmonic pitchfork structures.

ZUP_v42
Indicator

ZUP_v42

iATR

A comprehensive technical analysis tool that integrates multiple ZigZag algorithms, Gann Swings, and dynamic Pitchfork structures to project complex Fibonacci retracement levels and harmonic price zones.

ZUP_v45
Indicator

ZUP_v45

iATR

An advanced multi-algorithmic technical indicator that integrates diverse ZigZag variants, Pesavento patterns, and dynamic harmonic structures like Pitchforks and Fibonacci Fans.

Indicator

ZUP_v61_beta

iATR
Indicator

ZUP_v64

iATR
Indicator

ZUP_v67

iATR
Indicator

ZUP_v76mod4

iATR
Indicator

ZUP_v76_5-0_mod

iATR
Indicator

ZUP_v77

iATR
Indicator

ZUP_v78

iATR
[i]BollTrade_Ron_MT4_v05a
Indicator

[i]BollTrade_Ron_MT4_v05a

iATRiMAiStdDev

This indicator identifies extreme price expansions beyond Bollinger Bands by utilizing either fixed-point offsets or ATR-weighted buffers to generate reversal signals with automated take-profit and stop-loss levels.

[i]BollTrade_Ron_MT4_v05b
Indicator

[i]BollTrade_Ron_MT4_v05b

iATRiMAiStdDev

This indicator identifies potential mean reversion entries by detecting price exhaustion beyond extended Bollinger Band boundaries, utilizing optional ATR-based volatility scaling for dynamic risk management.
Indicator

_2523MTF_ATR

iATR
_2523MTF_shi_channel_1
Indicator

_2523MTF_shi_channel_1

iATR

This indicator dynamically projects linear trend channels based on high and low fractal pivot points while identifying breakout opportunities through automated price-action boundary analysis.