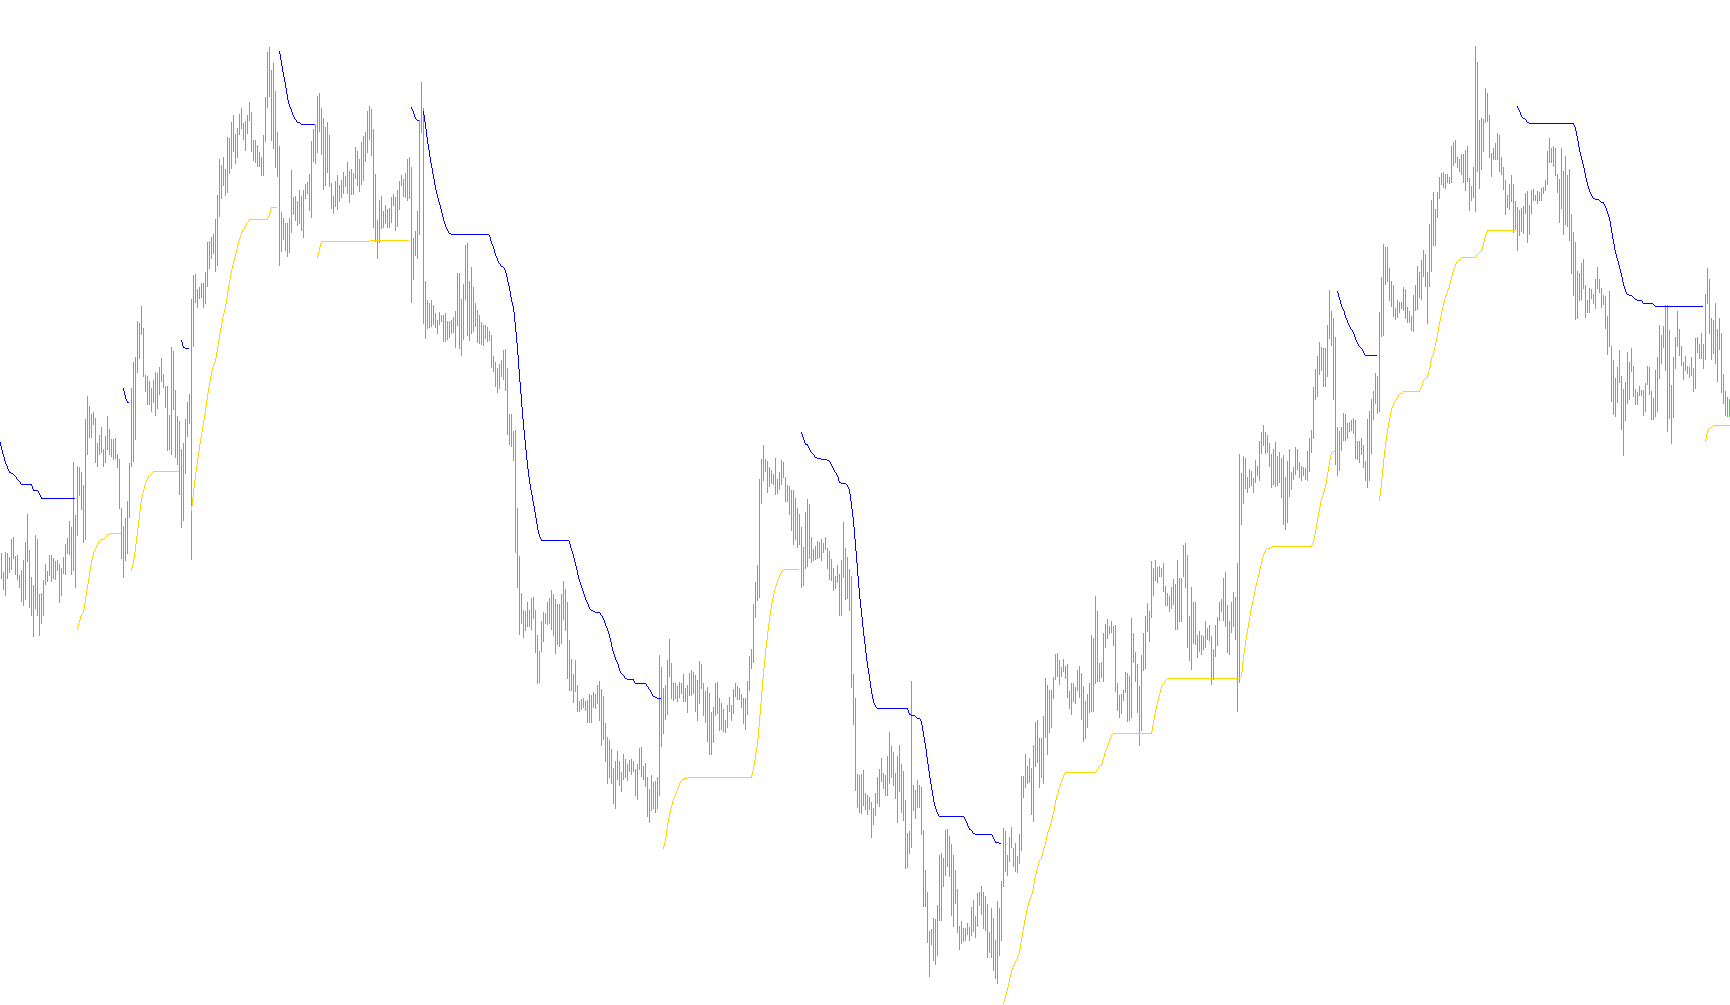
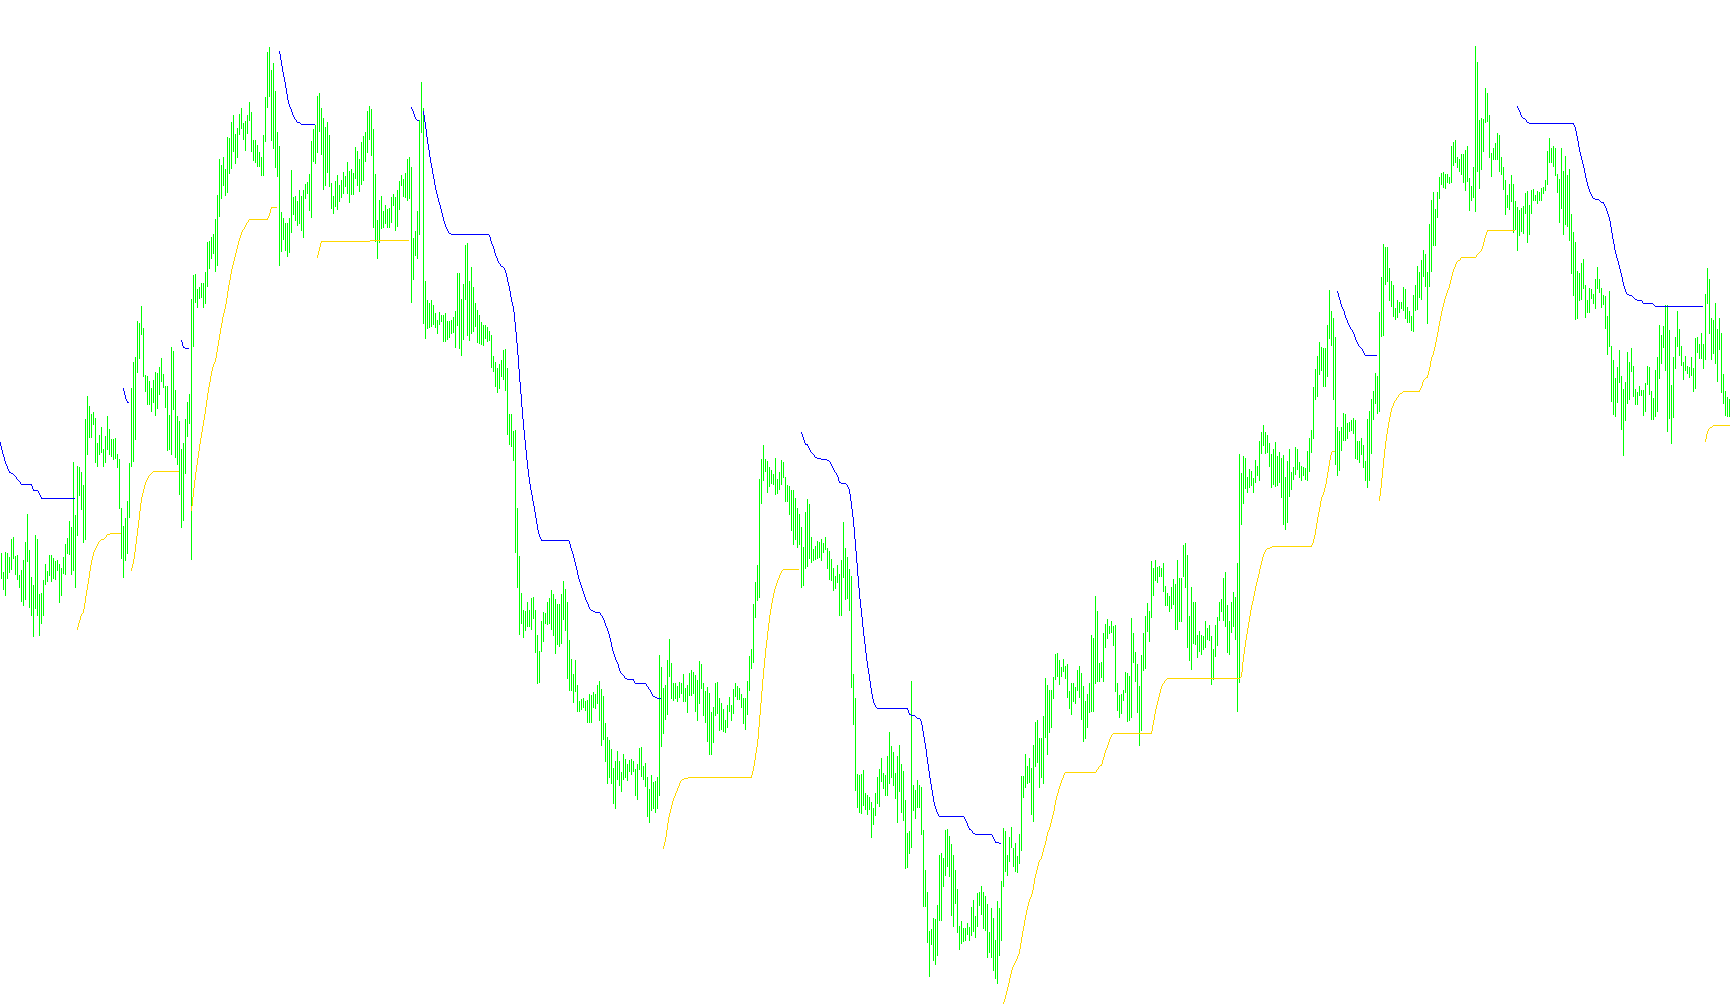
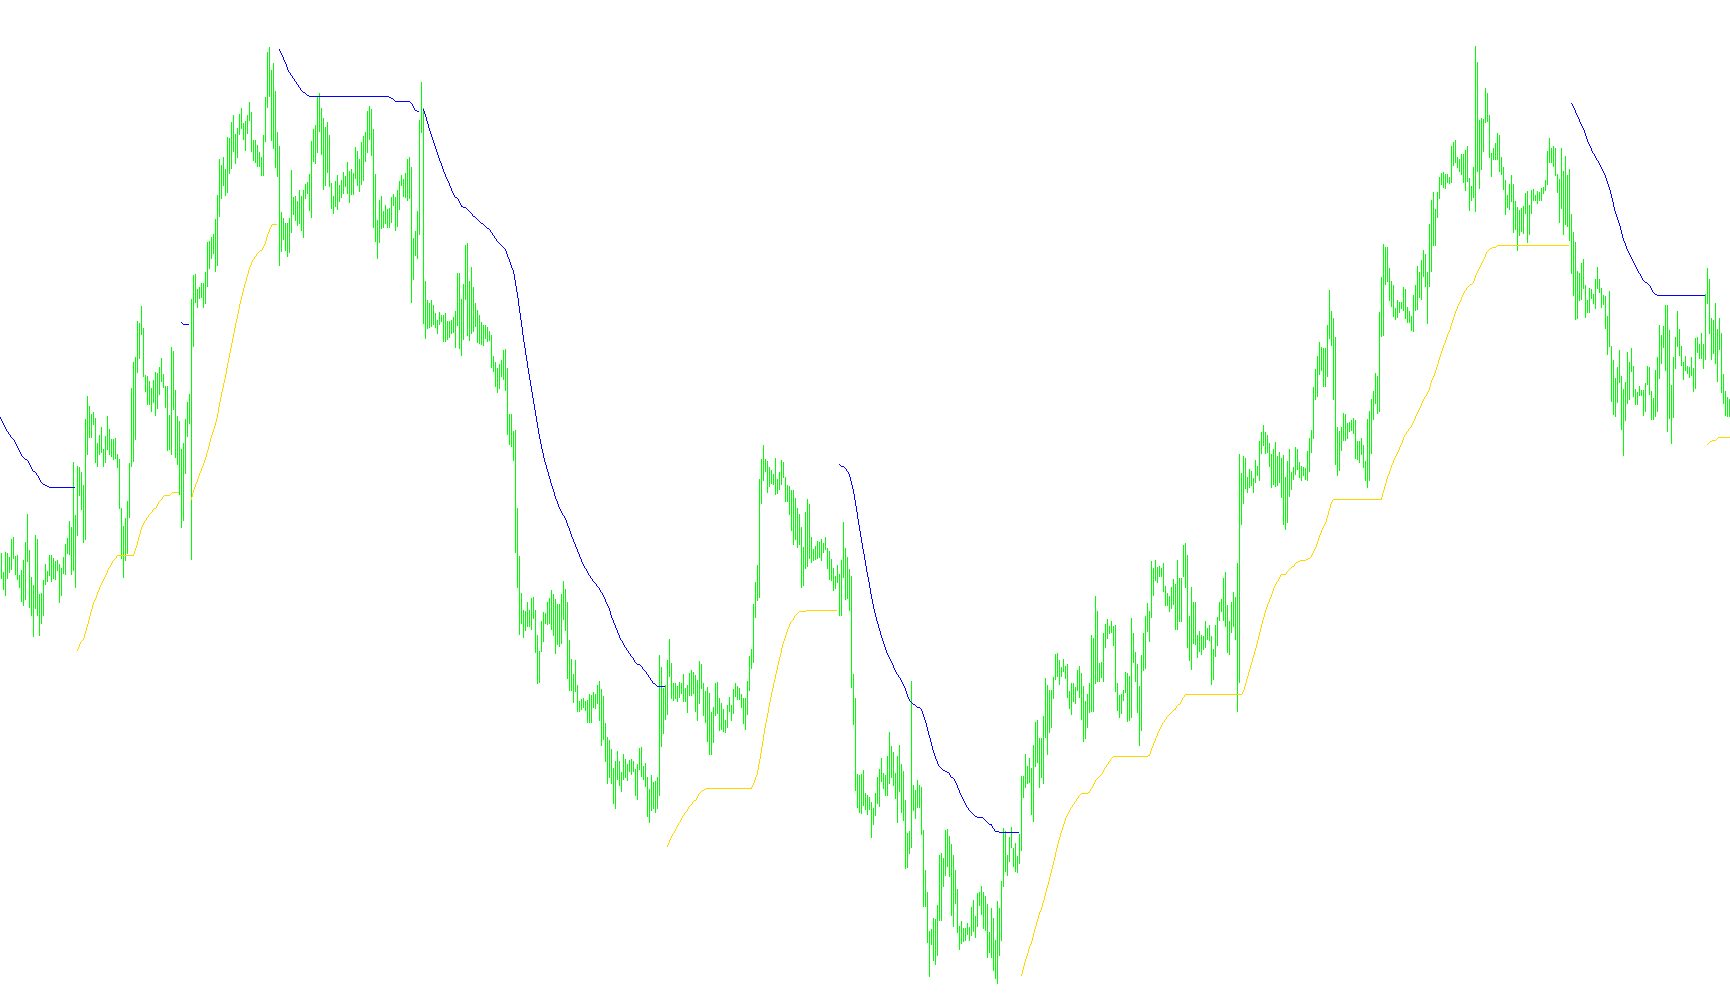
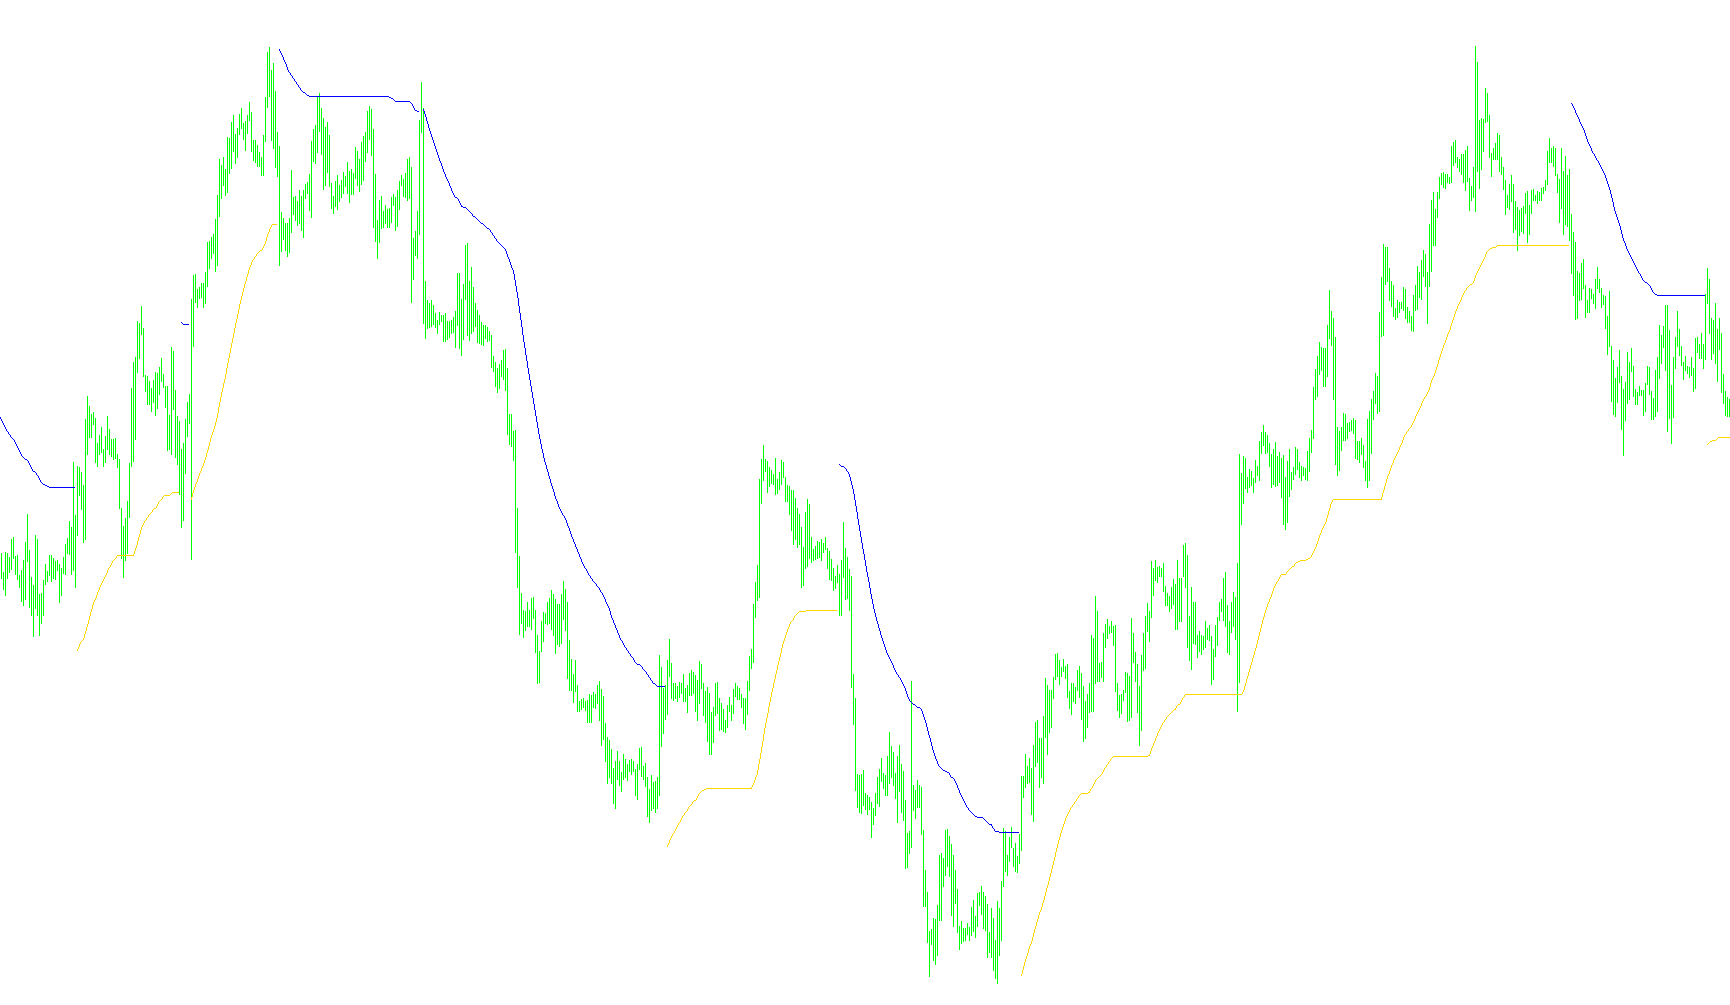
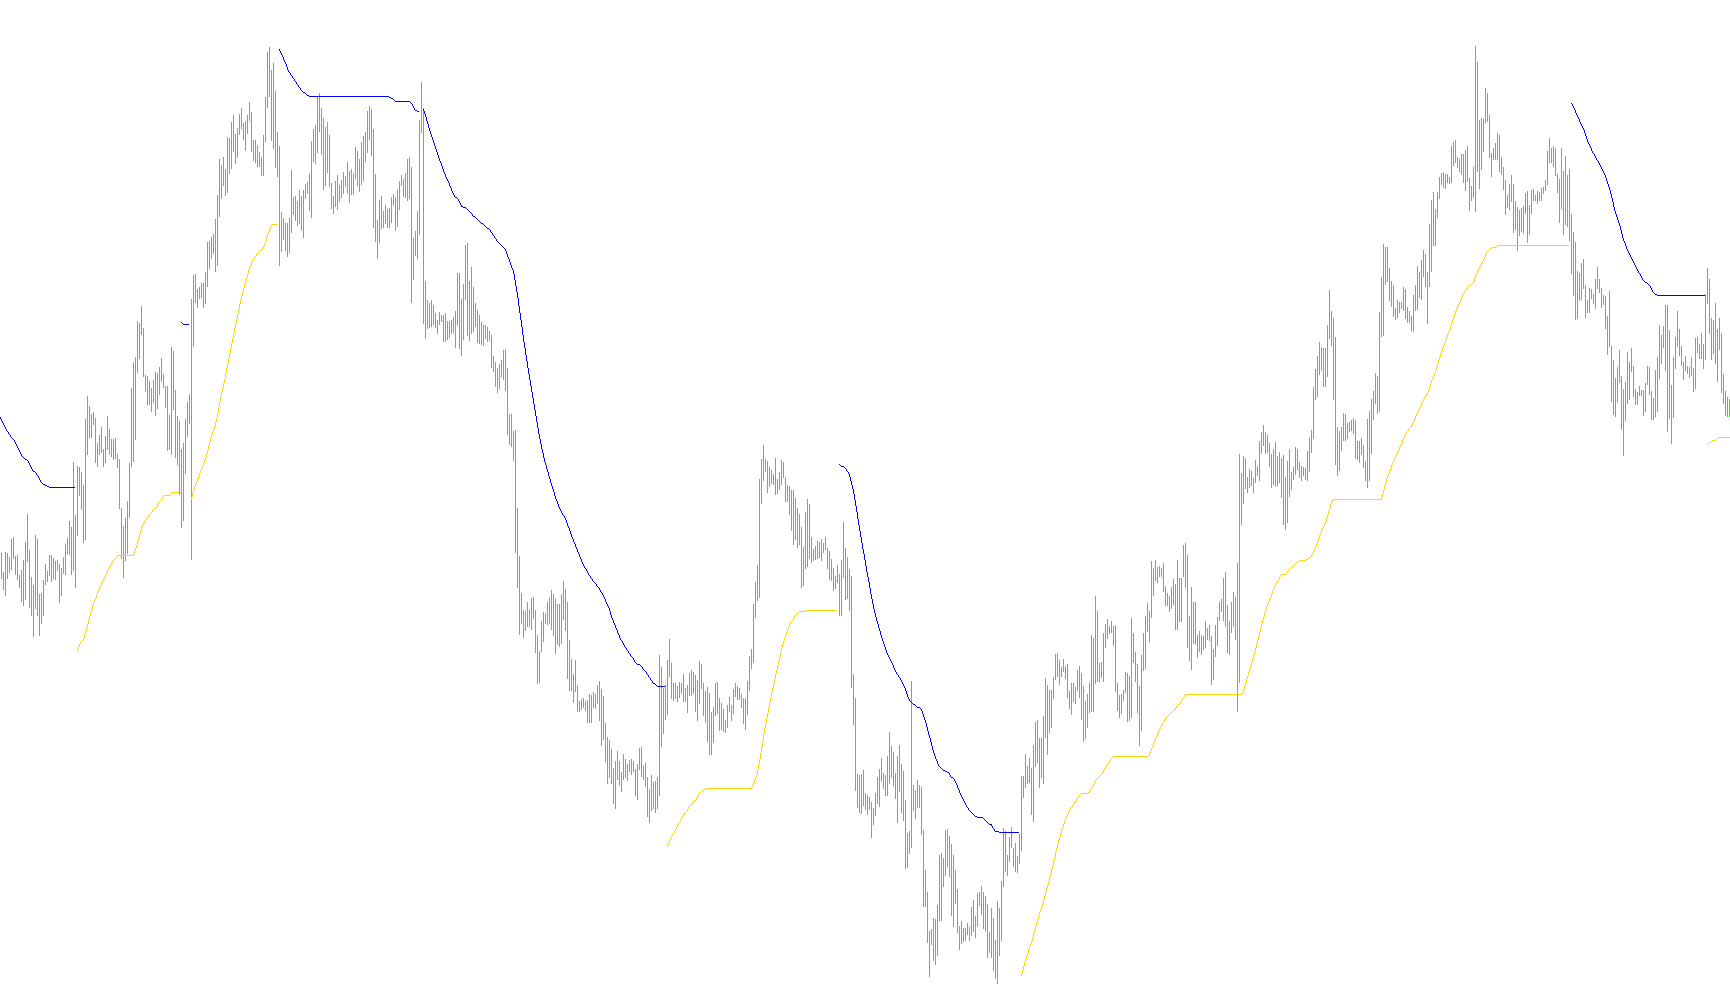
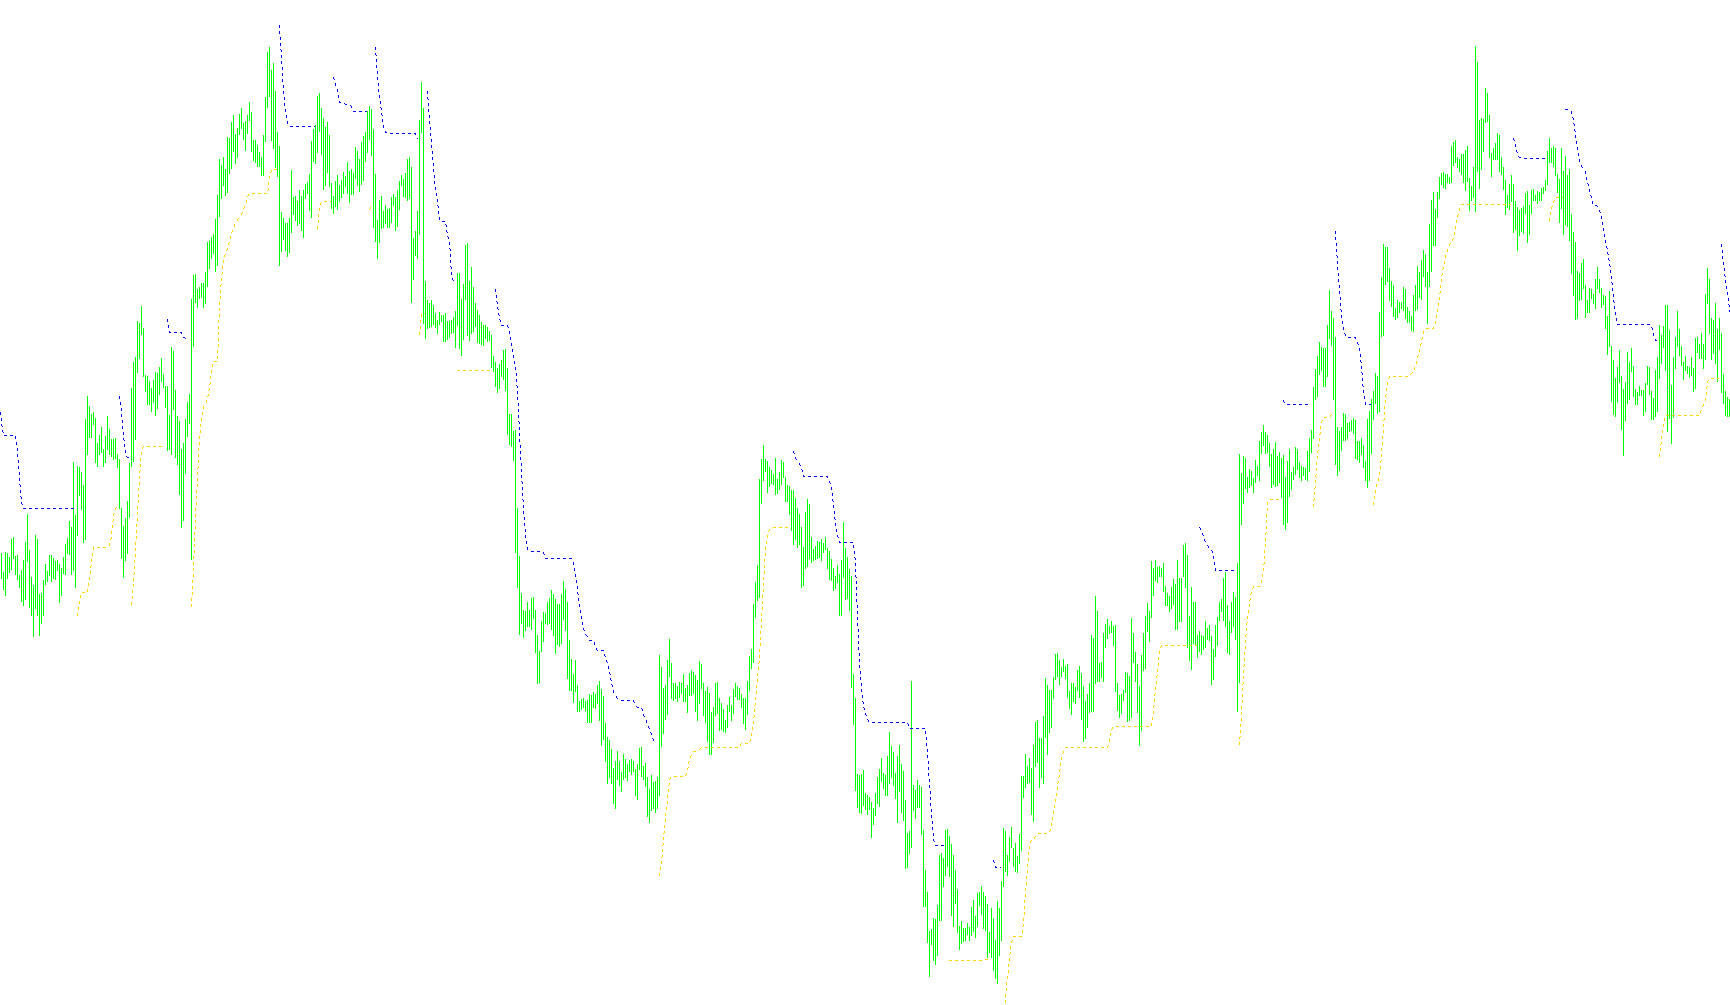
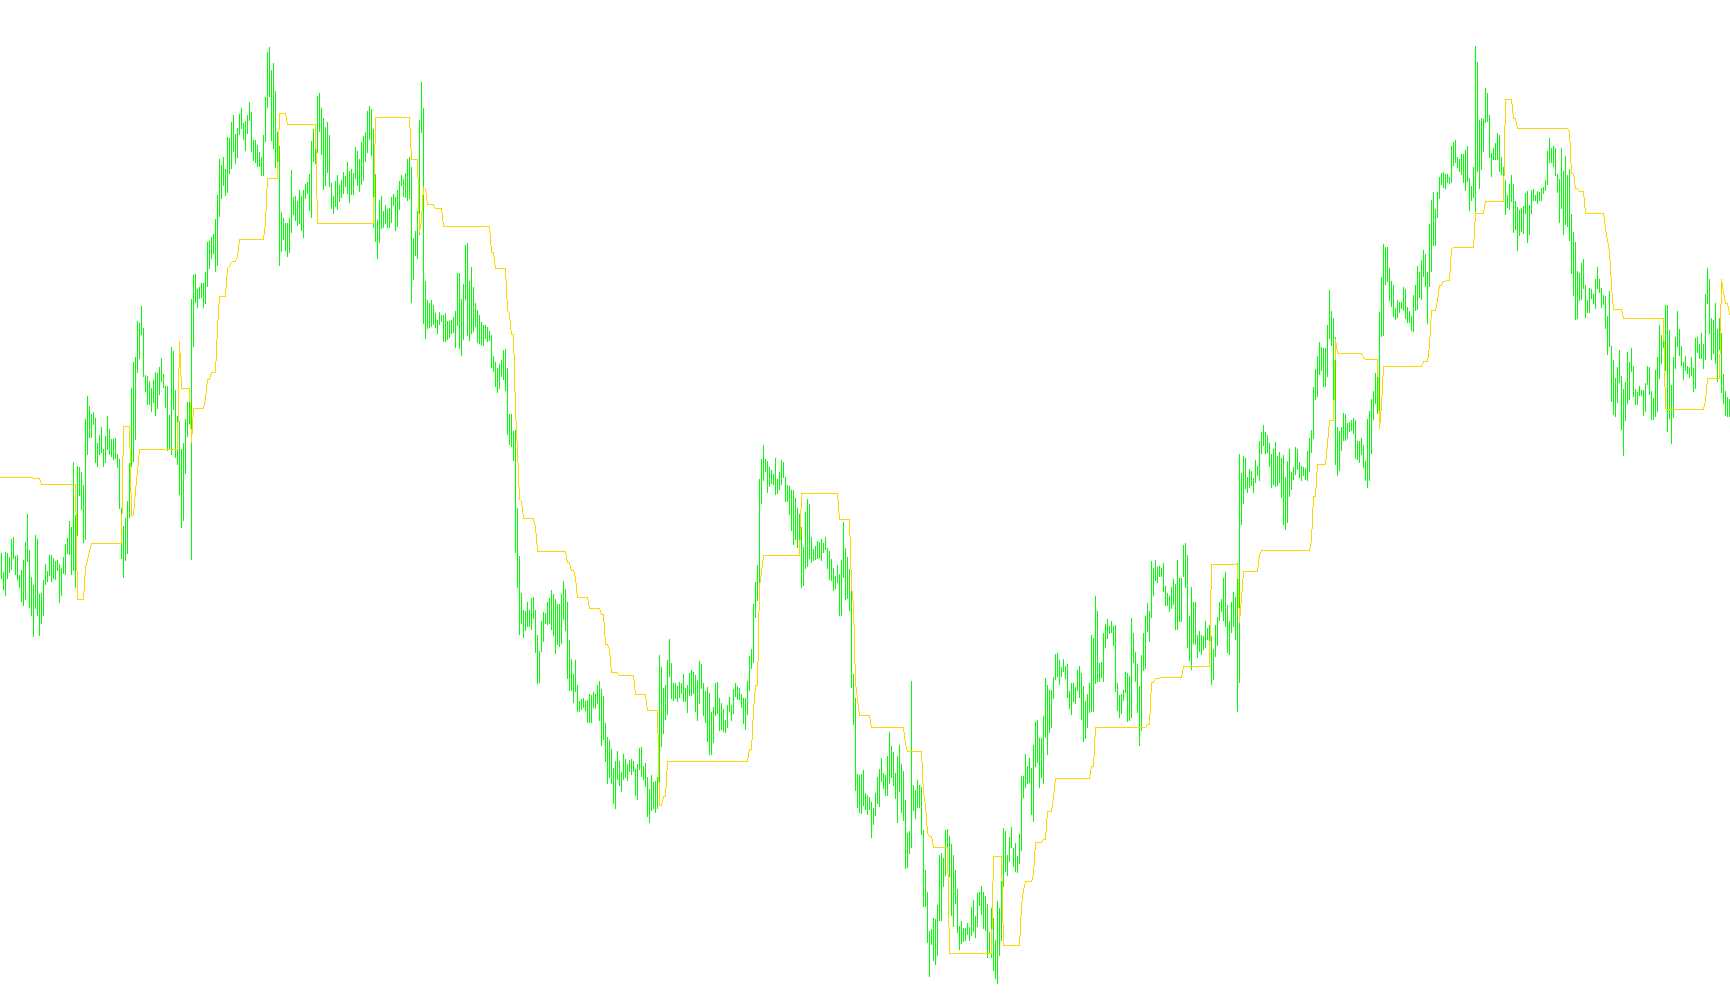
Synergy_RangeFactor
Indicator

Synergy_RangeFactor

iATRiMA

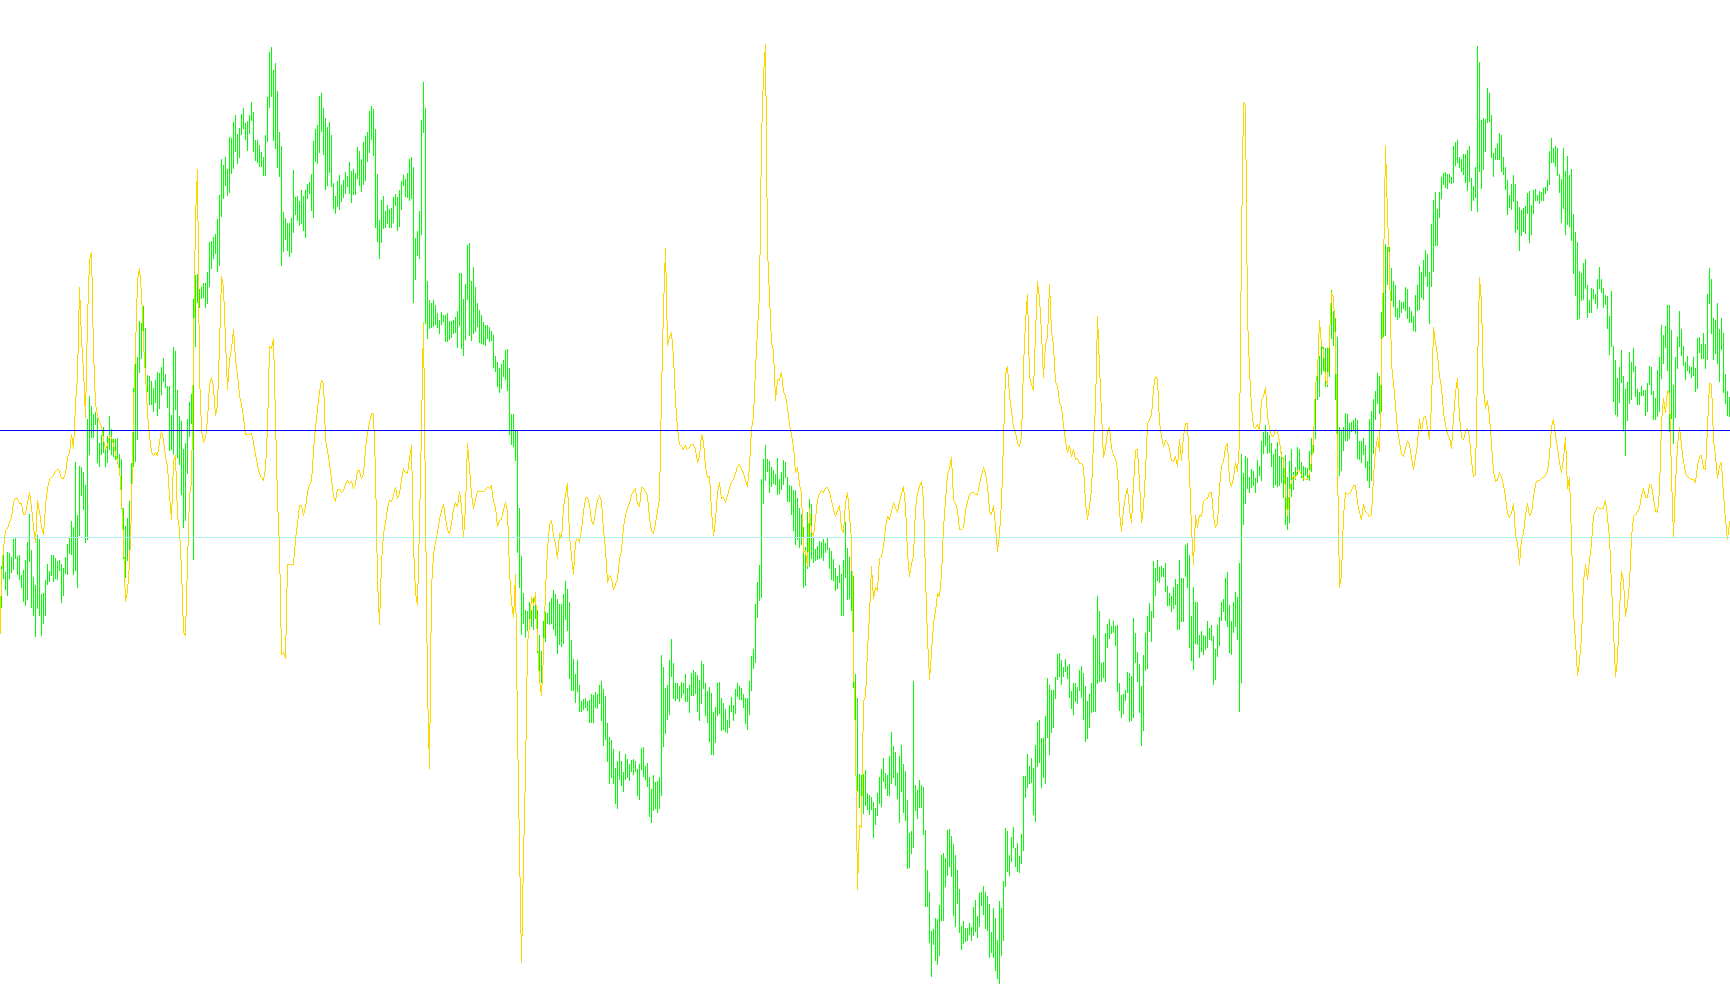
This indicator quantifies price momentum by calculating the normalized distance between short-term and long-term linear weighted moving averages, adjusted by volatility metrics to identify cyclical extremes.

syst_ ao_sto__m260_sig_alert1.2
Indicator

syst_ ao_sto__m260_sig_alert1.2

iAOiATRiStochastic

This indicator identifies bullish and bearish entries by detecting Stochastic %K crosses relative to predefined overbought/oversold levels, paired with price action momentum and specific Awesome Oscillator reversal patterns for exits.

T3 crosses
Indicator

T3 crosses

iATRiMA

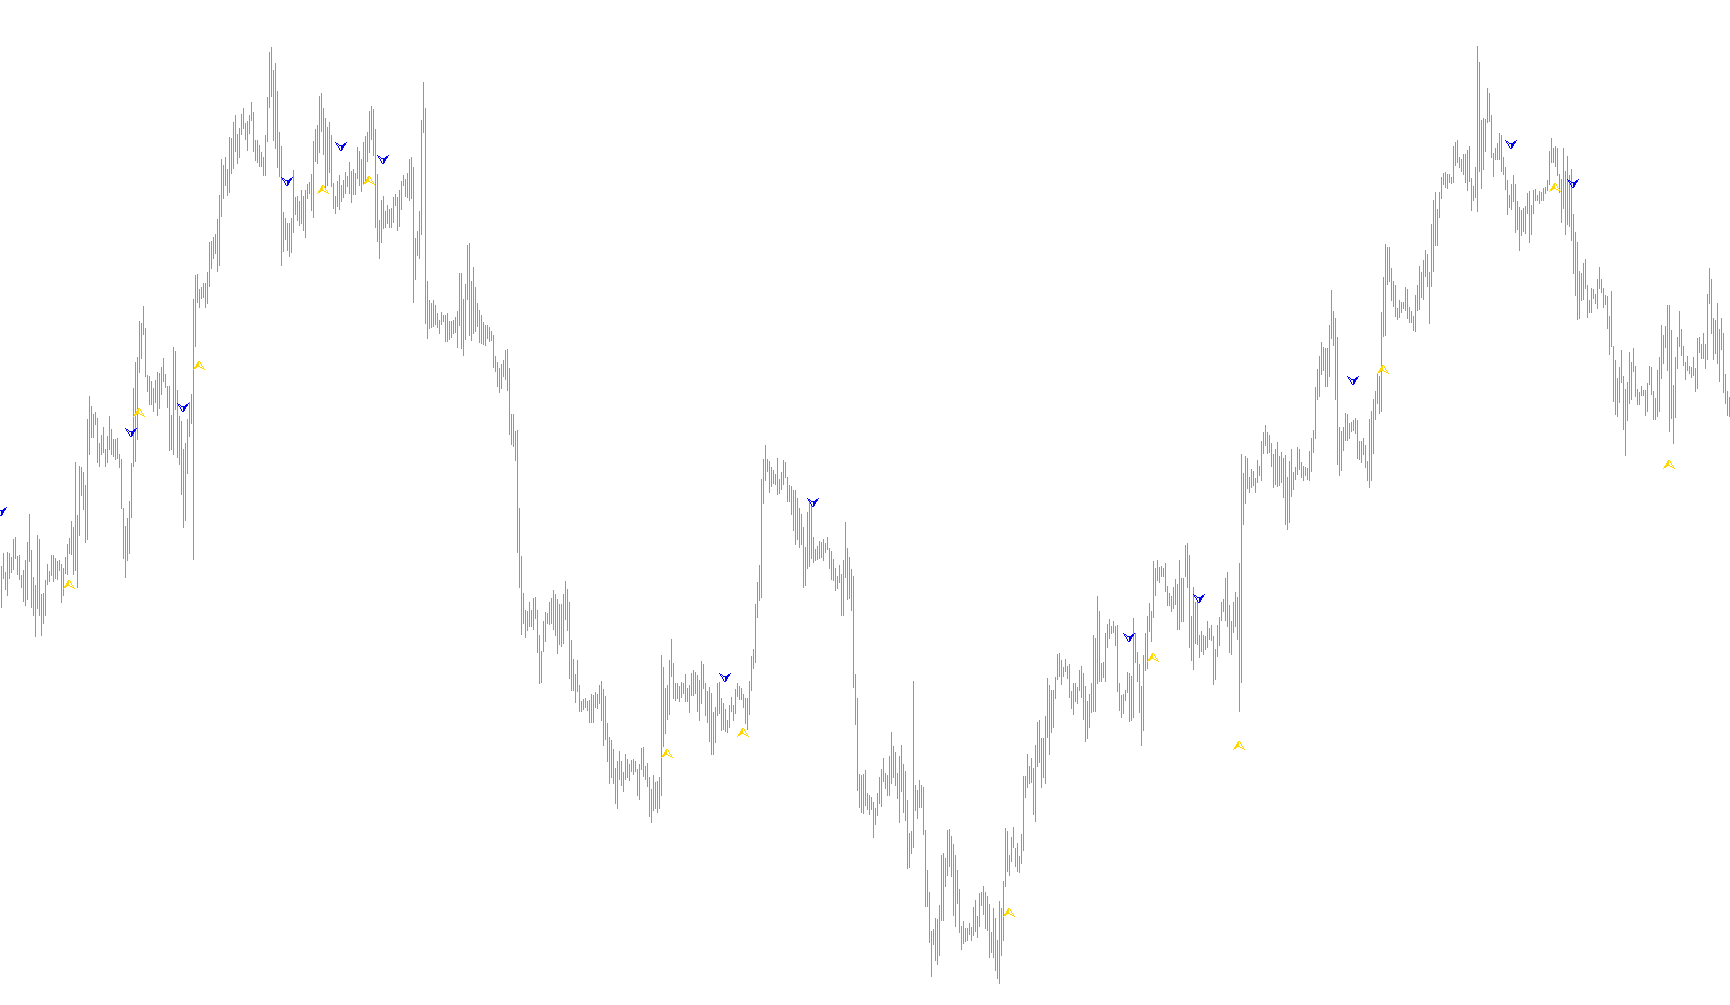
This indicator identifies momentum shifts by detecting precise crossover points between two smoothed T3 moving averages and plotting visual markers at ATR-adjusted price levels.

Indicator

Tabelka_kontrolna_PL

iADiACiAlligatoriFractals
TheClassicTurtleTrader
Indicator

TheClassicTurtleTrader

iATR

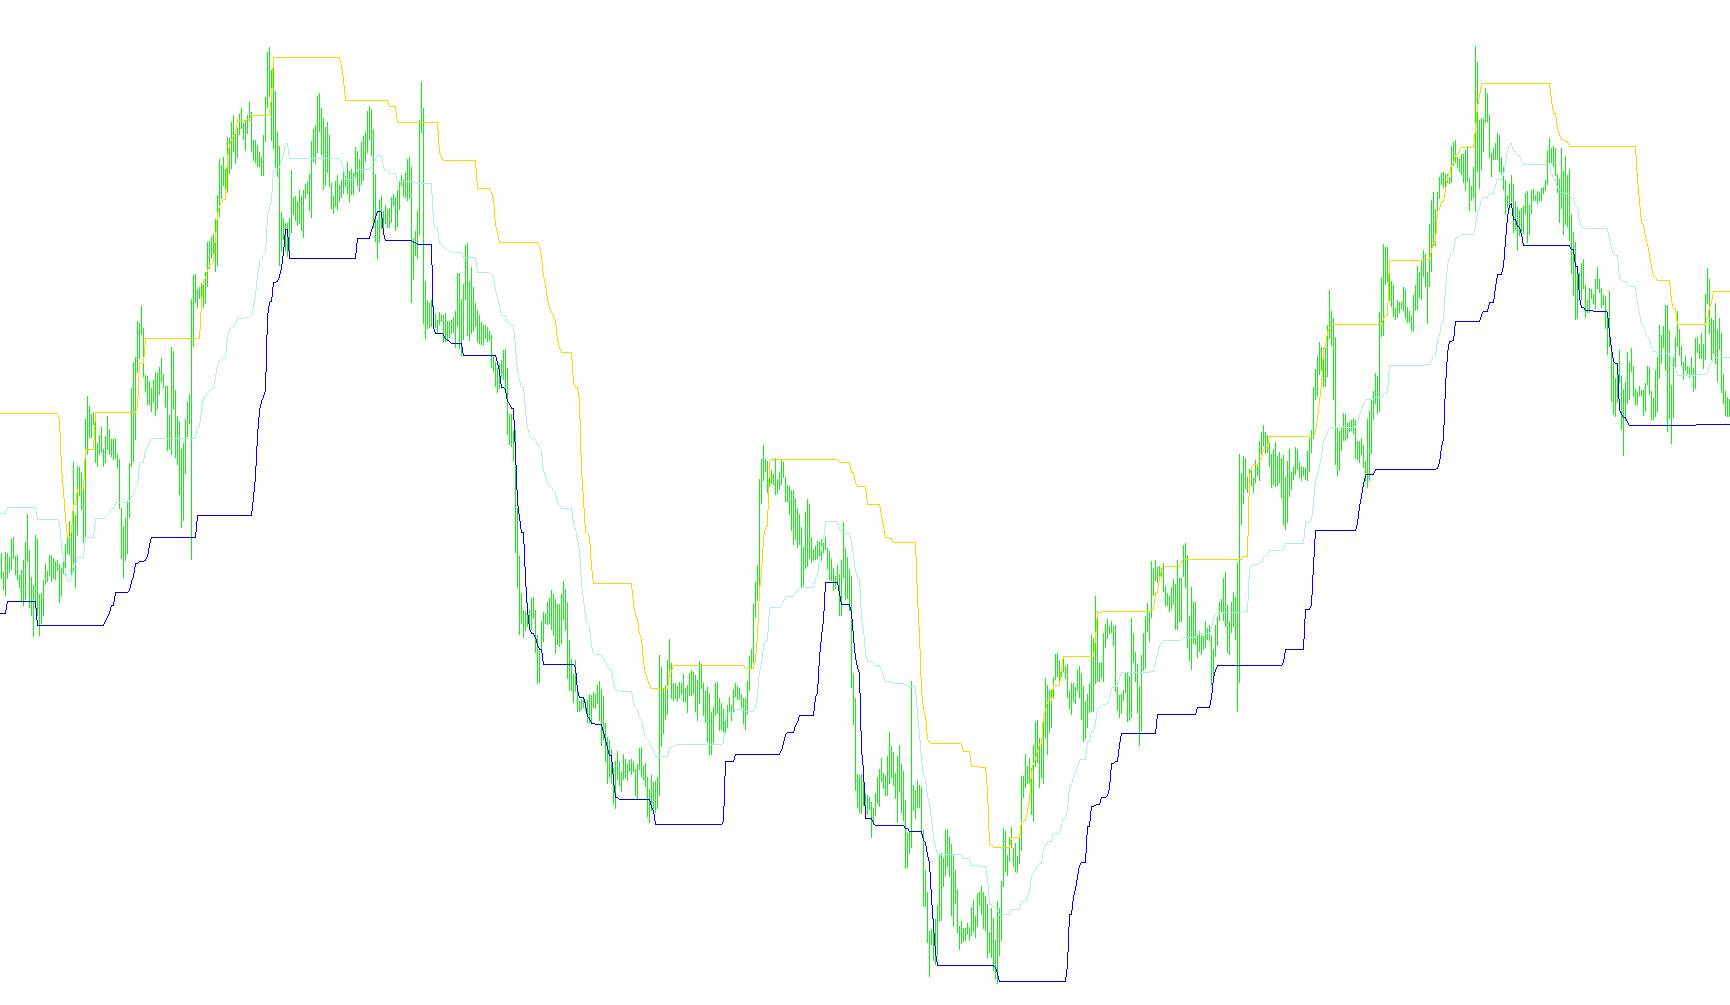
This algorithm identifies trend reversals by detecting price breakouts beyond historical highs and lows while utilizing ATR-based volatility filters for dynamic stop-loss management.

toptahlil_bollinger_and_atr_band
Indicator

toptahlil_bollinger_and_atr_band

iBandsiATR

This indicator synthesizes Bollinger Band boundaries with ATR-based expansion to create a dual-layered volatility channel for identifying extreme price excursions.

to_ind_Adjustable_Trading_Bands
Indicator

to_ind_Adjustable_Trading_Bands

iATR

This indicator constructs a multi-layered volatility band by projecting ATR-adjusted price extremes onto a smoothed historical window to identify significant trend boundaries.

Trailing Stop Loss - Level
Indicator

Trailing Stop Loss - Level

iATRiMAOnArray

This indicator calculates a reactive trailing stop level by dynamically adjusting price buffers based on either a fixed delta or an exponential moving average of the Average True Range.

TrailingByATR
Indicator

TrailingByATR

iATR

This script dynamically adjusts the stop-loss level of an existing position based on the maximum value between two different Average True Range (ATR) periods multiplied by a user-defined coefficient.

TrailingFuncLib
Indicator

TrailingFuncLib

iATRiMA

A comprehensive suite of algorithmic risk management functions that execute dynamic stop-loss adjustments based on fractals, shadows, moving averages, ATR volatility, price channels, and time-based coefficients.

Trend Magic2
Indicator

Trend Magic2

iCCIiATR

This indicator identifies market direction using Commodity Channel Index crossovers and projects dynamic support and resistance levels based on Average True Range volatility.

Trend strength index - Hassler
Indicator

Trend strength index - Hassler

iATRiMAOnArray

This indicator quantifies price velocity by normalizing the absolute difference between current and lagged closing prices against a dynamic Average True Range.

TrendEnvelopes_v1
Indicator

TrendEnvelopes_v1

iATRiMA

This indicator identifies structural momentum by projecting boundary offsets from a moving average and capturing trend reversals via price breaches of these evolving volatility levels.

TrendEnvelopes_v1[1].1
Indicator

TrendEnvelopes_v1[1].1

iATRiMA

This indicator identifies directional shifts by monitoring price breaches of moving average extremes and plotting trailing trend boundaries.

TrendEnvelopes_v1_Alert
Indicator

TrendEnvelopes_v1_Alert

iATRiMA

This indicator identifies momentum shifts by monitoring price breakouts against a moving average variance band, utilizing recursive trend persistence to filter noise and generate entry signals.

TrendEnvelopes_v1_v1
Indicator

TrendEnvelopes_v1_v1

iATRiMA

This indicator identifies directional shifts by tracking price breakouts relative to moving average boundaries and utilizes an ATR-based signal mechanism to pinpoint trend reversals.

TrendEnvelopes_v1_v3
Indicator

TrendEnvelopes_v1_v3

iATRiMA

This indicator identifies trend direction by monitoring price breakouts relative to an expanding moving average corridor and plots trailing support or resistance levels based on recursive extremes.

TrendEnvelopes_v2
Indicator

TrendEnvelopes_v2

iATRiMA

The indicator identifies market direction by monitoring price breaches of moving average deviations and plots trailing support/resistance levels based on previous local extremes.

TrendEnvelopes_v2Alert
Indicator

TrendEnvelopes_v2Alert

iATRiMA

This indicator identifies momentum shifts by monitoring price breaches of percentage-based volatility bands derived from a smoothed moving average.

TrendEnvelopes_v2_v1
Indicator

TrendEnvelopes_v2_v1

iATRiMA

This indicator identifies market momentum by plotting dynamic price boundaries based on moving average deviations and tracking trend reversals via price breaches of these envelopes.

Indicator

TrendPower

iATRiMA
Indicator

TrendPower_v1

iATRiMA
Indicator

TrendPower_v2

iATRiMA
TriggerLines_SigAlertEmailSounds_cw
Indicator

TriggerLines_SigAlertEmailSounds_cw

iATR

This indicator identifies trend reversals by calculating the intersection of a weighted momentum value against a Linear Smoothed Moving Average (LSMA).

TriggerLines_SigAlertEmailSounds_sw
Indicator

TriggerLines_SigAlertEmailSounds_sw

iATR

This indicator identifies trend reversals by monitoring the crossover between a weighted linear moving average and its secondary smoothed velocity component.

Indicator

Triniti

iATRiMA
True Range Bands
Indicator

True Range Bands

iATR

This indicator projects dynamic price envelopes by calculating a weighted mean price and applying asymmetric ATR-based offsets relative to the current closing position.

TSSuperTrend
Indicator

TSSuperTrend

iATRiMA

This indicator identifies market direction by synthesizing various moving average smoothing techniques with ATR-based volatility offsets and specialized dual-thrust calculations.

TSSuperTrendSTS
Indicator

TSSuperTrendSTS

iATRiMA

This indicator dynamically maps market direction by calculating a smoothed price baseline adjusted by either ATR-based volatility or Dual Thrust range expansions to identify trend flips.

Ultimate_MA
Indicator

Ultimate_MA

iATRiMAOnArray

This indicator calculates a weighted moving average by combining three distinct timeframes and normalizing them against their respective Average True Range (ATR) values to balance price momentum and market volatility.

Ultimate_Oscillator
Indicator

Ultimate_Oscillator

iATRiMAOnArray

This indicator synthesizes multi-period price distance from the minimum low normalized by Average True Range to quantify momentum volatility.

Ultra
Indicator

Ultra

iATRiMAiRSI

This indicator synthesizes Fibonacci, Prime, and Standard pivot calculations with RSI momentum tracking and ATR-based volatility scaling to identify structural price levels.

UOSA
Indicator

UOSA

iATRiMAOnArray

This indicator quantifies market momentum by aggregating weighted moving averages of price-to-low distances normalized against multi-period Average True Ranges.

Volatility Pivot
Indicator

Volatility Pivot

iATRiMAOnArray

This indicator calculates a responsive price boundary by dynamically adjusting an offset based on smoothed ATR values or fixed point increments to track market structural shifts.

Volatility.Pivot
Indicator

Volatility.Pivot

iATRiMAOnArray

The indicator tracks market equilibrium by dynamically adjusting a trailing stop based on the product of smoothed Average True Range and a multiplier factor.

Volatility.Pivot_002
Indicator

Volatility.Pivot_002

iATRiMAOnArray

This indicator calculates a reactive price boundary that adjusts based on smoothed ATR fluctuations and price momentum to define trailing liquidity zones.

Volatility.Pivot_v1
Indicator

Volatility.Pivot_v1

iATRiMAOnArray

This indicator calculates a reactive trailing stop by adjusting price levels based on an Exponential Moving Average of the Average True Range to dynamically capture momentum shifts.

Volatility.Pivot_v3
Indicator

Volatility.Pivot_v3

iATRiMAOnArray

This indicator dynamically projects a trailing price threshold by calculating a variable offset based on smoothed Average True Range fluctuations and price breakout polarity.

Volatility_Pivot
Indicator

Volatility_Pivot

iATRiMAOnArray

The algorithm calculates a price-action buffer based on smoothed Average True Range to establish an adaptive trailing stop level that reacts to price fluctuations and volatility shifts.

Indicator

Volatility_Pivot_AplPrice_mtf

iATRiMAiMAOnArray
Indicator

Volatility_Pivot_mtf

iATRiMAOnArray
VolATR
Indicator

VolATR

iATRiMAOnArray

This indicator calculates a moving average of the Average True Range to identify underlying market volatility trends.

Indicator

VoltyChannel_Stop

iATRiMA
VoltyChannel_Stop_v1
Indicator

VoltyChannel_Stop_v1

iATR

This indicator identifies trend reversals and trailing stop levels by dynamically expanding price boundaries based on Average True Range (ATR) fluctuations and recursive minimum/maximum tracking.

VoltyChannel_Stop_v1M
Indicator

VoltyChannel_Stop_v1M

iATR

This indicator calculates dynamic support and resistance levels based on Average True Range to plot trailing stop boundaries and trend reversal signals.

VoltyChannel_Stop_v2.1
Indicator

VoltyChannel_Stop_v2.1

iATRiMA

Identifies trend reversals and dynamic trailing stop levels by calculating price envelopes based on weighted moving averages and ATR-derived volatility multipliers.

VoltyChannel_Stop_v2.1M
Indicator

VoltyChannel_Stop_v2.1M

iATRiMA

This indicator identifies trend shifts by monitoring price breaches of ATR-based volatility envelopes and generates dynamic trailing stop levels that adjust to market expansion.

VoltyChannel_Stop_v2.1M_v1
Indicator

VoltyChannel_Stop_v2.1M_v1

iATRiMA

This indicator identifies trend reversals by monitoring price breaches of an ATR-based volatility envelope and projects non-repainting trailing stop levels based on momentum shifts.

VoltyChannel_Stop_v2.1_001
Indicator

VoltyChannel_Stop_v2.1_001

iATRiMA

This indicator calculates trend reversals by tracking price breaches of ATR-based volatility bands and generates trailing stop levels that contract based on market fluctuations.

VoltyChoppy_v1
Indicator

VoltyChoppy_v1

iATR

This indicator categorizes market momentum into four distinct states of strength and volatility by comparing price action against multi-layered ATR-based expansion bands.