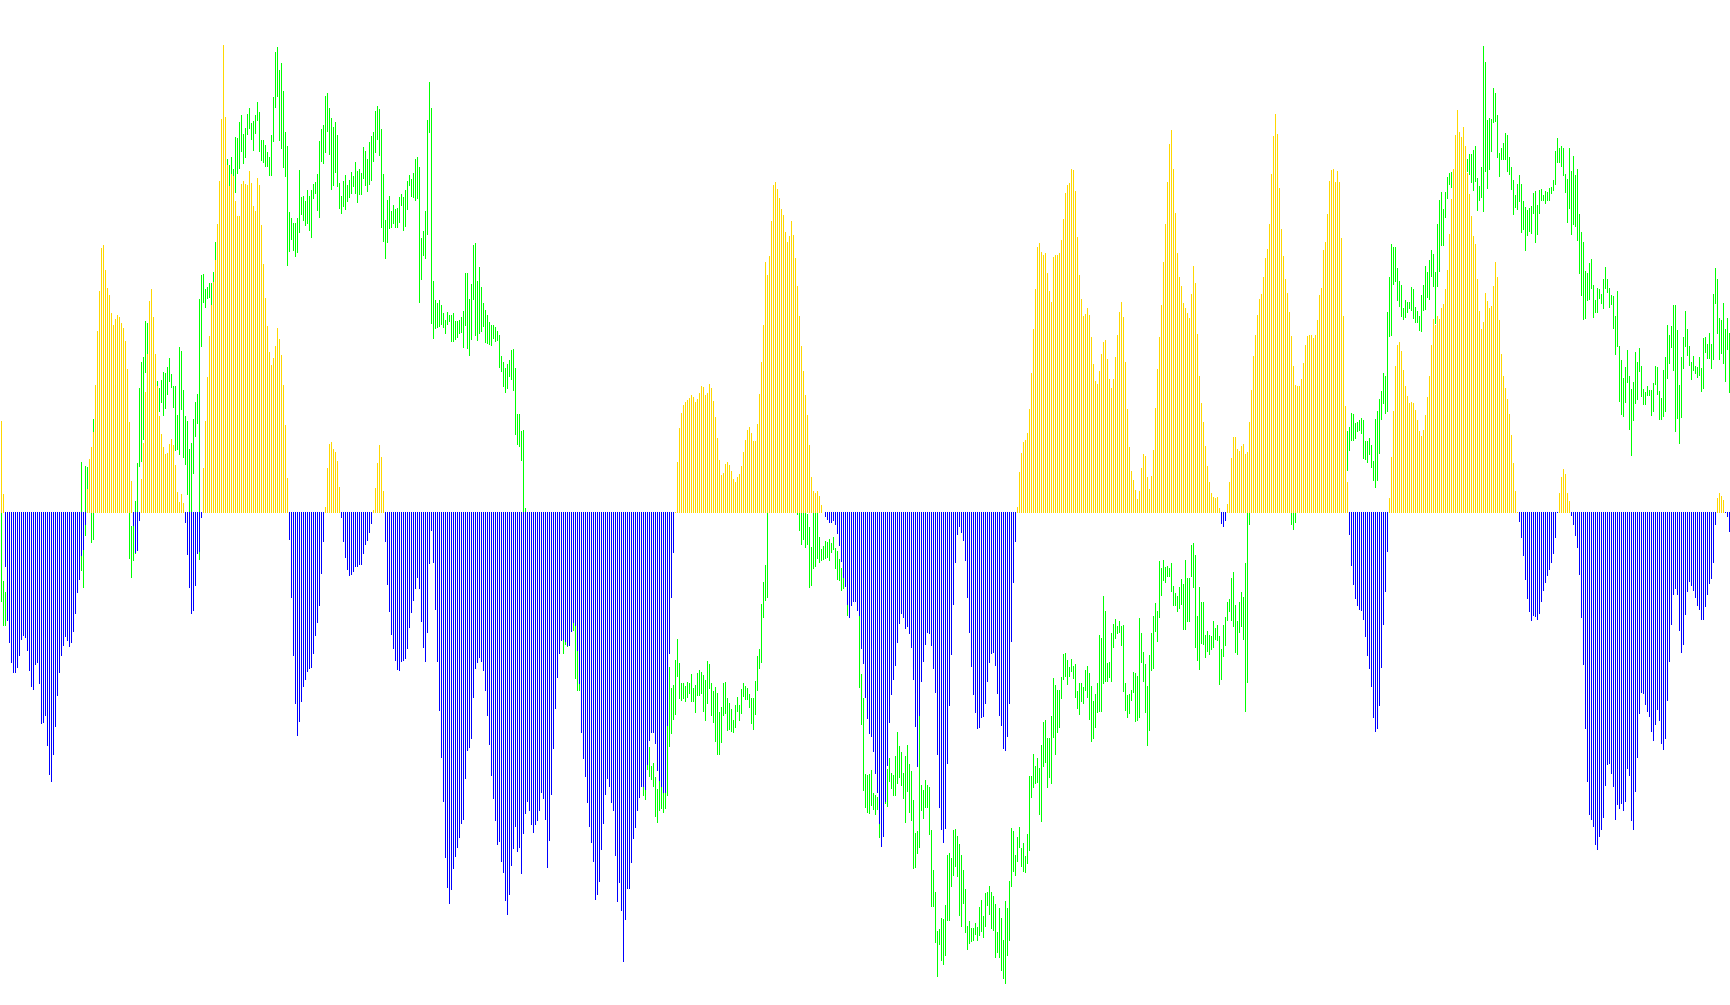
RAVI_FX_Fisher2
Indicator

RAVI_FX_Fisher2

iATRiMA

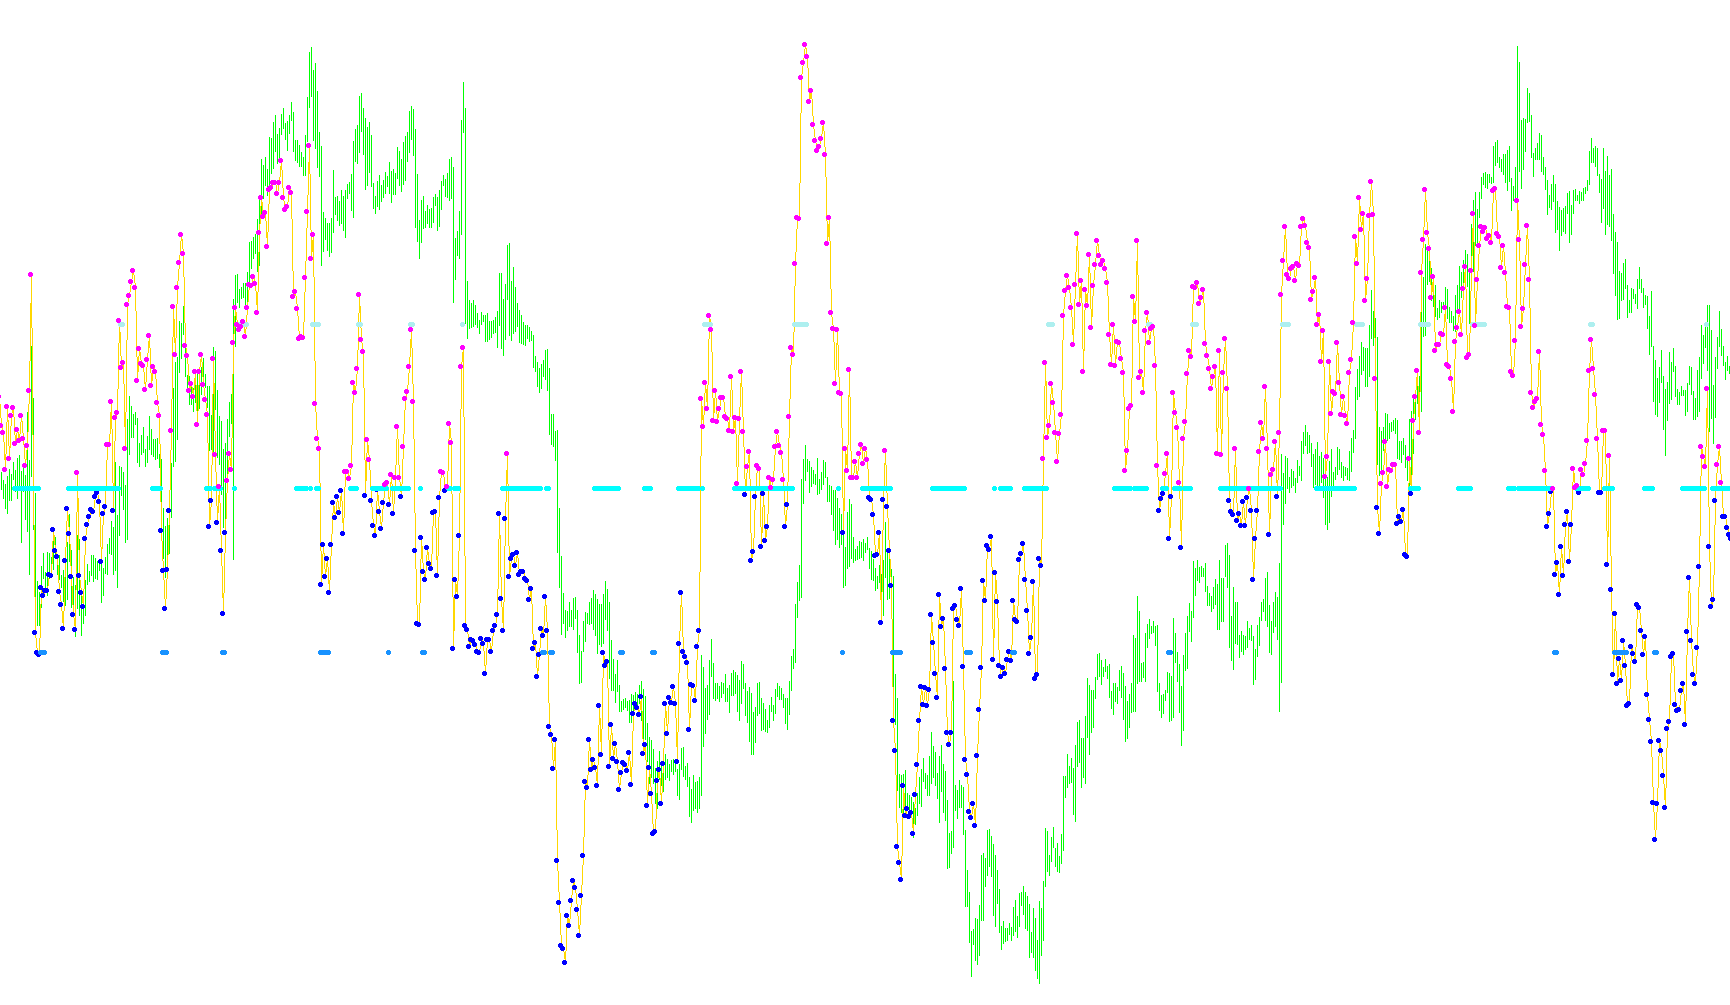
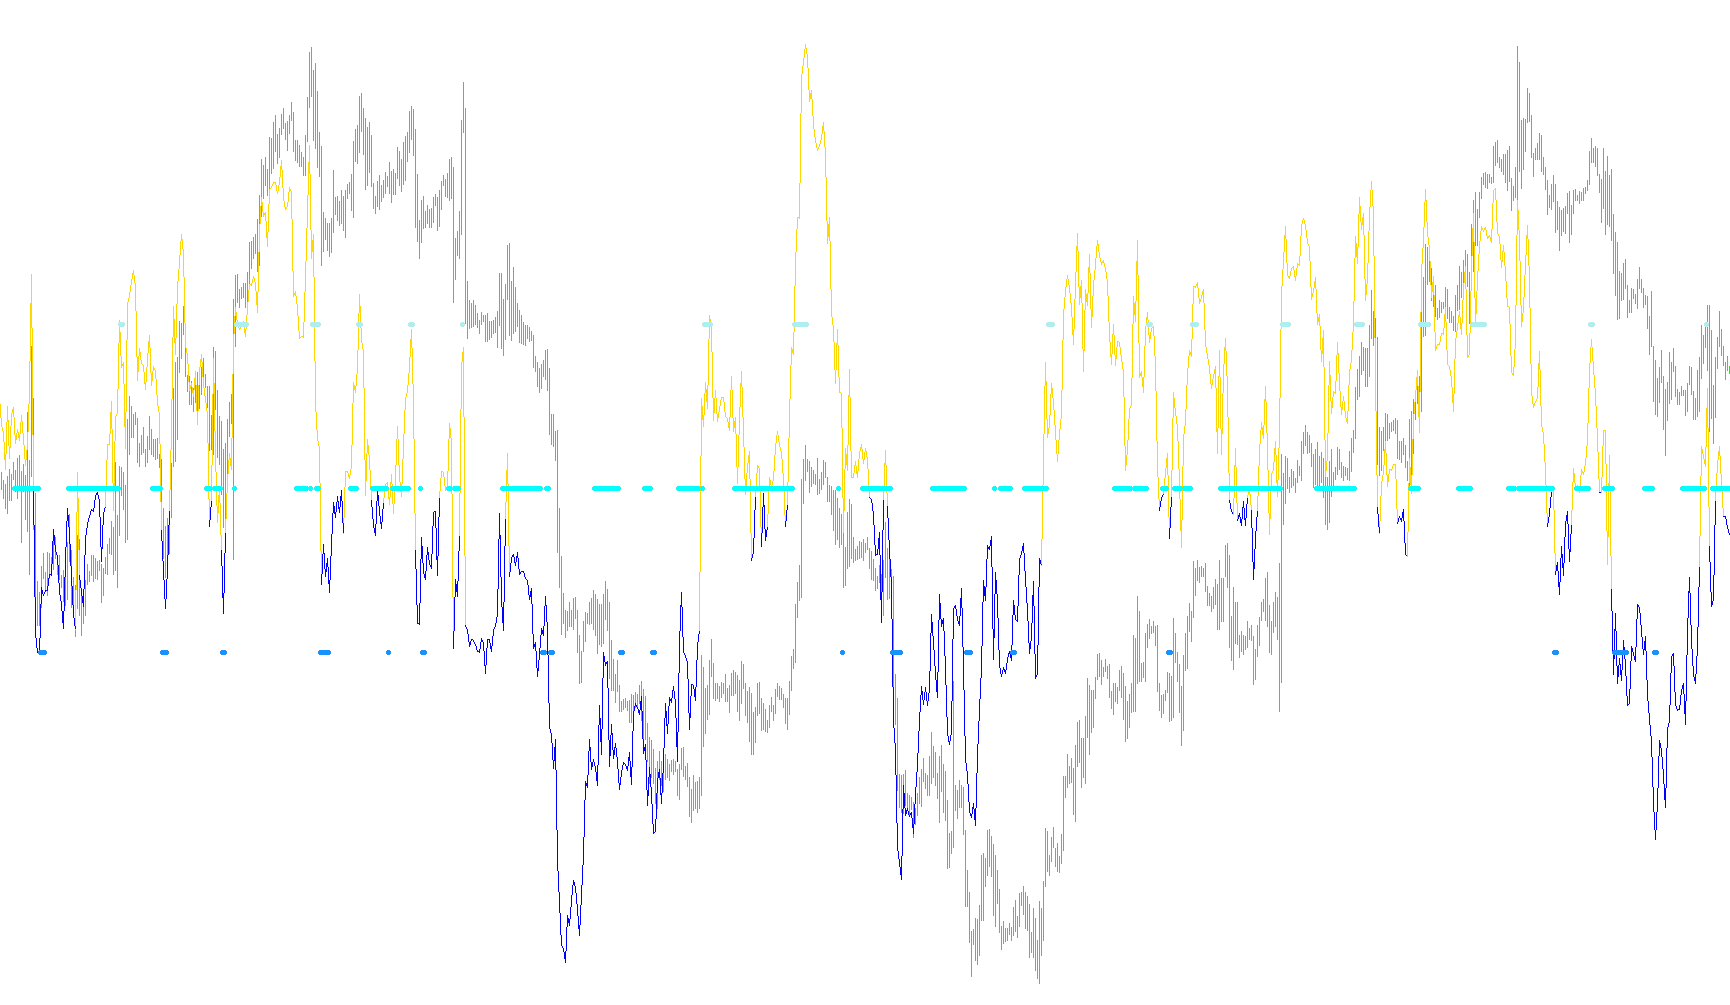
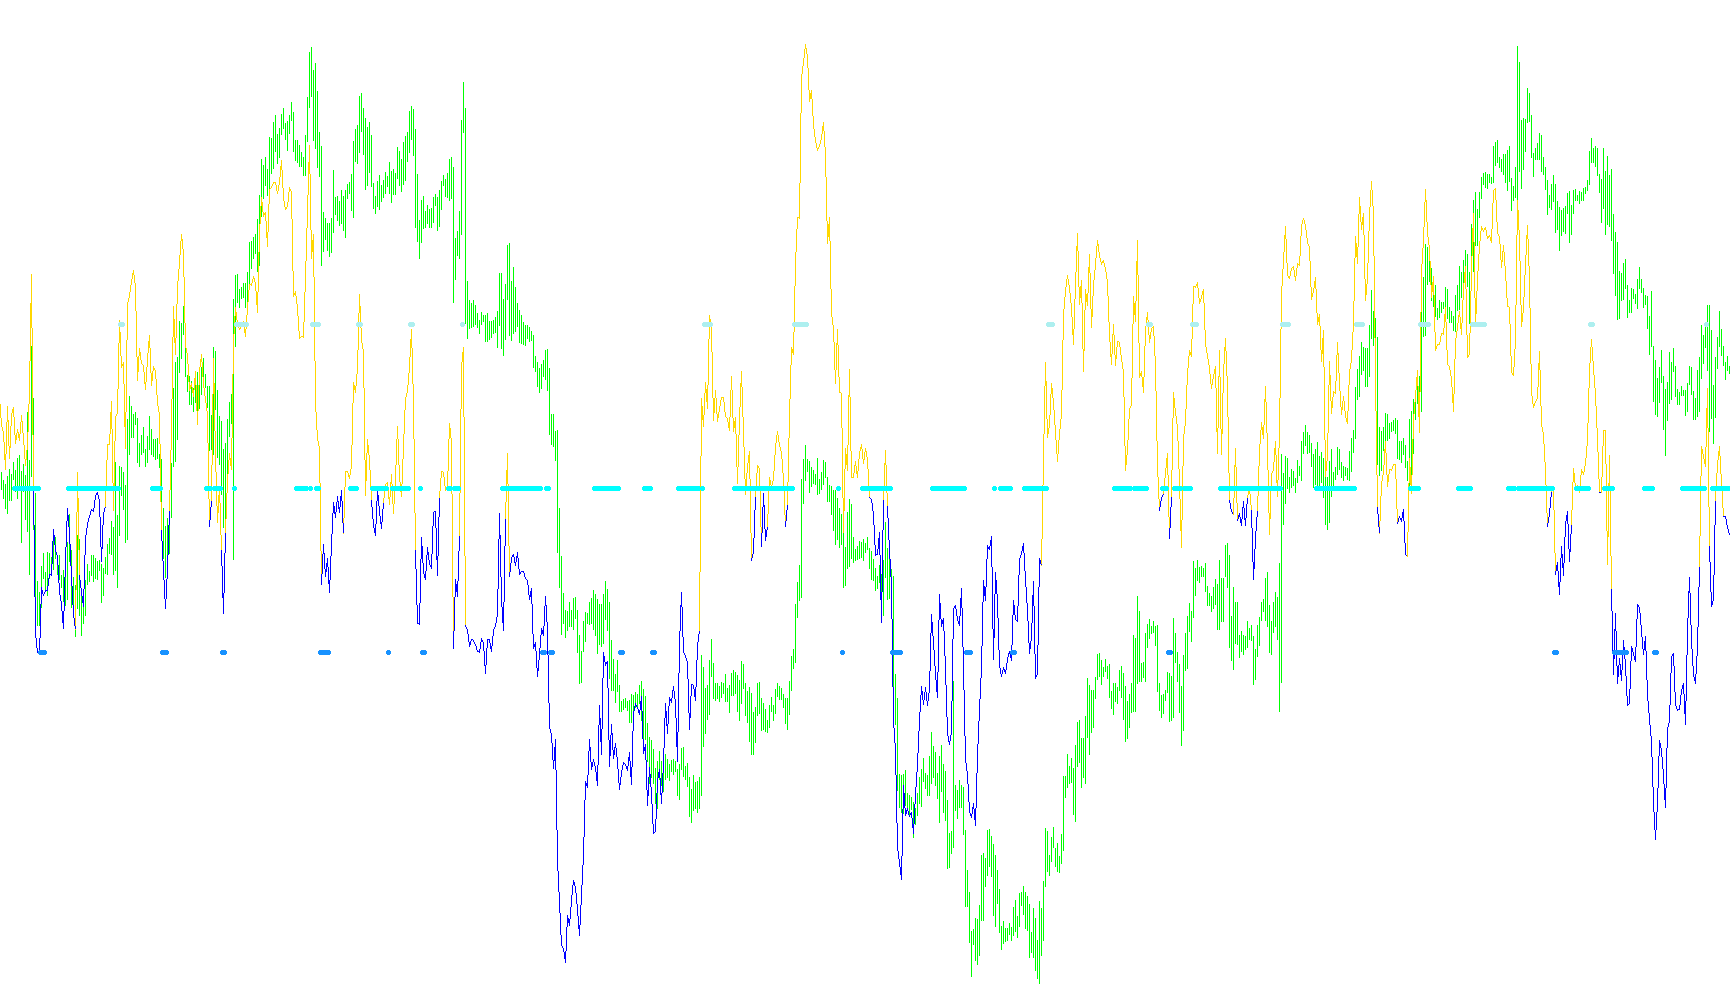
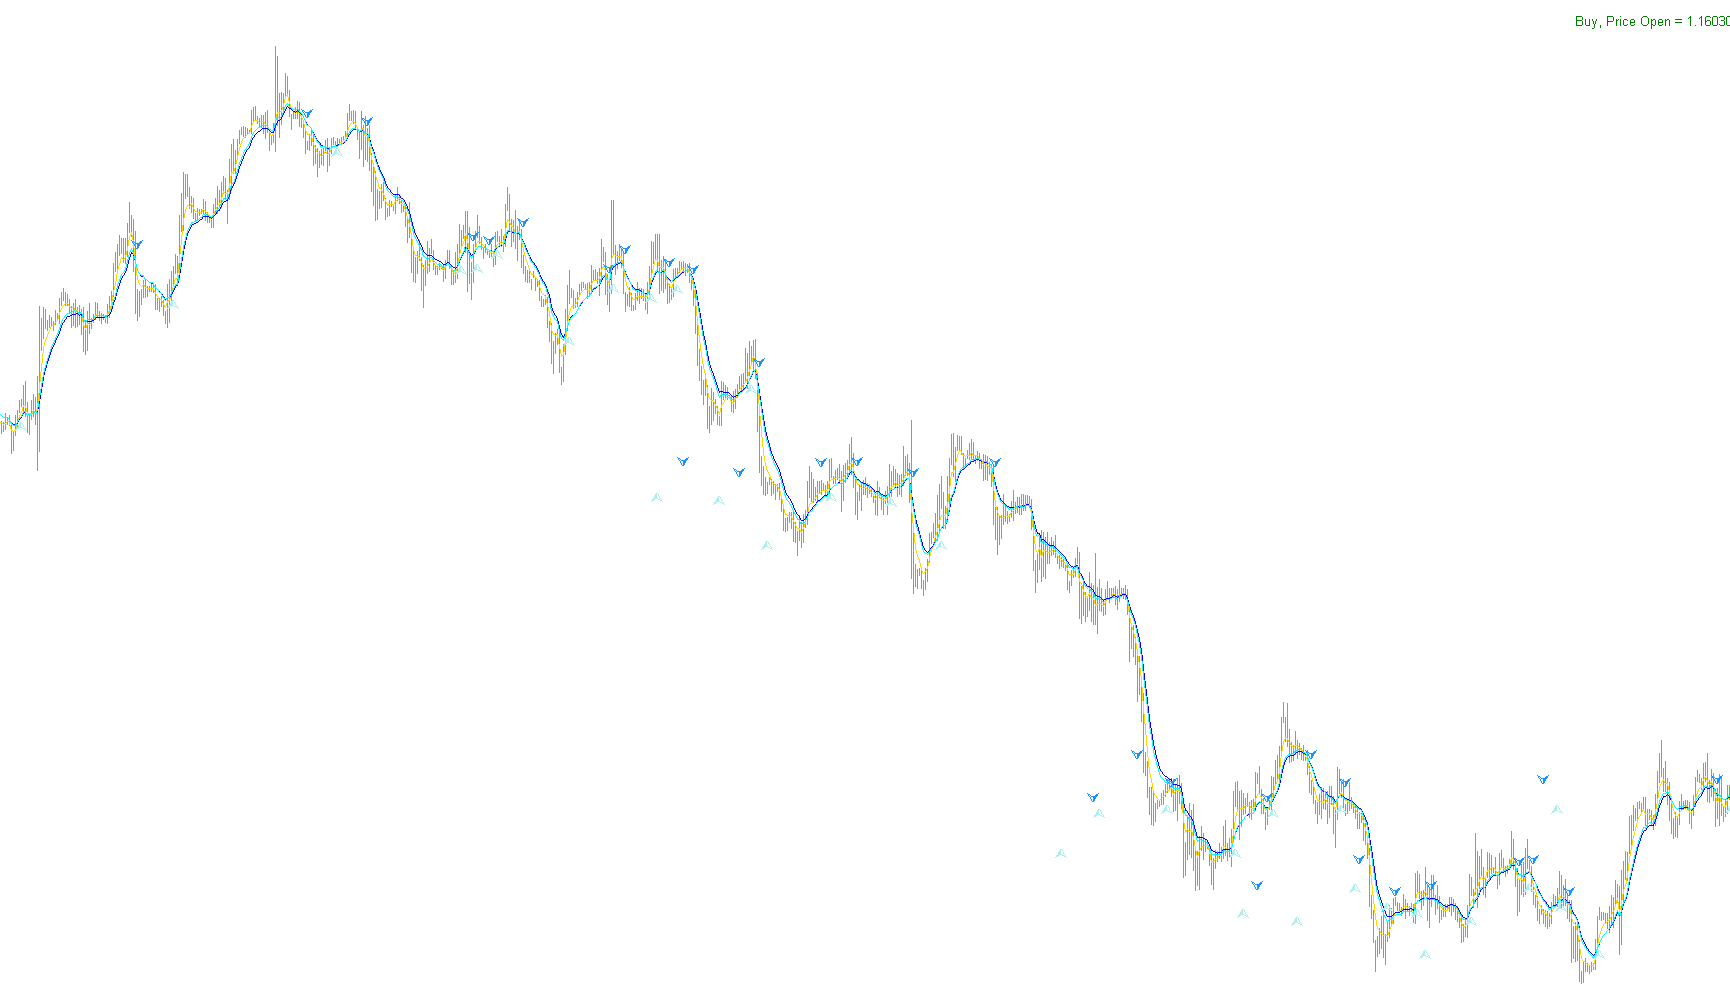
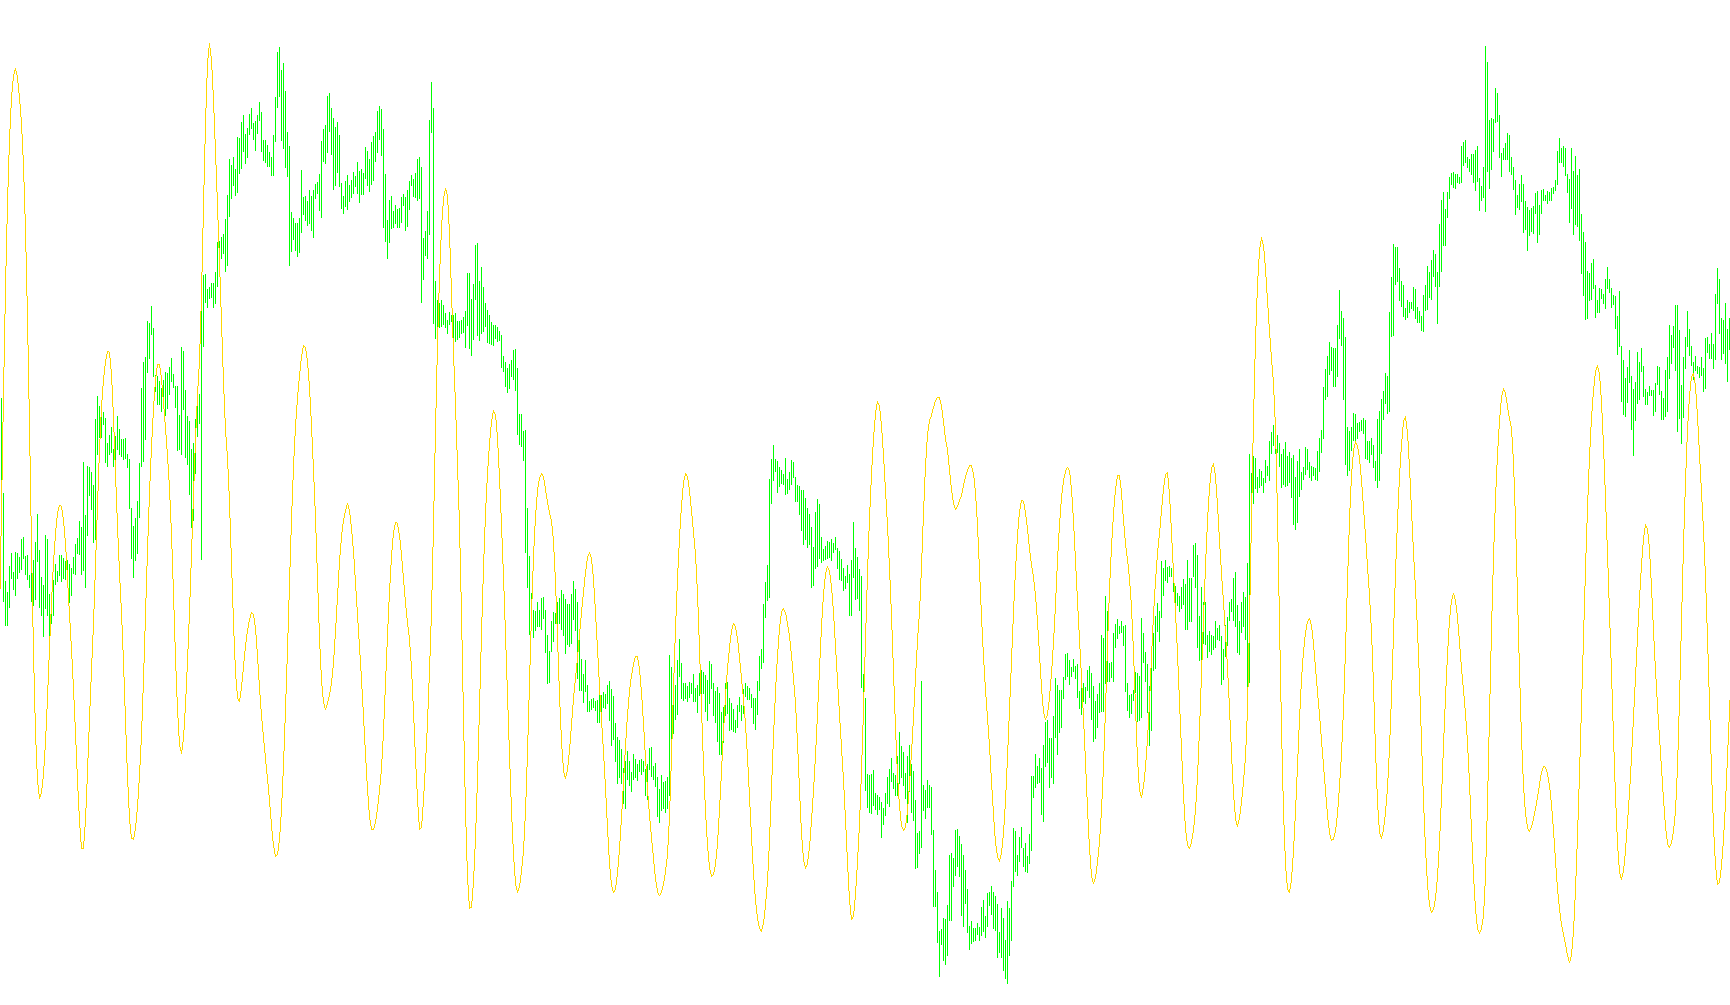
This indicator quantifies market momentum by calculating the relative difference between a fast and slow linear weighted moving average, normalized by the average true range and optionally processed through an Inverse Fisher Transform.
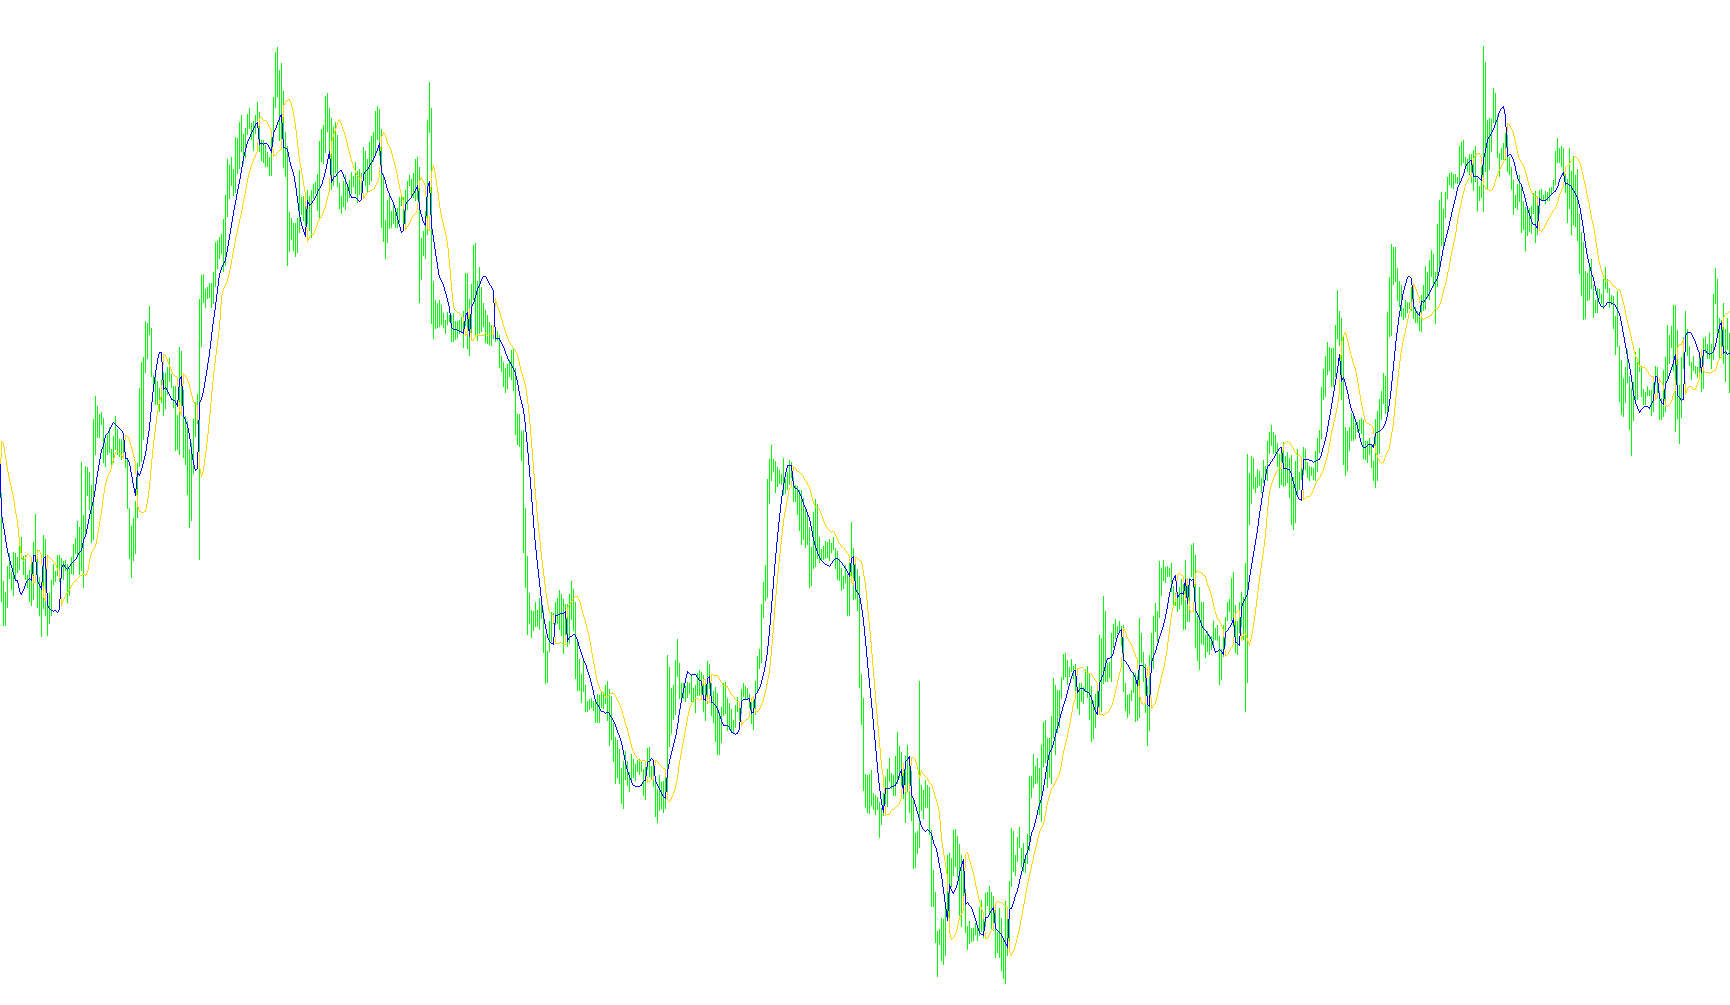
RES-SUP
Indicator

RES-SUP

iATR

This indicator identifies key support and resistance levels by calculating the arithmetic mean of previous daily candles and projecting Fibonacci retracement offsets.

RES-SUP_v1
Indicator

RES-SUP_v1

iATR

The indicator identifies primary support and resistance levels by calculating the geometric mean of previous daily price action adjusted by Fibonacci retracement ratios.

RK_MindHero mail
Indicator

RK_MindHero mail

iATR

This indicator identifies trend reversals by calculating a weighted True Range volatility threshold to detect breakouts from price extremes.

RSI-TC
Indicator

RSI-TC

iBandsiATRiMAiRSI

This indicator identifies high-probability trend reversals by detecting Bollinger Band contractions (squeezes) followed by price breakouts in alignment with multi-colored RSI momentum shifts.

RSI-TC_001
Indicator

RSI-TC_001

iBandsiATRiMAiRSI

This indicator identifies high-probability reversal points by combining a dual-tone RSI filter with Bollinger Band volatility squeezes and Keltner Channel expansion signals.

RSI-TC_NEW
Indicator

RSI-TC_NEW

iBandsiATRiMAiRSI

This indicator identifies explosive market entries by detecting volatility compression between Bollinger Bands and Keltner Channels, filtered by dual-tone RSI momentum and directional band breakouts.

RSI-TC_NEW1
Indicator

RSI-TC_NEW1

iBandsiATRiMAiRSI

This indicator identifies high-probability trend reversals by detecting volatility expansion from a 'squeeze' state combined with multi-layered RSI momentum filtering.

RSI-TC_NEWd
Indicator

RSI-TC_NEWd

iBandsiATRiMAiRSI

This indicator identifies high-probability trend reversals by detecting price volatility compression using a Bollinger Band and Keltner Channel squeeze, coupled with RSI momentum filtering to trigger directional signals.

RSI-TC_NEW[1]
Indicator

RSI-TC_NEW[1]

iBandsiATRiMAiRSI

This indicator identifies high-probability momentum shifts by detecting price breakouts from low-volatility Keltner Channel squeezes while filtering directionality through a dual-tone Relative Strength Index.

RSI-TC_NEW_Alert2
Indicator

RSI-TC_NEW_Alert2

iBandsiATRiMAiRSI

This indicator identifies high-probability trend reversals by detecting price volatility compression (Squeeze) and validating breakouts through RSI momentum shifts and Bollinger Band expansions.

RSI-TC_NEW_v2
Indicator

RSI-TC_NEW_v2

iBandsiATRiMAiRSI

This indicator identifies high-probability trend continuations by detecting volatility 'squeezes' through Bollinger Band and Keltner Channel convergence, filtered by RSI momentum shifts.

RSI-TC_v1
Indicator

RSI-TC_v1

iBandsiATRiMAiRSI

This indicator identifies high-probability entries by synchronizing RSI momentum with the spatial divergence between Bollinger Bands and SuperTrend volatility envelopes.

Rsi_Bands_B
Indicator

Rsi_Bands_B

iATRiRSI

This indicator projects asymmetrical price corridors by modulating a Moving Average with Weighted RSI values scaled by ATR-based volatility variance.

Rsi_Bands_B2
Indicator

Rsi_Bands_B2

iATRiRSI

This indicator projects dynamic price envelopes by modulating a Moving Average with weighted RSI intensity and ATR-based volatility coefficients.

RSI_channel_sig
Indicator

RSI_channel_sig

iATRiRSI

This indicator identifies trend reversals and momentum shifts by applying a T3 moving average filter to Relative Strength Index values within a dynamic high-low price channel.

RSI_channel_sig_2
Indicator

RSI_channel_sig_2

iATRiRSI

This indicator identifies momentum reversals by applying a T3 smoothing filter to the Relative Strength Index and detecting breaches of dynamically calculated high-low price channels.

RSI_Crossing_50_plus_ATR_ver1.2_FXA0
Indicator

RSI_Crossing_50_plus_ATR_ver1.2_FXA0

iATRiRSI

This indicator identifies trend reversals and position additions by detecting RSI crossings at the 50 midline, using ATR-based volatility to project dynamic entry and stop-loss levels.

rsi_ma_trade_sist
Indicator

rsi_ma_trade_sist

iATRiMAiRSI

This indicator identifies trend reversals by detecting concurrent EMA crossovers and RSI threshold breaches to confirm momentum shifts.

rsi_ma_trade_sist_chart
Indicator

rsi_ma_trade_sist_chart

iATRiMAiRSI

This indicator identifies trend reversals by detecting crossovers between a fast and slow exponential moving average synchronized with Relative Strength Index momentum thresholds.

RWI
Indicator

RWI

iATR

This indicator differentiates between structured directional movement and erratic price noise by quantifying the statistical variance of price displacement against ATR-scaled volatility.

sa#MTEI_Supertrend
Indicator

sa#MTEI_Supertrend

iCCIiATR

This indicator identifies structural trend reversals by filtering Commodity Channel Index momentum shifts against a price-action boundary formed by Average True Range fluctuations.

sa#MTEI_Supertrend_v1
Indicator

sa#MTEI_Supertrend_v1

iCCIiATR

This indicator identifies trend reversals by monitoring Commodity Channel Index (CCI) crossovers and projects dynamic support and resistance levels using Average True Range (ATR) volatility filters.

sa_2523MTEI_Supertrend
Indicator

sa_2523MTEI_Supertrend

iCCIiATR

This indicator identifies trend shifts by monitoring CCI momentum crossovers coupled with ATR-based volatility trailing stops to define dynamic support and resistance levels.

SDX-TzPivots-alerts_test1
Indicator

SDX-TzPivots-alerts_test1

iACiCCIiDeMarkeriATR
Indicator

SFX_TOR

iATRiMAOnArrayiStdDev
Indicator

Shi channel Alert MTF Version

iATR
shi_channel4(for trade channel)
Indicator

shi_channel4(for trade channel)

iATR

This indicator identifies significant price extremes using fractal patterns to construct a linear trend channel and detect potential reversal points based on volatility-adjusted breach levels.

shi_channel4-1(for trade channel)
Indicator

shi_channel4-1(for trade channel)

iATR

This indicator identifies structural trend shifts by projecting geometric channels based on local fractal peaks and valleys, dynamically labeling optimal buy/sell zones based on price proximity.

shi_channel4_v2_Stop[1]
Indicator

shi_channel4_v2_Stop[1]

iATR

This indicator identifies market structure by projecting trend channels based on fractal high and low extremes, dynamically calculating price offsets and volatility-adjusted stop levels.

shved_supply_and_demand
Indicator

shved_supply_and_demand

iATR

This indicator identifies high-probability supply and demand zones by tracking fractal pivot points, evaluating price penetration history, and categorizing zone integrity based on retest frequency and structural reversals.

SK-Days of Week
Indicator

SK-Days of Week

iATR

This indicator dynamically annotates the price chart with color-coded weekday labels anchored to specific historical timestamps.

SmATR
Indicator

SmATR

iATR

This indicator applies a triple-smoothed moving average filter to the Average True Range to isolate underlying market volatility trends.

Special RSI ARROW
Indicator

Special RSI ARROW

iATRiMAOnArrayiRSI

This indicator identifies trend reversals by calculating the exponential moving average of the delta between two distinct RSI periods to detect significant momentum shifts.

Squeeze Straddle
Indicator

Squeeze Straddle

iATRiMAiStdDev

The indicator identifies market equilibrium by calculating the ratio between standard deviation and Average True Range to detect low-volatility squeeze zones.

Squeeze_Break
Indicator

Squeeze_Break

iATRiMACDiADXiRSI

This indicator identifies potential market breakouts by detecting when Bollinger Bands expand beyond Keltner Channels, filtered by Momentum to confirm trend bias.

Squeeze_Break_v1
Indicator

Squeeze_Break_v1

iATRiMACDiADXiRSI

This system identifies trend reversals by detecting periods of low volatility via Bollinger Band and Keltner Channel convergence, triggering alerts when price momentum confirms an expansion into a high-volatility state.

squeeze_ra
Indicator

squeeze_ra

iATRiMAiStdDev

This indicator identifies periods of market contraction using Bollinger and Keltner Band crossovers, while visualizing smoothed momentum shifts through a linear regression-based histogram.

SSL channel chart
Indicator

SSL channel chart

iATRiMA

This indicator detects trend shifts by monitoring price crossovers against dual Simple Moving Averages of high and low prices, dynamically flipping the upper and lower boundary lines based on the prevailing momentum.

SSL_channel_chart_LnSig_alert
Indicator

SSL_channel_chart_LnSig_alert

iATRiMA

This indicator identifies trend reversals by dynamically flipping between high and low Simple Moving Average boundaries based on price breaches to create a reactive volatility channel.

SSL_channel_chart_varBLnSig_alert
Indicator

SSL_channel_chart_varBLnSig_alert

iATRiMA

The algorithm identifies directional shifts by comparing closing prices against high and low moving average boundaries to flip a dual-channel structure based on prevailing momentum.

SSL_channel_chart_varLnSig_alert
Indicator

SSL_channel_chart_varLnSig_alert

iATRiMA

The algorithm identifies trend shifts by monitoring price breakouts against dynamic moving average corridors, flipping boundary orientations based on high/low price breaches.

STARC Bands
Indicator

STARC Bands

iATRiMA

This indicator calculates a central Exponential Moving Average and projects dynamic upper and lower boundaries based on a multiple of the Average True Range.

STARC Bands_v1
Indicator

STARC Bands_v1

iATRiMA

This indicator constructs a dynamic price envelope by superimposing a constant multiplier of the Average True Range onto an Exponential Moving Average baseline.

STARC Bands_v2
Indicator

STARC Bands_v2

iATRiMA

This indicator constructs a dynamic trading channel by overlaying an Exponential Moving Average with upper and lower boundaries derived from a multiple of the Average True Range.

STARC Bands_v3
Indicator

STARC Bands_v3

iATRiMA

This indicator generates a dynamic volatility channel by projecting an exponential moving average through a multiplier of the Average True Range.

StarcBands
Indicator

StarcBands

iATRiMA

This indicator projects dynamic price boundaries by calculating a Simple Moving Average and offsetting it using a multiplier of the Average True Range to measure localized market turbulence.

StepFisher_v1[1].1
Indicator

StepFisher_v1[1].1

iATRiMA

This indicator synthesizes a dual-layered momentum system by applying a logarithmic Fisher Transform to a normalized stochastic value derived from ATR-based volatility steps and price trend breakouts.

StepFisher_v2
Indicator

StepFisher_v2

iATRiMA

This indicator utilizes an ATR-based step logic to define trend boundaries and applies a logarithmic smoothing transformation to the resulting momentum values.

StepMA_v6.1
Indicator

StepMA_v6.1

iATR

This indicator generates a staircase-style moving average that dynamically adjusts its step intervals based on historical ATR volatility and price breakout thresholds.