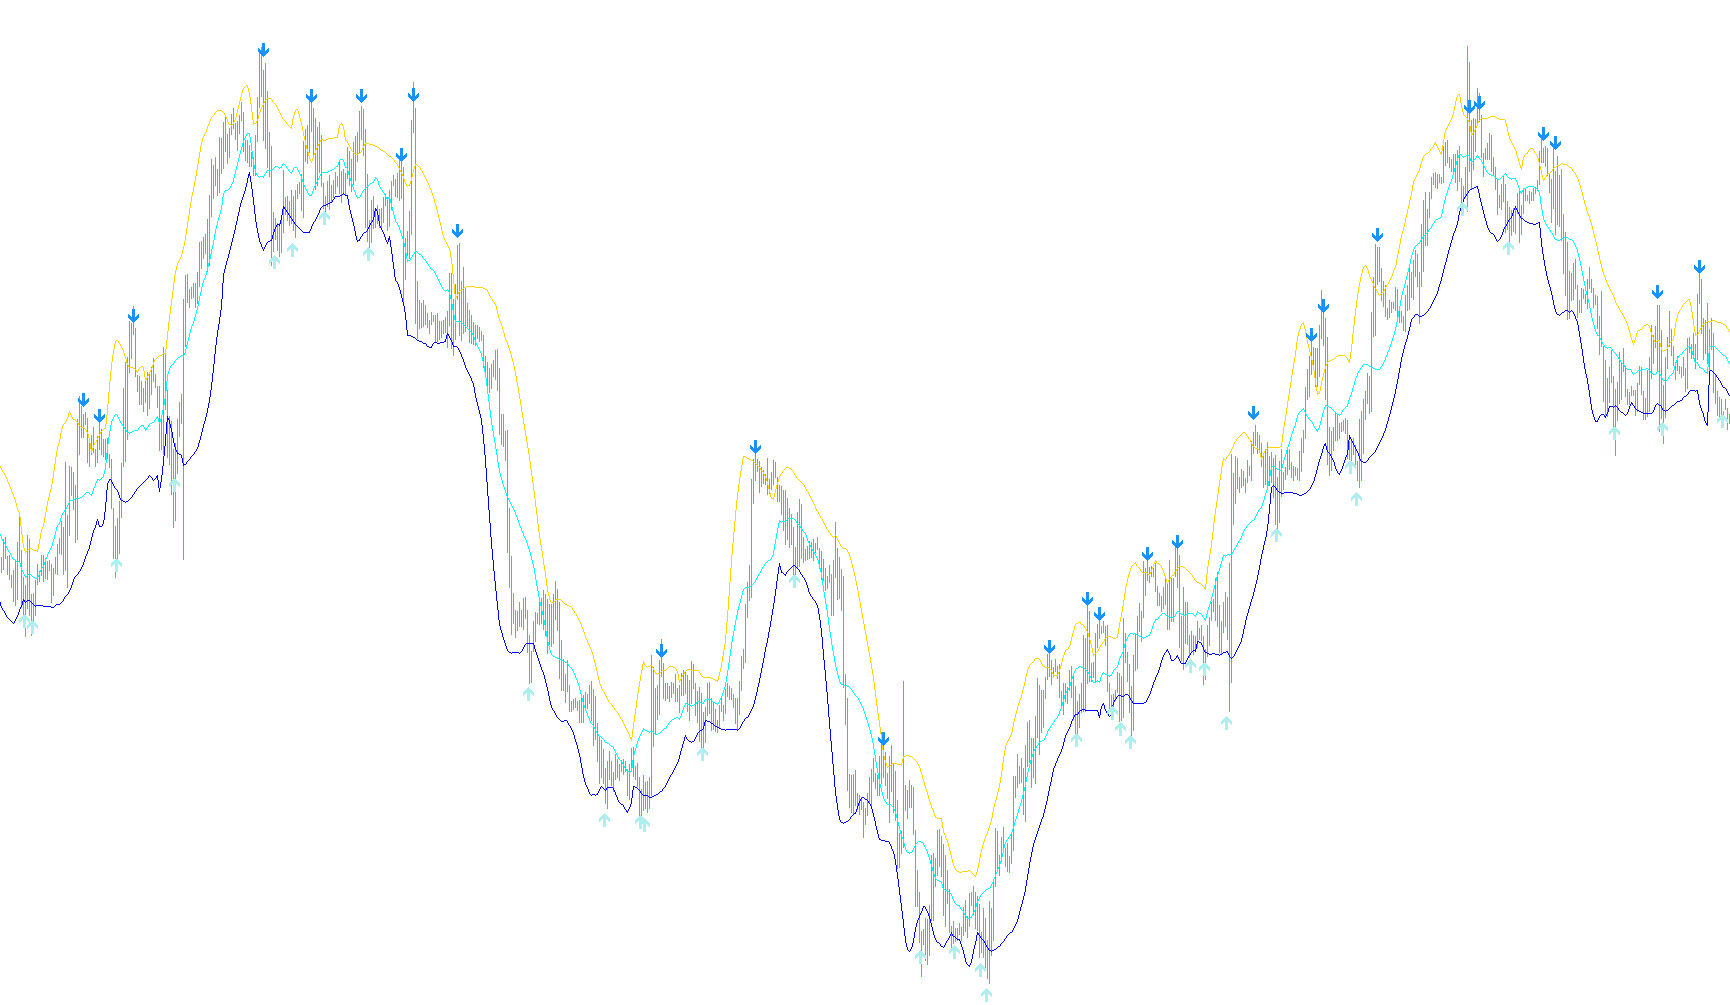
ma_bbands
Indicator

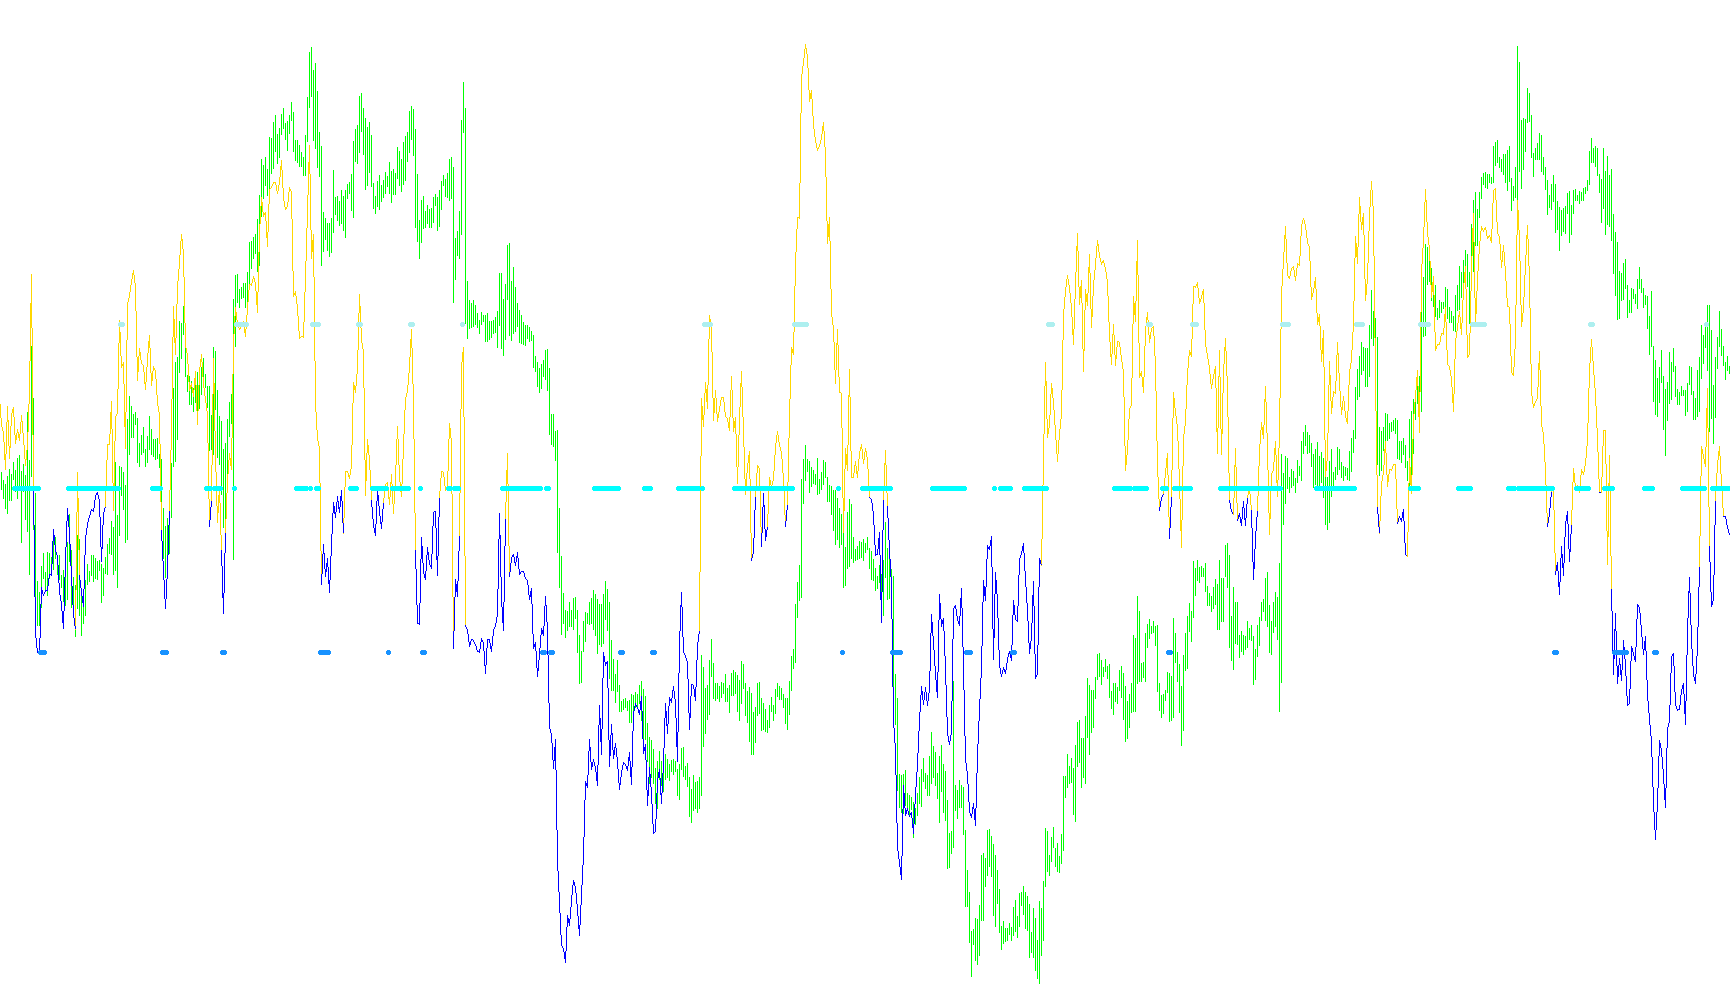
ma_bbands

iBandsiOsMAiMA
MTF Waddah_Attar_Explosion
Indicator

MTF Waddah_Attar_Explosion

iBandsiMACD

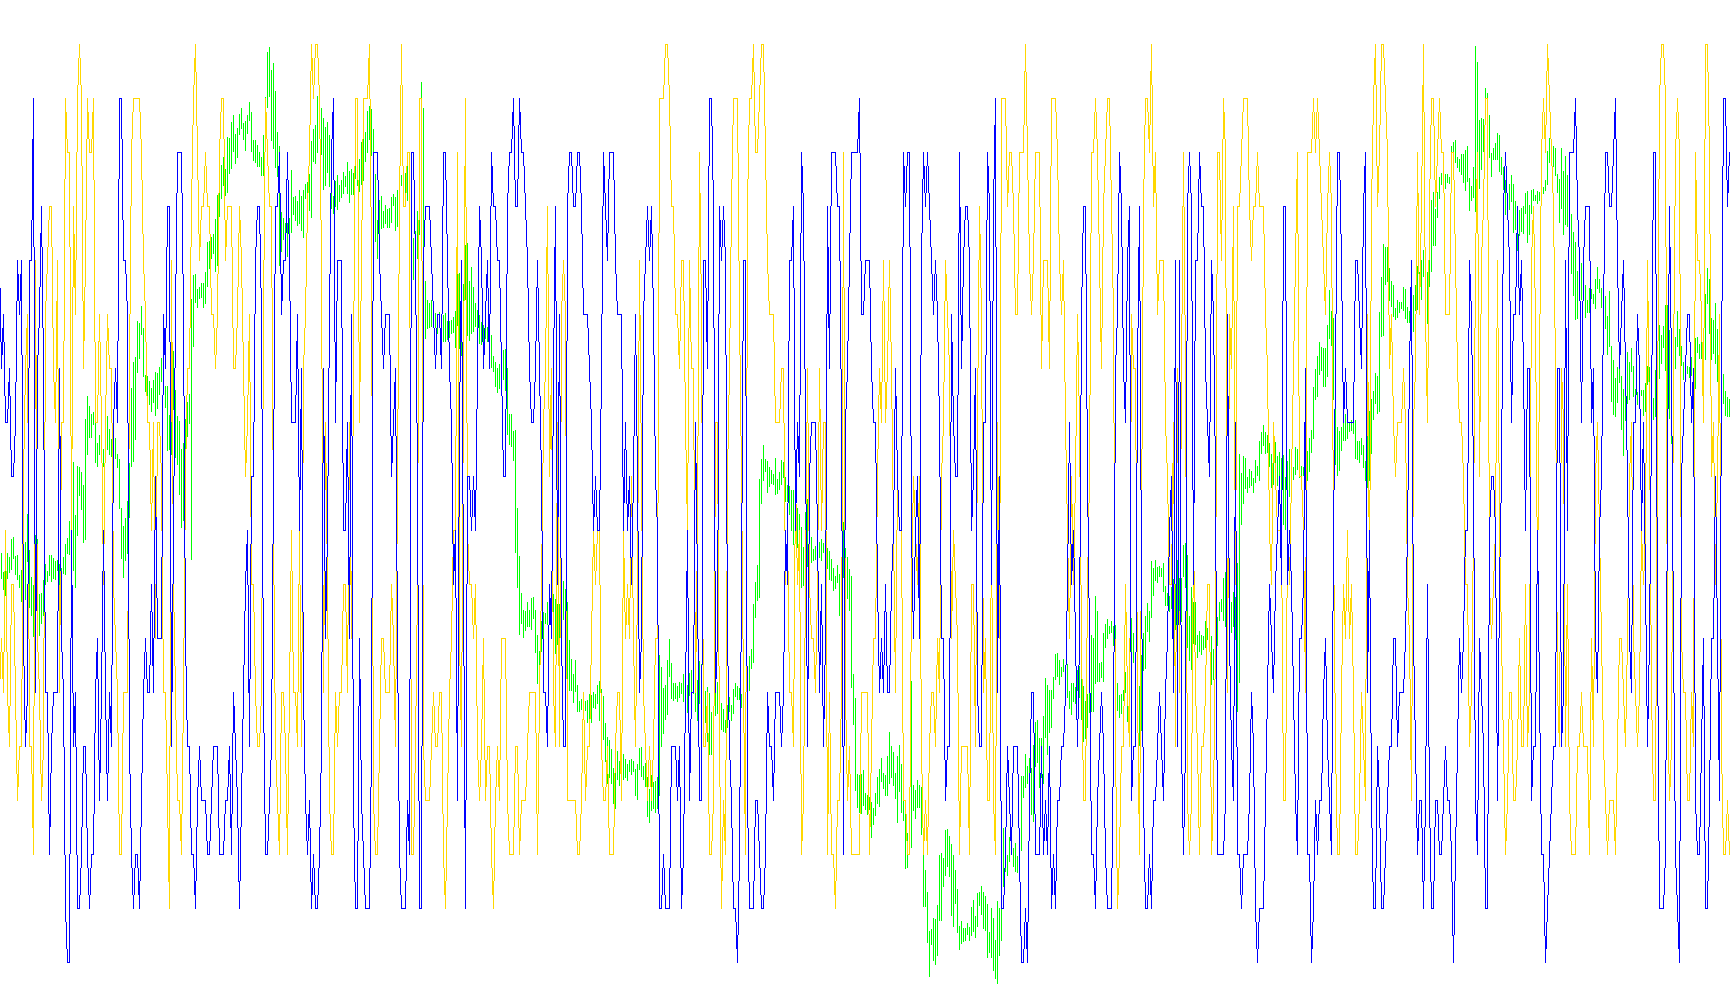
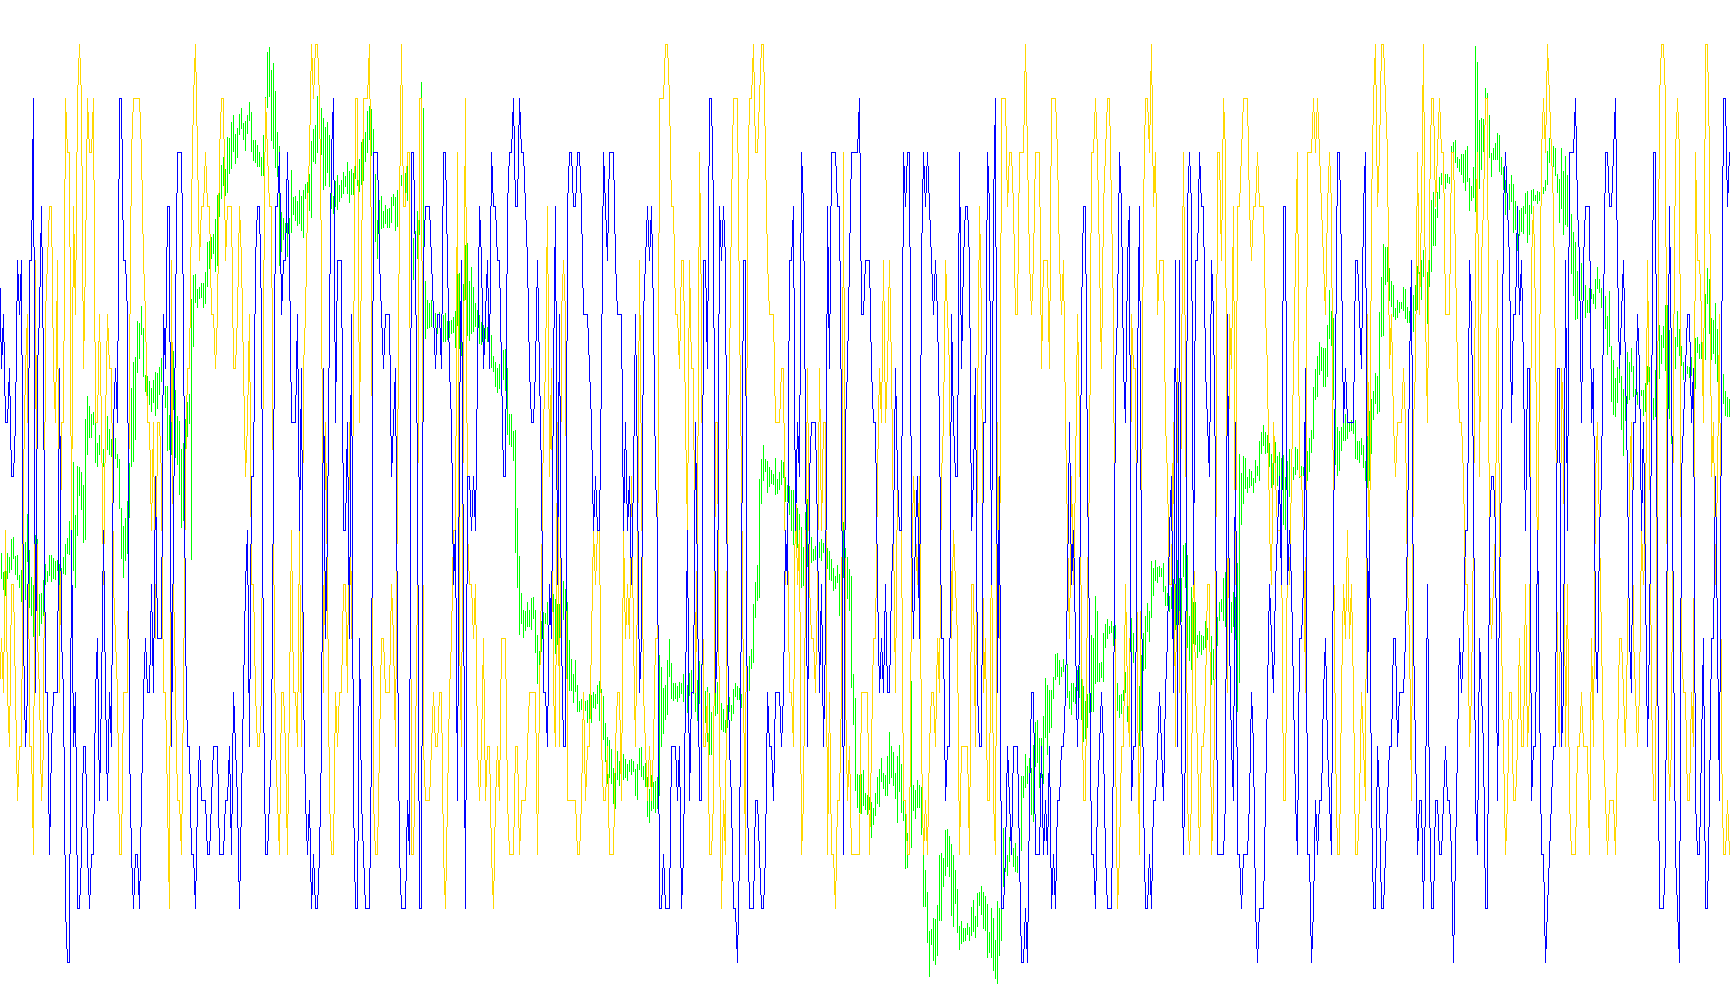
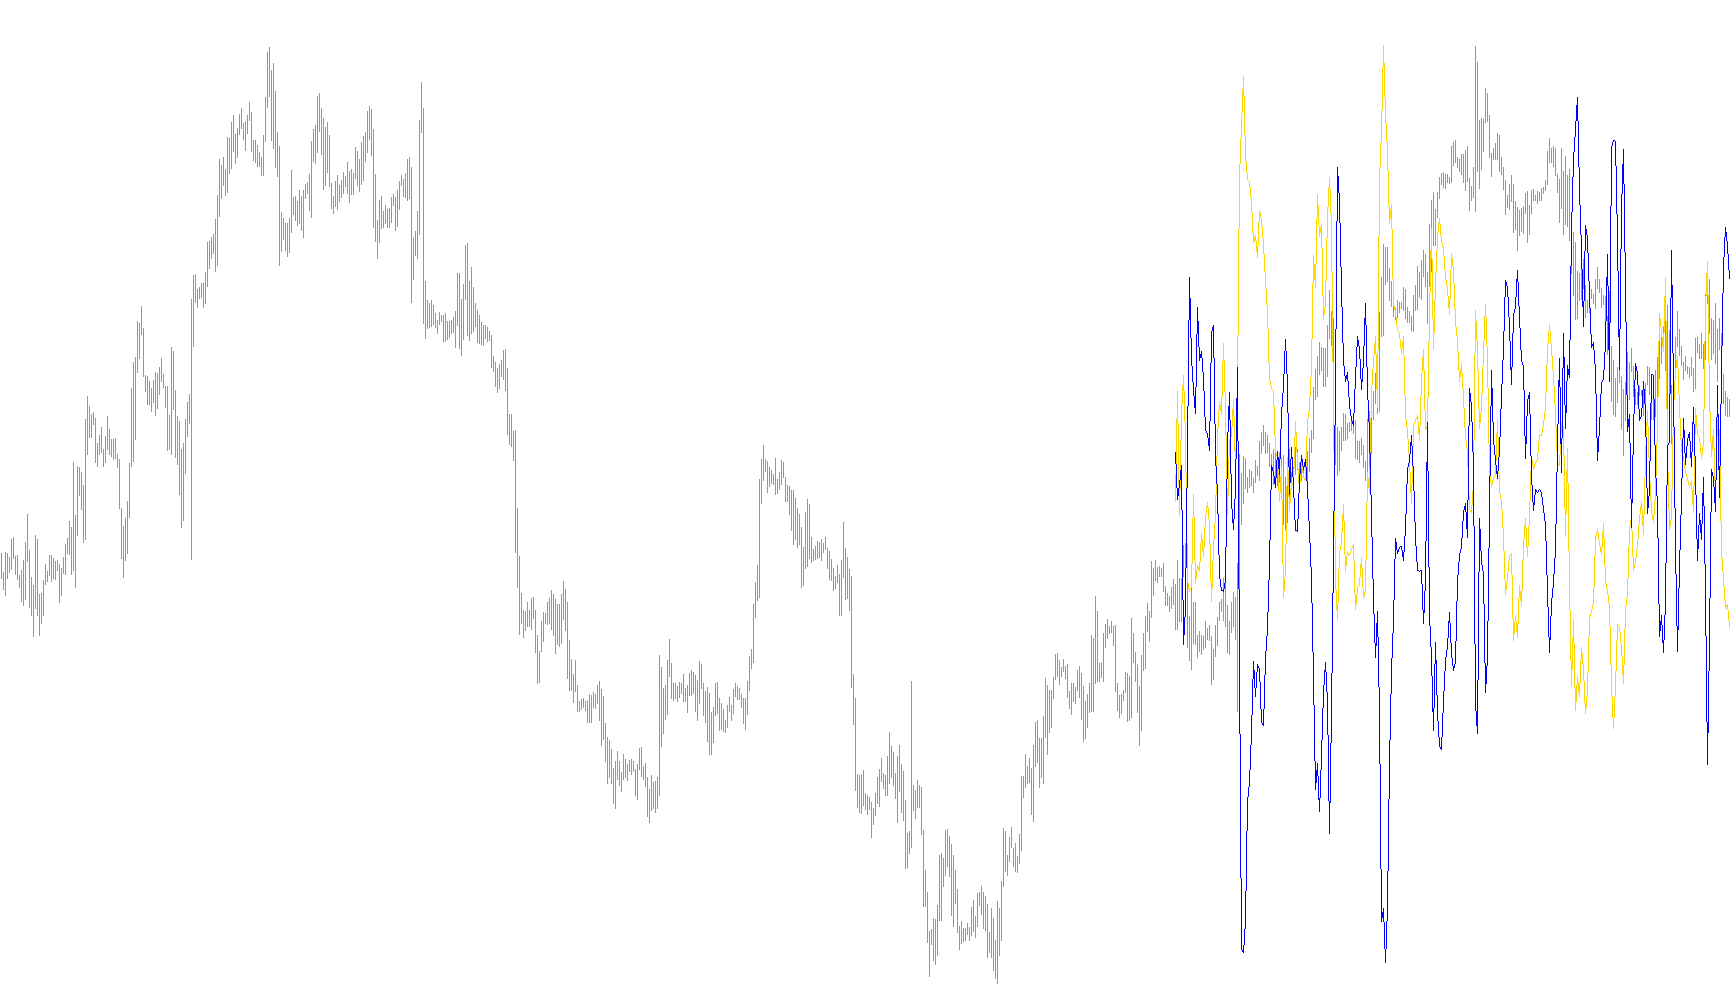
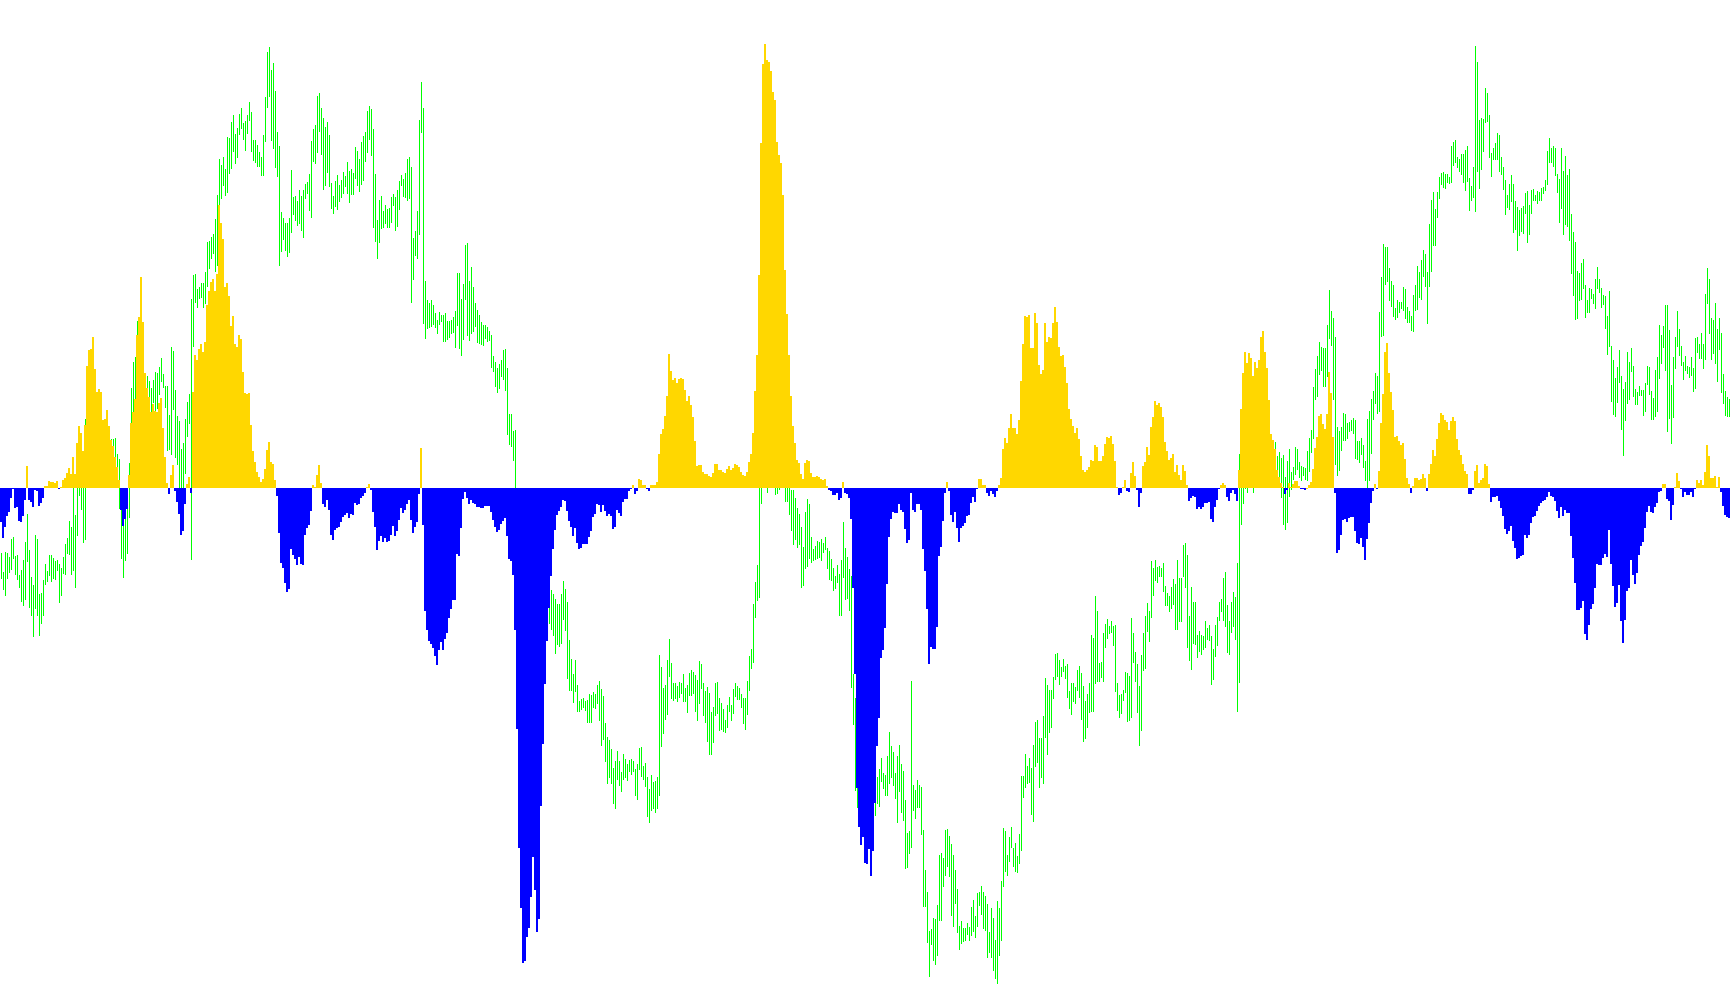
The indicator identifies high-velocity trend shifts by calculating the relative power of MACD momentum and Bollinger Band expansion against a predefined volatility dead zone.

MTF Waddah_Attar_Explosion
Indicator

MTF Waddah_Attar_Explosion

iBandsiMACD

Identifies high-velocity trend shifts by calculating the relative acceleration of MACD momentum against Bollinger Band volatility expansions.

MTF_BBands Stops
Indicator

MTF_BBands Stops

iBands

This indicator identifies trend direction by price breaches of Bollinger Bands and dynamically adjusts trailing stop levels based on volatility-weighted range expansion.

Indicator

MTF_BollinderBands

iBands
Indicator

MTF_BollingerBands

iBands
MTF_Waddah_Attar_ExplosionSA
Indicator

MTF_Waddah_Attar_ExplosionSA

iBandsiMACD

This indicator detects high-velocity trend shifts by analyzing the velocity of MACD derivatives against Bollinger Band expansion rates across multiple timeframes.

MTF_Waddah_Attar_ExplosionSA_003
Indicator

MTF_Waddah_Attar_ExplosionSA_003

iBandsiMACD

This indicator identifies high-momentum entry points by synchronizing MACD velocity shifts with Bollinger Band expansion thresholds across multiple timeframes.

Paires V_5
Indicator

Paires V_5

iBandsiMAiSAR

This indicator synchronizes Parabolic SAR, Bollinger Bands, and triple EMA smoothing with real-time price action visualization to identify trend momentum and volatility boundaries.

Percent Bollinger Bands
Indicator

Percent Bollinger Bands

iBands

This indicator calculates the normalized percentage of the asset price within the volatility range defined by the upper and lower Bollinger Bands.

Percent Bollinger Bands_v1
Indicator

Percent Bollinger Bands_v1

iBands

This indicator quantifies the closing price's spatial location within the upper and lower Bollinger Bands as a normalized percentage.

profitsignalalert~
Indicator

profitsignalalert~

iBandsiMACD

This indicator identifies high-velocity market entries by correlating accelerated MACD rate changes against Bollinger Band expansion and minimum price volatility thresholds.

RSI-TC
Indicator

RSI-TC

iBandsiATRiMAiRSI

This indicator identifies high-probability trend reversals by detecting Bollinger Band contractions (squeezes) followed by price breakouts in alignment with multi-colored RSI momentum shifts.

RSI-TC_001
Indicator

RSI-TC_001

iBandsiATRiMAiRSI

This indicator identifies high-probability reversal points by combining a dual-tone RSI filter with Bollinger Band volatility squeezes and Keltner Channel expansion signals.

RSI-TC_NEW
Indicator

RSI-TC_NEW

iBandsiATRiMAiRSI

This indicator identifies explosive market entries by detecting volatility compression between Bollinger Bands and Keltner Channels, filtered by dual-tone RSI momentum and directional band breakouts.

RSI-TC_NEW1
Indicator

RSI-TC_NEW1

iBandsiATRiMAiRSI

This indicator identifies high-probability trend reversals by detecting volatility expansion from a 'squeeze' state combined with multi-layered RSI momentum filtering.

RSI-TC_NEWd
Indicator

RSI-TC_NEWd

iBandsiATRiMAiRSI

This indicator identifies high-probability trend reversals by detecting price volatility compression using a Bollinger Band and Keltner Channel squeeze, coupled with RSI momentum filtering to trigger directional signals.

RSI-TC_NEW[1]
Indicator

RSI-TC_NEW[1]

iBandsiATRiMAiRSI

This indicator identifies high-probability momentum shifts by detecting price breakouts from low-volatility Keltner Channel squeezes while filtering directionality through a dual-tone Relative Strength Index.

RSI-TC_NEW_Alert2
Indicator

RSI-TC_NEW_Alert2

iBandsiATRiMAiRSI

This indicator identifies high-probability trend reversals by detecting price volatility compression (Squeeze) and validating breakouts through RSI momentum shifts and Bollinger Band expansions.

RSI-TC_NEW_v2
Indicator

RSI-TC_NEW_v2

iBandsiATRiMAiRSI

This indicator identifies high-probability trend continuations by detecting volatility 'squeezes' through Bollinger Band and Keltner Channel convergence, filtered by RSI momentum shifts.

RSI-TC_v1
Indicator

RSI-TC_v1

iBandsiATRiMAiRSI

This indicator identifies high-probability entries by synchronizing RSI momentum with the spatial divergence between Bollinger Bands and SuperTrend volatility envelopes.

Squeeze_Break
Indicator

Squeeze_Break

iATRiMACDiADXiRSI

This indicator identifies potential market breakouts by detecting when Bollinger Bands expand beyond Keltner Channels, filtered by Momentum to confirm trend bias.

Squeeze_Break_v1
Indicator

Squeeze_Break_v1

iATRiMACDiADXiRSI

This system identifies trend reversals by detecting periods of low volatility via Bollinger Band and Keltner Channel convergence, triggering alerts when price momentum confirms an expansion into a high-volatility state.

Indicator

Tabelka_kontrolna_PL

iADiACiAlligatoriFractals
toptahlil_bollinger_and_atr_band
Indicator

toptahlil_bollinger_and_atr_band

iBandsiATR

This indicator synthesizes Bollinger Band boundaries with ATR-based expansion to create a dual-layered volatility channel for identifying extreme price excursions.

TOPTREND
Indicator

TOPTREND

iBands

This indicator identifies trend reversals and dynamic exit points by calculating a non-repainting trailing stop based on Bollinger Band extremes and adjusted risk volatility.

Trend
Indicator

Trend

iBearsPoweriBandsiBullsPower

This indicator calculates the arithmetic difference between current price levels and Bollinger Band components while simultaneously quantifying market momentum through the aggregate of bullish and bearish power dynamics.

Trendy Alert
Indicator

Trendy Alert

iBandsiCCIiADXiMA
Trendy
Indicator

Trendy

iBandsiCCIiADXiMA
Trend_001
Indicator

Trend_001

iBearsPoweriBandsiBullsPower

The indicator calculates the differential between specific price types and Bollinger Band extremes while correlating them against an aggregated power oscillator of bullish and bearish momentum.

Trend_v1
Indicator

Trend_v1

iBearsPoweriBandsiBullsPower

This indicator quantifies market sentiment by calculating the variance between specific price points and Bollinger Band components, contrasted against a weighted sum of bullish and bearish power dynamics.

Trend_v3
Indicator

Trend_v3

iBearsPoweriBandsiBullsPower

This indicator calculates the divergence between price action and Bollinger Band boundaries while simultaneously aggregating smoothed bullish and bearish power dynamics into a singular trend sentiment line.

VSA_ TrendDiamonds
Indicator

VSA_ TrendDiamonds

iBandsiMAiSAR

This indicator identifies directional shifts by synchronizing Smoothed Moving Average slopes with Parabolic SAR position and expanding Bollinger Band volatility thresholds.

Waddah_Attar_ADXxBollinger
Indicator

Waddah_Attar_ADXxBollinger

iBandsiADX

This indicator synchronizes the ADX trend strength with Bollinger Band expansion width to visualize directional momentum intensity.

Waddah_Attar_Explosion
Indicator

Waddah_Attar_Explosion

iBandsiMACD

This system identifies high-velocity market entries by calculating the relative acceleration of MACD trend shifts against expanding Bollinger Band volatility thresholds.

Waddah_Attar_Explosion1
Indicator

Waddah_Attar_Explosion1

iBandsiMACD

This indicator identifies high-velocity market entries by calculating the relative acceleration between MACD trend shifts and Bollinger Band expansion thresholds.

Waddah_Attar_Explosion_001
Indicator

Waddah_Attar_Explosion_001

iBandsiMACD

This indicator identifies high-velocity market entries by calculating the relative rate of change between MACD momentum and Bollinger Band expansion against predefined threshold filters.

Waddah_Attar_OMN
Indicator

Waddah_Attar_OMN

iBandsiMACD

This indicator quantifies market velocity by calculating the product of MACD rate of change and Bollinger Band width to identify trend strength and volatility expansion.

Waddah_Attar_Trend
Indicator

Waddah_Attar_Trend

iBandsiMACD

Quantifies market trajectory by calculating the product of MACD directional velocity and Bollinger Band expansion breadth.

Yaanna
Indicator

Yaanna

iBandsiMA

This indicator quantifies the relative percentage proximity of the current closing price within the spatial bounds defined by a dual Bollinger Band structure.

YaannaSignal
Indicator

YaannaSignal

iBandsiMA

This indicator identifies potential reversal points by calculating the percentage of price position relative to the Bollinger Bands range and monitoring for significant overextended movements.

[i]BollTrade_Ron_MT4
Indicator

[i]BollTrade_Ron_MT4

iBands

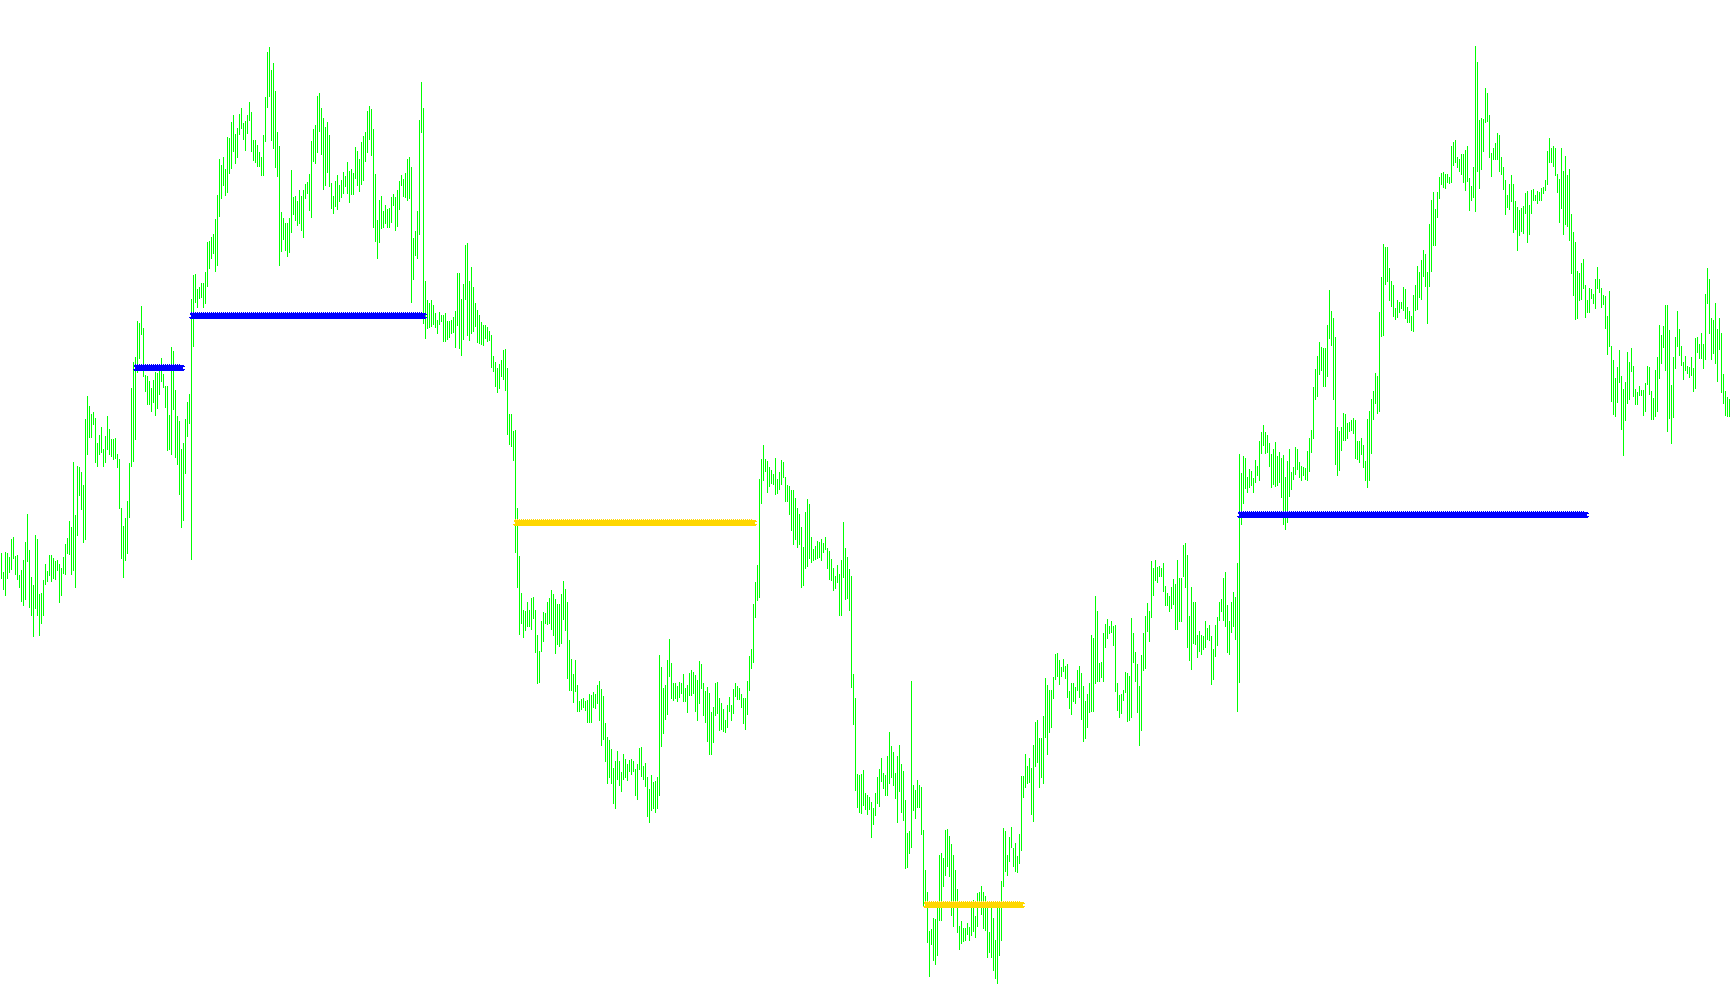
This indicator identifies price extremes by detecting candles that breach the Bollinger Bands by a specific point offset.
[i]BollTrade_Ron_MT4_v1
Indicator

[i]BollTrade_Ron_MT4_v1

iBands

This indicator identifies price action volatility by flagging instances where the high or low of a candle exceeds the Bollinger Bands by a specific point-based distance threshold.
Indicator

_2523MTF_BollinderBands

iBands