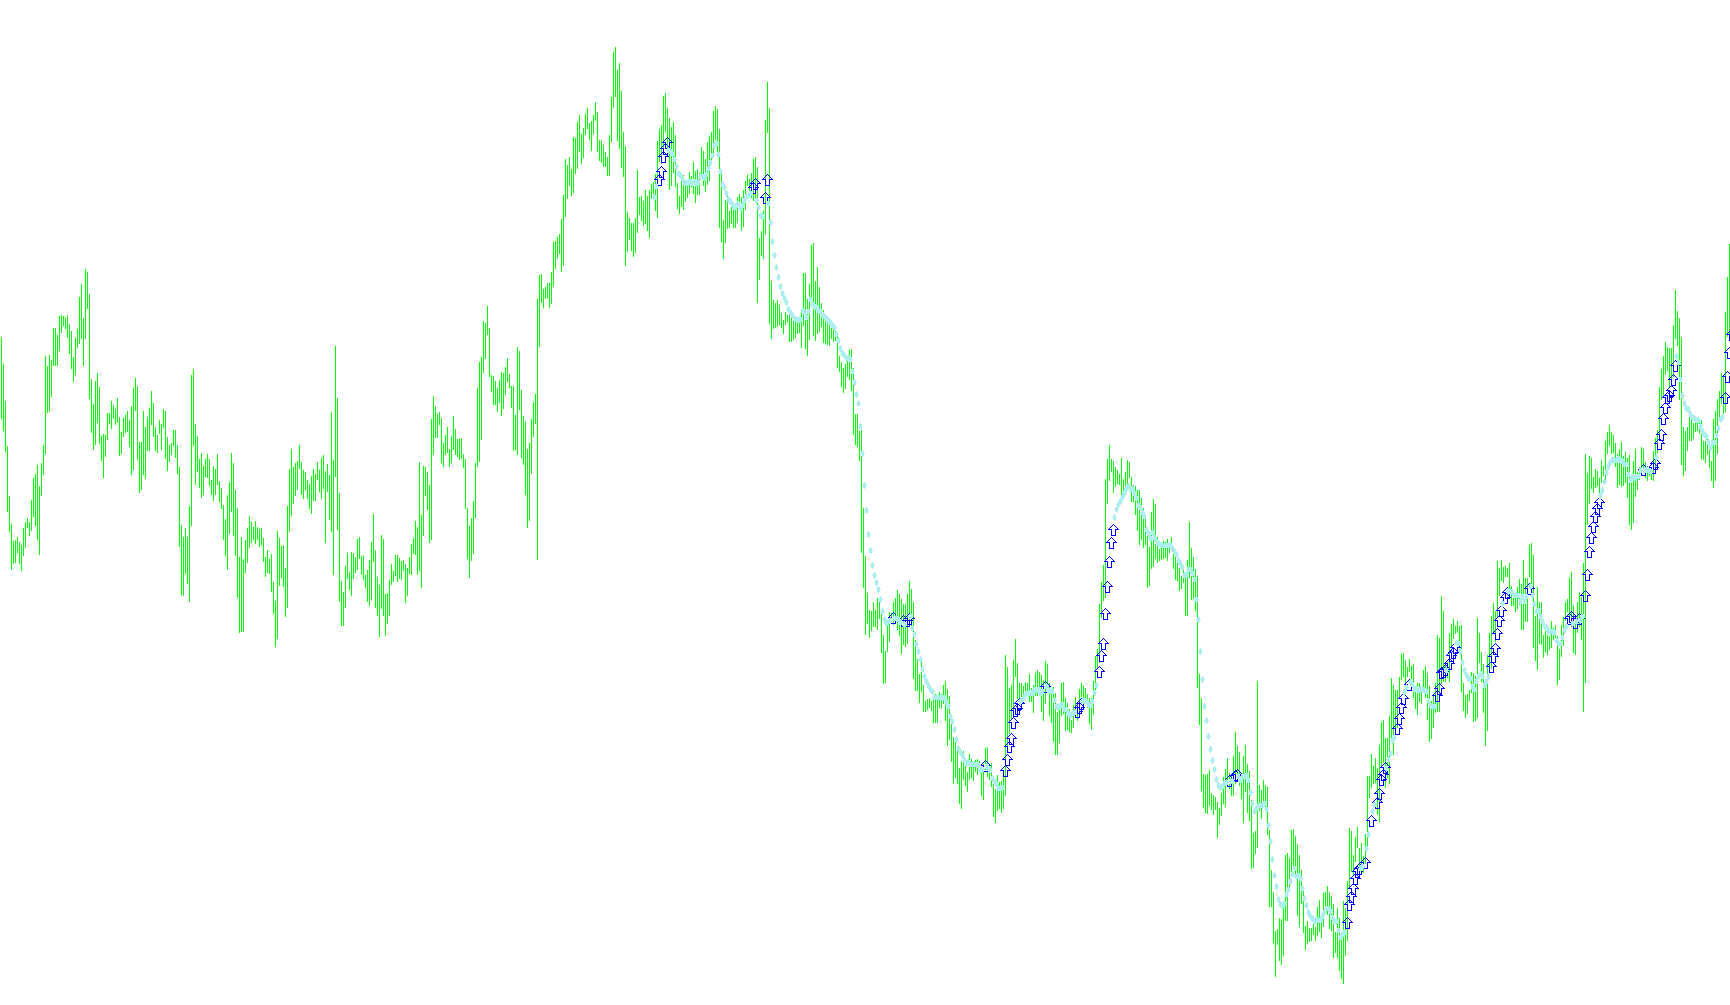
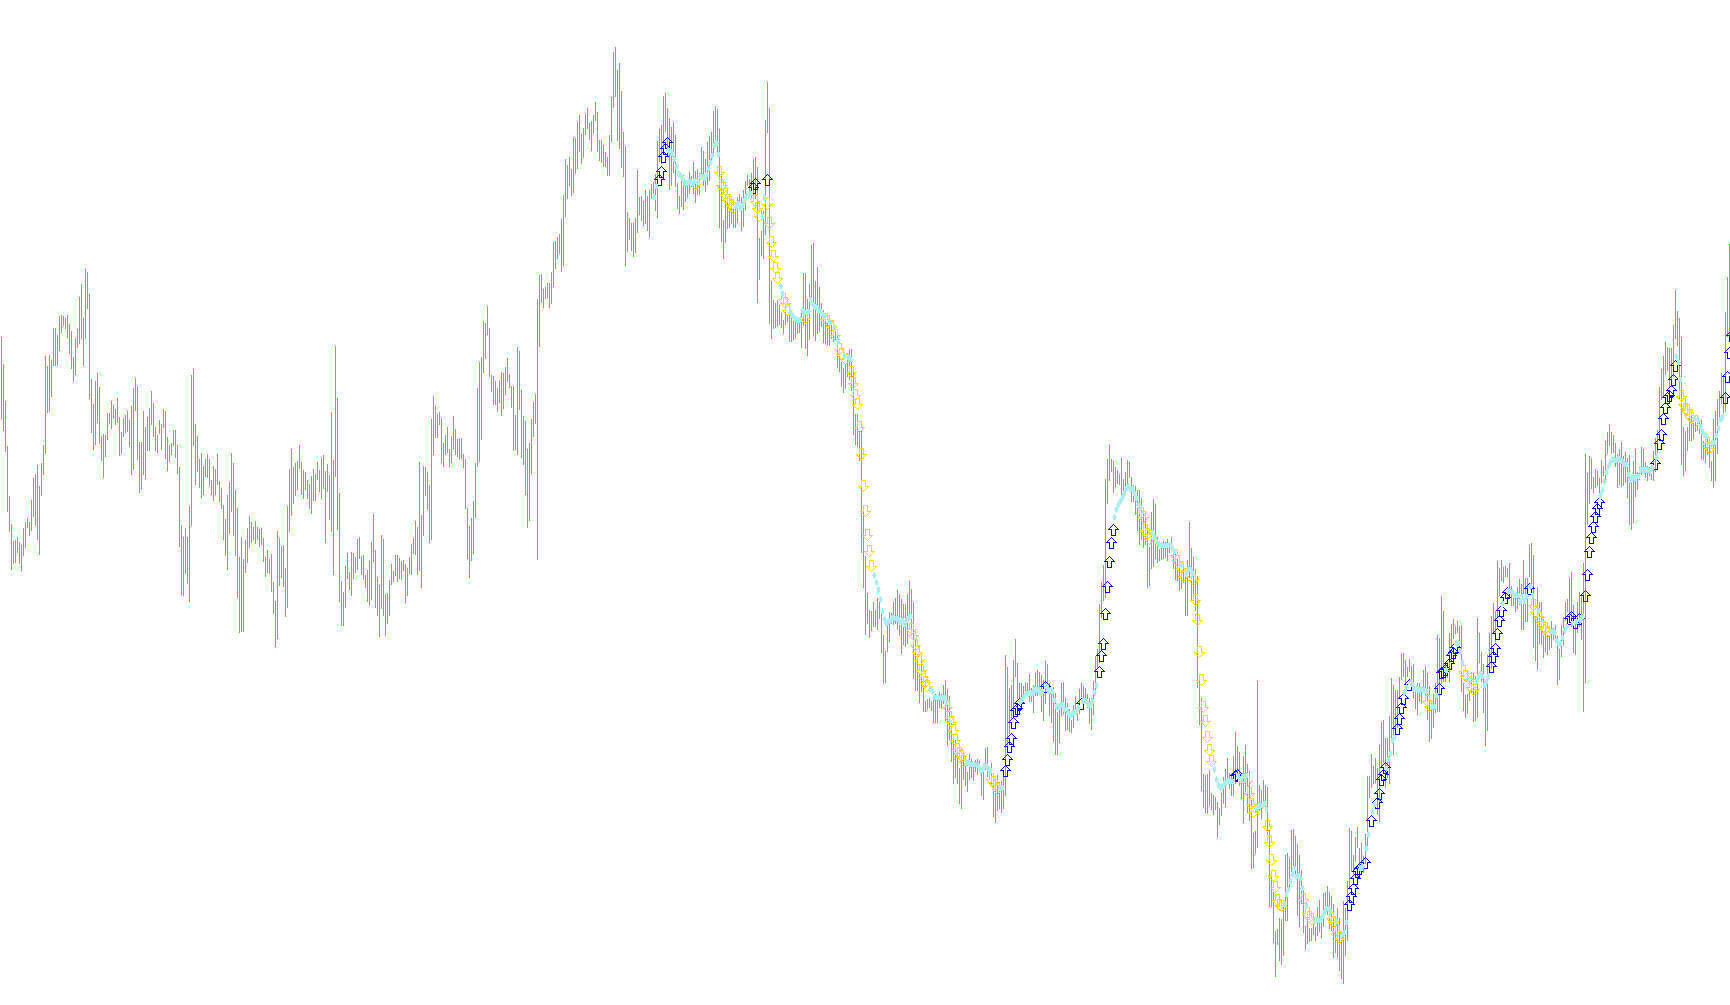
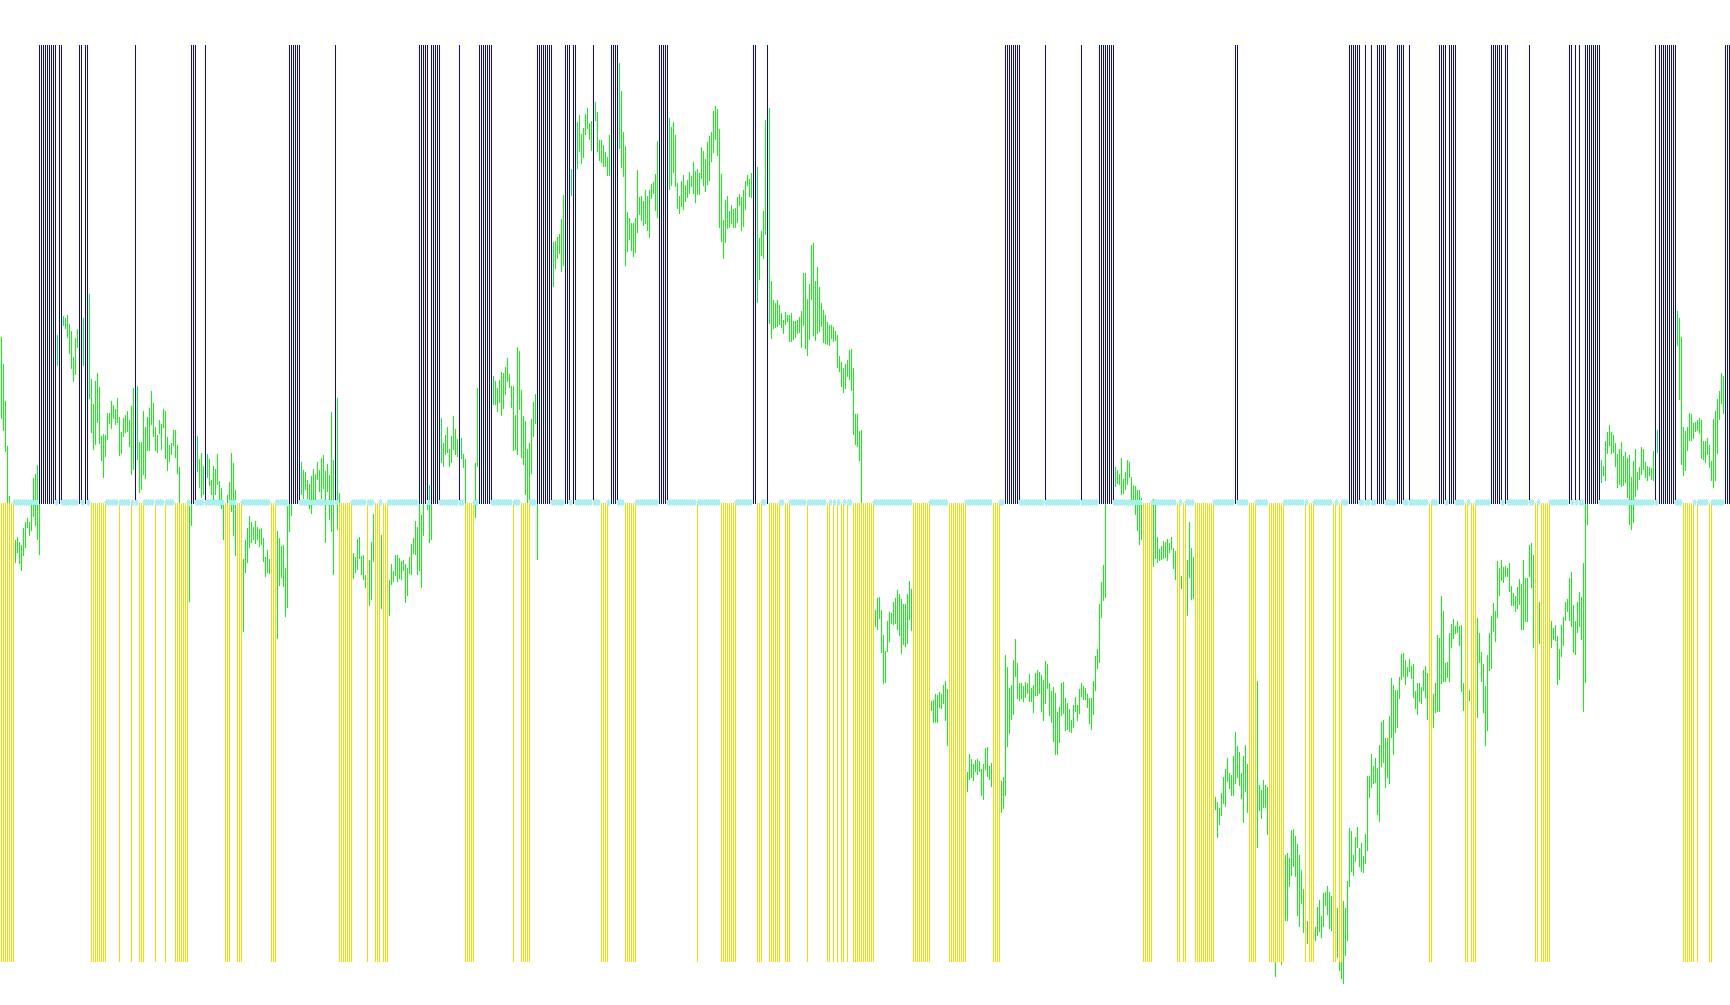
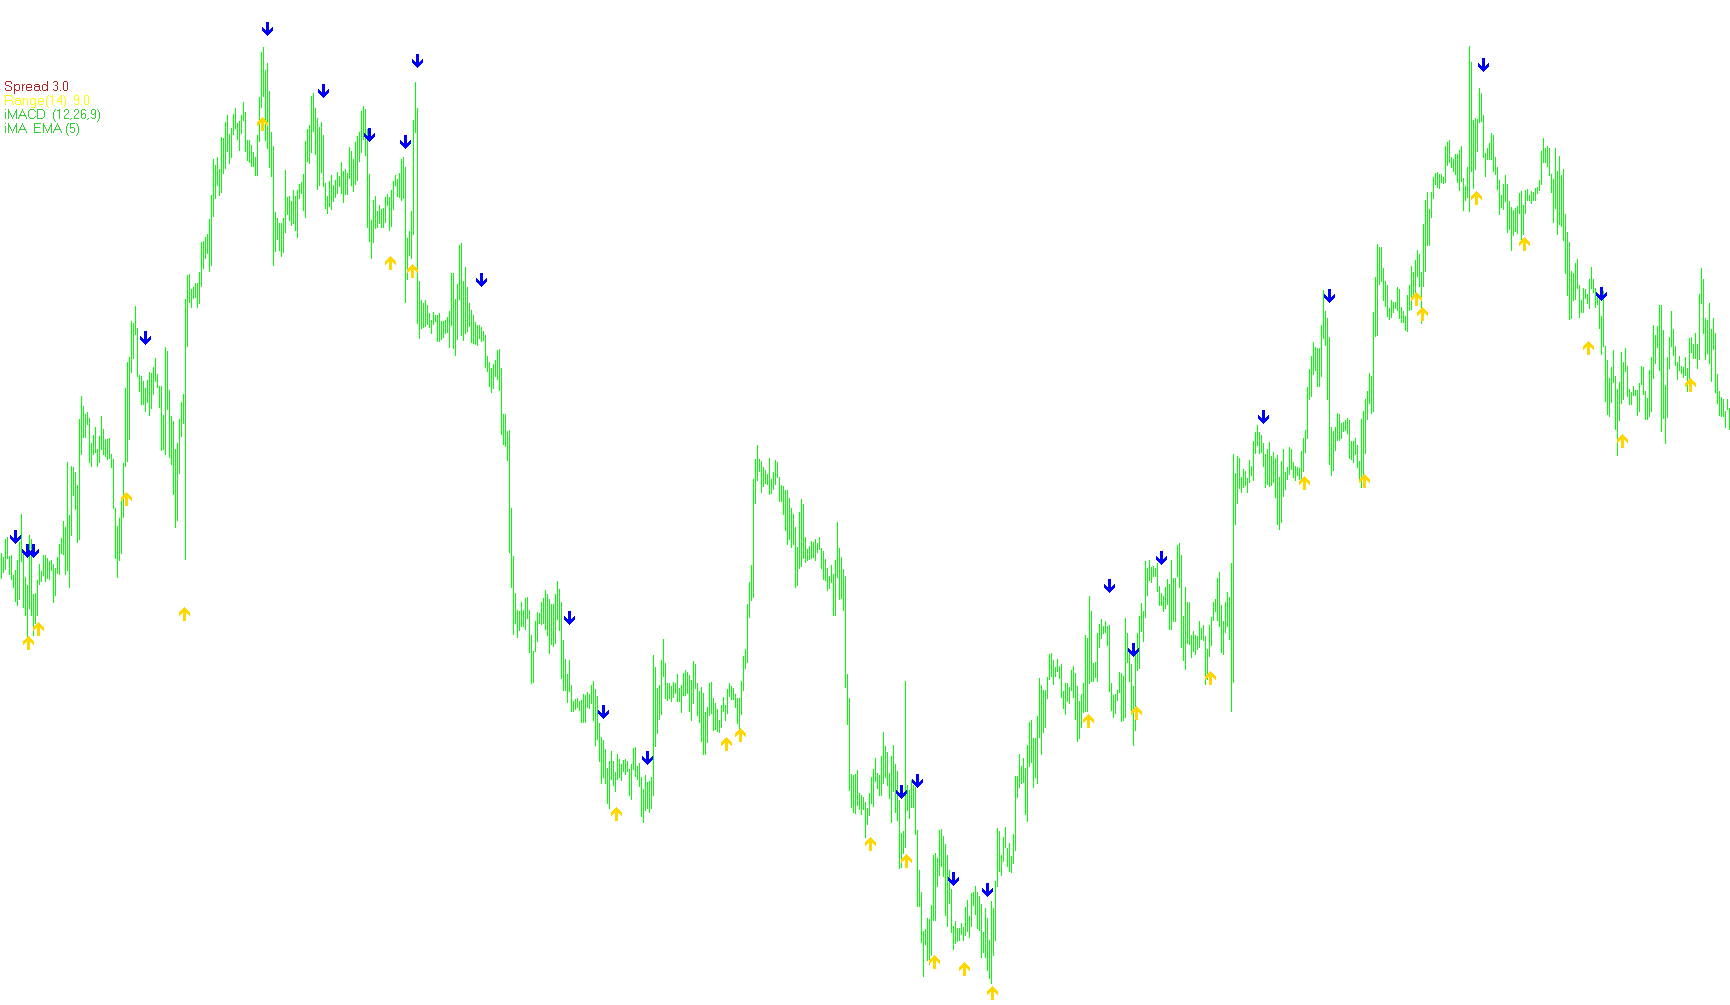
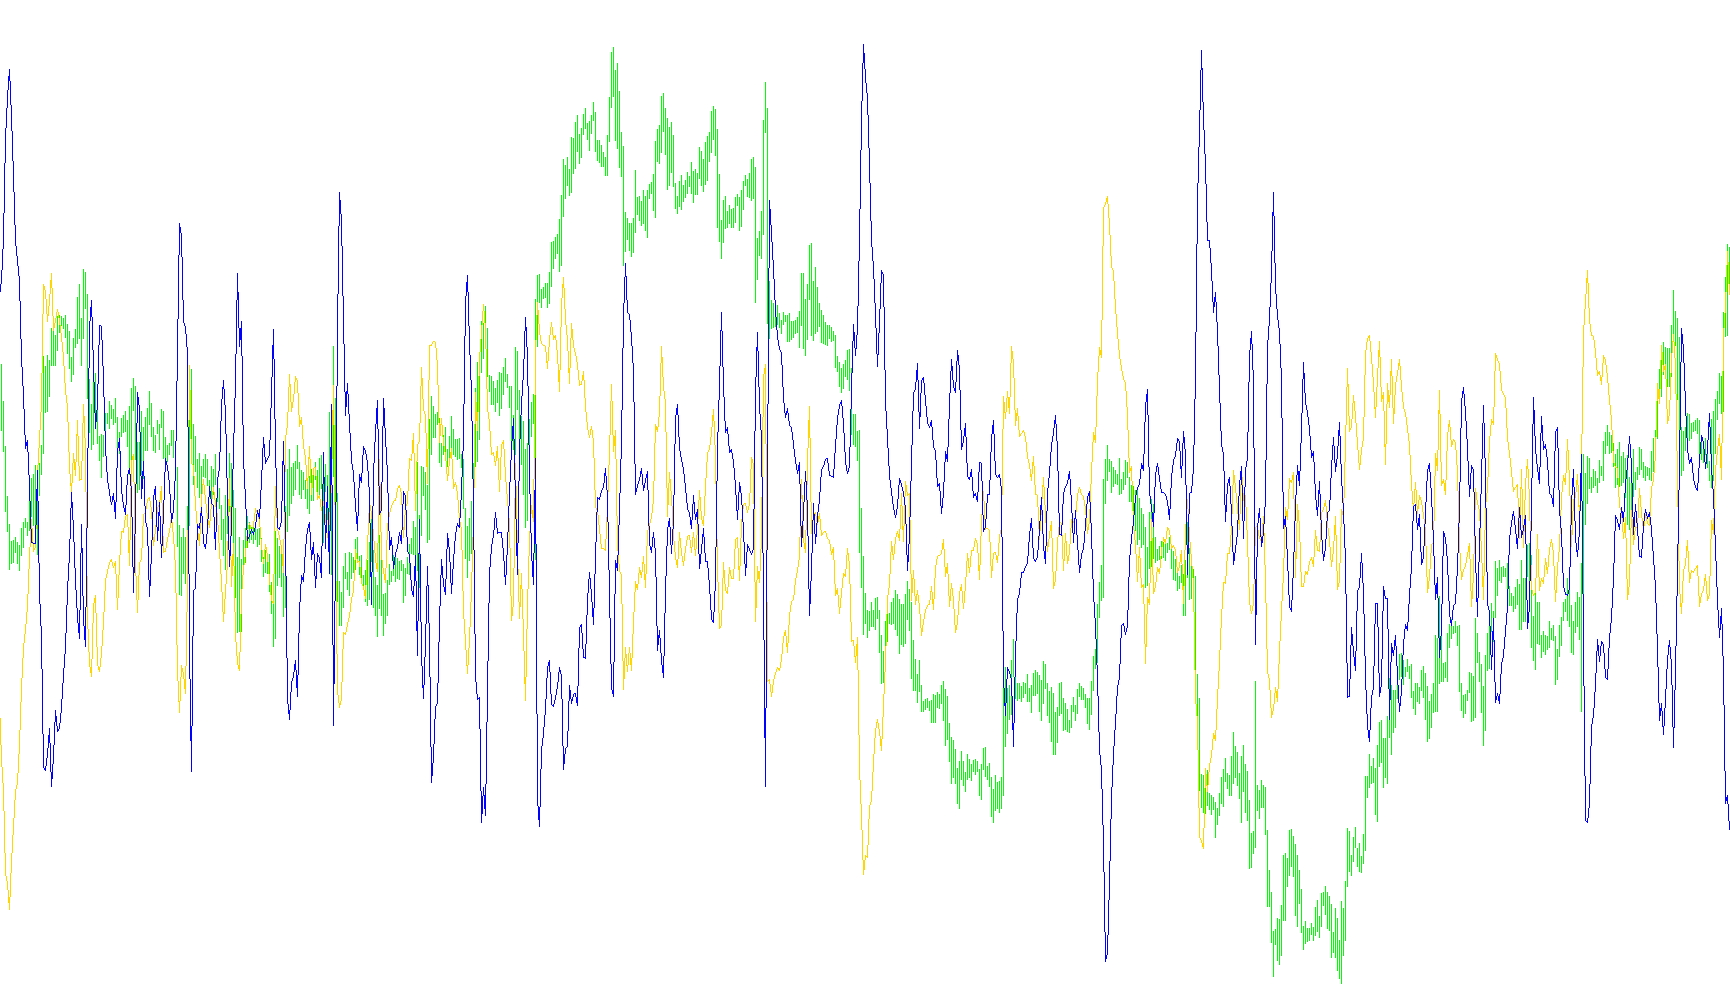
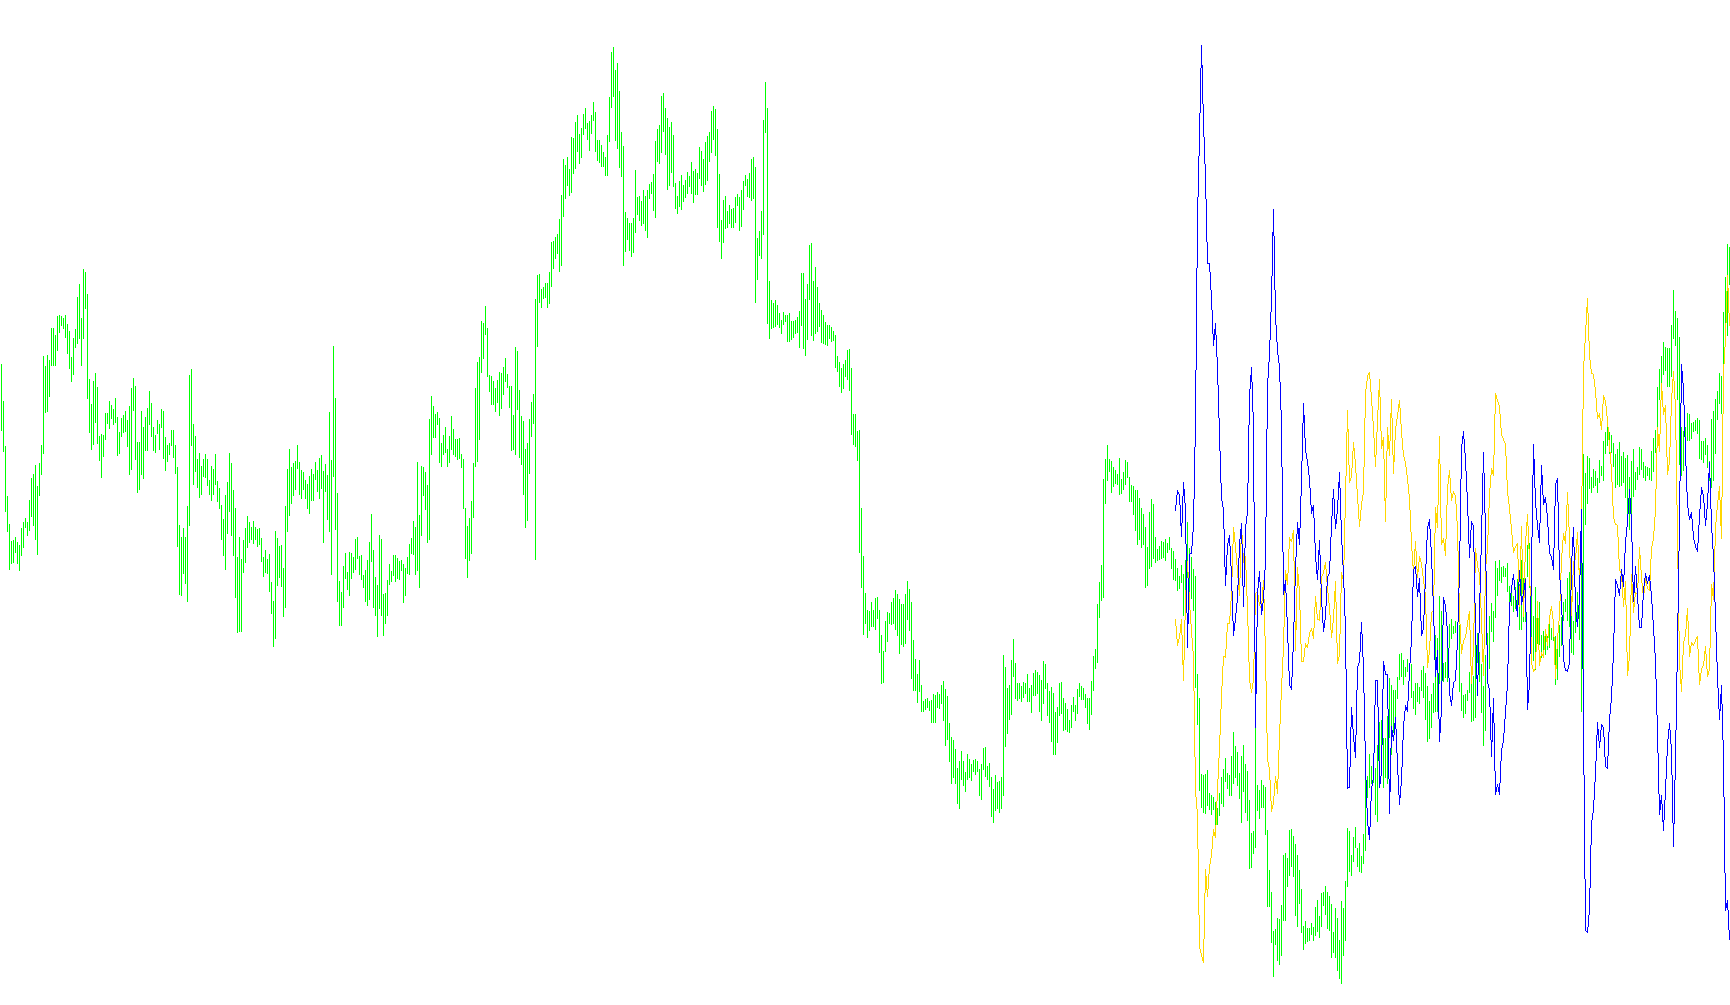
BolliToucher_005
Indicator

BolliToucher_005

iBands
BolliToucher_v1
Indicator

BolliToucher_v1

iBands

This indicator identifies potential price exhaustion by detecting instances where market price interacts with Bollinger Band boundaries to signal trend reversals.

BolliToucher_v3
Indicator

BolliToucher_v3

iBands

Identifies potential trend exhaustion by detecting price breaches of the outer Bollinger Band limits followed by corrective movements.

BolliTrigger
Indicator

BolliTrigger

iBandsiMA

This indicator generates a signal line by calculating a weighted sum of Bollinger Bandwidth and a modified Percent B value to identify price momentum relative to volatility.

BollStarc-TC
Indicator

BollStarc-TC

iBandsiATRiMA

This indicator synthesizes price momentum by overlaying Keltner Channel envelopes derived from ATR and EMA with standard Bollinger Band volatility boundaries.

BollStarc-TC_Sig
Indicator

BollStarc-TC_Sig

iBandsiATRiMA

This indicator identifies high-probability trend reversals by detecting instances where price action pierces through a hybrid boundary of Bollinger Bands and STARC volatility channels.

BollStarc-TC_v1
Indicator

BollStarc-TC_v1

iBandsiATRiMA

This indicator synthesizes Bollinger Bands with Keltner-style ATR channels to provide a dual-layered visualization of market volatility and price extremes.

BollStarc-TC_v2
Indicator

BollStarc-TC_v2

iBandsiATRiMA

This indicator synchronizes Keltner Channel dynamics with Bollinger Band boundaries to provide a comprehensive visual representation of price expansion and compression.

DDFX 3 BBStop v3
Indicator

DDFX 3 BBStop v3

iBands

This indicator identifies trend reversals by calculating trailing stop levels based on Bollinger Band extremes and price momentum relative to risk parameters.

DDFX 6 Medium Trend v3
Indicator

DDFX 6 Medium Trend v3

iBands

This indicator identifies structural shifts by monitoring price breakouts against dynamically adjusted Bollinger Bands and tracking trailing trend extremes to generate entry signals.

DDFX 7 Major Trend v3
Indicator

DDFX 7 Major Trend v3

iBands

This indicator identifies structural momentum shifts by calculating dynamic volatility boundaries and detecting price breakouts to signal major trend reversals.

DDFX 9 Xtra Sig v3
Indicator

DDFX 9 Xtra Sig v3

iBands

This indicator identifies trend reversals by monitoring Bollinger Band breaches and calculating trailing stop levels based on dynamic price risk parameters.

Doda-BBands
Indicator

Doda-BBands

iBands

This indicator identifies trend direction by monitoring price breaches of Bollinger Bands and calculates a dynamic trailing stop based on the distance between upper and lower bands adjusted by a user-defined risk offset.
Indicator

FX Multi-Meter II

iMACDiMAiSARiStochastic
Indicator

FXOE-ITrend

iBearsPoweriBandsiBullsPower
FXTT_MTF_BollingerBands
Indicator

FXTT_MTF_BollingerBands

iBands

This tool synchronizes and visualizes Bollinger Band envelopes across nine distinct temporalities simultaneously to identify multi-layered volatility boundaries.
GimmeeBar
Indicator

GimmeeBar

iBands

This indicator identifies potential reversal points by detecting bearish and bullish price action shifts where candlesticks pierce the Bollinger Band boundaries against prevailing trends.

HLBolinger
Indicator

HLBolinger

iBands

This indicator calculates independent upper and lower standard deviation boundaries based on high and low price extremes rather than traditional closing prices.

i Trend
Indicator

i Trend

iBearsPoweriBandsiBullsPower

This indicator calculates the variance between current price action and Bollinger Band components while simultaneously quantifying directional momentum through a weighted sum of bullish and bearish power forces.

i Trend_v1
Indicator

i Trend_v1

iBearsPoweriBandsiBullsPower

This indicator calculates the variance between current price action and Bollinger Band components while correlating it with aggregate bull and bear power dynamics.

i4_GoldenLionTrend_v3
Indicator

i4_GoldenLionTrend_v3

iBands

The indicator identifies price excursions beyond multiple standard deviation bands to pinpoint extreme volatility zones and potential mean reversion points.

iFXSI
Indicator

iFXSI

iBearsPoweriBandsiCCIiADX

This indicator generates directional signals by validating concurrent crossovers from iTrend, ZeroLag Stochastic, and ADX components against CCI threshold filters.

iFXSI_v1
Indicator

iFXSI_v1

iBearsPoweriBandsiCCIiADX

This indicator identifies high-probability trade entries by synchronizing signal crossovers from iTrend, ZeroLag Stochastic, and ADX metrics with CCI momentum validation.

Ind-GG01-101
Indicator

Ind-GG01-101

iBandsiMAiSAR

This indicator identifies high-probability entry points by synchronizing Parabolic SAR trend reversals with smoothed moving average crossovers and expanding Bollinger Band volatility expansion.

Ind-GG01
Indicator

Ind-GG01

iBandsiMAiSAR

Identifies high-momentum entries by correlating smoothed moving average crossovers, parabolic SAR price action, and expanding Bollinger Band volatility thresholds.

Ind-GG01M
Indicator

Ind-GG01M

iBandsiMAiSARiStdDev

Identifies trend reversals by synchronizing smoothed moving average crossovers with Parabolic SAR filters and expanding Bollinger Band volatility thresholds.

Ind-GG01M1
Indicator

Ind-GG01M1

iBandsiMAiSARiStdDev

This indicator identifies trend reversal points by synthesizing smoothed moving average crossovers, Parabolic SAR positioning, and expanding Bollinger Band width to filter for high-momentum volatility.

Ind-GG01M_sw
Indicator

Ind-GG01M_sw

iBandsiMAiSARiStdDev

This indicator identifies high-probability reversal points by synchronizing Parabolic SAR trend breaks with expanding Bollinger Band dynamics and smoothed moving average deviations.

indicatorarrows
Indicator

indicatorarrows

iMACDiOsMAiMAiStochastic
Itend old
Indicator

Itend old

iBearsPoweriBandsiBullsPower

This indicator quantifies market sentiment by comparing current price action against Bollinger Band extremes and contrasting Bull/Bear power dynamics to generate a visual histogram of trend dominance.

Itend old_v1
Indicator

Itend old_v1

iBearsPoweriBandsiBullsPower

This indicator synchronizes Bollinger Band breaches with directional power calculations to visualize market sentiment via a dual-color histogram.

Itrend Old
Indicator

Itrend Old

iBearsPoweriBandsiBullsPower

This indicator synthesizes Bollinger Band proximity logic with Bull/Bear power metrics to visualize binary trend polarity through dual-histogram signal mapping.

Itrend Old_v1
Indicator

Itrend Old_v1

iBearsPoweriBandsiBullsPower

This indicator synthesizes Bollinger Band breaches and dual power oscillators to visualize market sentiment through binary histogram signals.

Itrend Old_v2
Indicator

Itrend Old_v2

iBearsPoweriBandsiBullsPower

This indicator quantifies market direction by measuring the price variance relative to Bollinger Bands and contrasting it with the aggregate momentum of bullish and bearish power flows.

iTrend
Indicator

iTrend

iBearsPoweriBandsiBullsPower

This indicator calculates the distance between price and Bollinger Bands while simultaneously measuring negative aggregate bullish and bearish power to identify trend exhaustion.

iTrend1
Indicator

iTrend1

iBearsPoweriBandsiBullsPower

This indicator maps market sentiment by correlating the distance of current price from Bollinger Bands against a normalized sum of bullish and bearish power fluctuations.

iTrend1_v1
Indicator

iTrend1_v1

iBearsPoweriBandsiBullsPower

This indicator visualizes market sentiment by cross-referencing Bollinger Band deviations with the cumulative sum of Bull and Bear power oscillators to generate binary trend signals.

iTrend_hist
Indicator

iTrend_hist

iBearsPoweriBandsiBullsPower

This indicator identifies trend direction by comparing price position relative to Bollinger Band envelopes against an aggregated Bull and Bear power momentum sum.

iTrend_v1
Indicator

iTrend_v1

iBearsPoweriBandsiBullsPower

This indicator visualizes market sentiment by mapping price deviation relative to Bollinger Bands against a composite bullish and bearish power momentum sum.

iTrend_v2
Indicator

iTrend_v2

iBearsPoweriBandsiBullsPower

This indicator quantifies market sentiment by comparing price proximity to Bollinger Band envelopes against the aggregate polarity of bullish and bearish power dynamics.

iTrend_v3
Indicator

iTrend_v3

iBearsPoweriBandsiBullsPower
i_daybb_v1_1
Indicator

i_daybb_v1_1

iBands

This indicator calculates Bollinger Band extremes by dynamically determining the number of bars within a specific multi-day lookback window to assess historical volatility.

i_Trend
Indicator

i_Trend

iBearsPoweriBandsiBullsPower

The indicator calculates the divergence between price action and Bollinger Band boundaries while simultaneously synthesizing a momentum net from bullish and bearish power metrics.

i_Trend_002
Indicator

i_Trend_002

iBearsPoweriBandsiBullsPower

This indicator calculates the divergence between current price action and Bollinger Band boundaries while incorporating a weighted sum of bullish and bearish power metrics.

i_Trend_004
Indicator

i_Trend_004

iBearsPoweriBandsiBullsPower

This indicator calculates the discrepancy between real-time price action and Bollinger Band extremes while simultaneously synthesizing a power-sum of bullish and bearish pressure.

i_Trend_005
Indicator

i_Trend_005

iBearsPoweriBandsiBullsPower
i_Trend_v1
Indicator

i_Trend_v1

iBearsPoweriBandsiBullsPower

This indicator calculates the variance between current price action and Bollinger Band extremes while integrating a dual-layered power momentum filter to identify trend exhaustion.

i_Trend_v3
Indicator

i_Trend_v3

iBearsPoweriBandsiBullsPower

This indicator calculates the divergence between current price action and Bollinger Band boundaries while simultaneously aggregating bullish and bearish momentum power.

i_Trend_v4
Indicator

i_Trend_v4

iBearsPoweriBandsiBullsPower

This indicator quantifies market velocity by calculating the differential between real-time price action and Bollinger Band extremes while overlaying a synthesized bullish-bearish power equilibrium.

KG FLAT DETECTOR
Indicator

KG FLAT DETECTOR

iBandsiMA

This indicator analyzes price velocity by comparing a short-term moving average against weighted Bollinger Band extremities to identify non-trending, stagnant market phases.