Hull Trend1_v1
Indicator

Hull Trend1_v1

iMAiMAOnArray

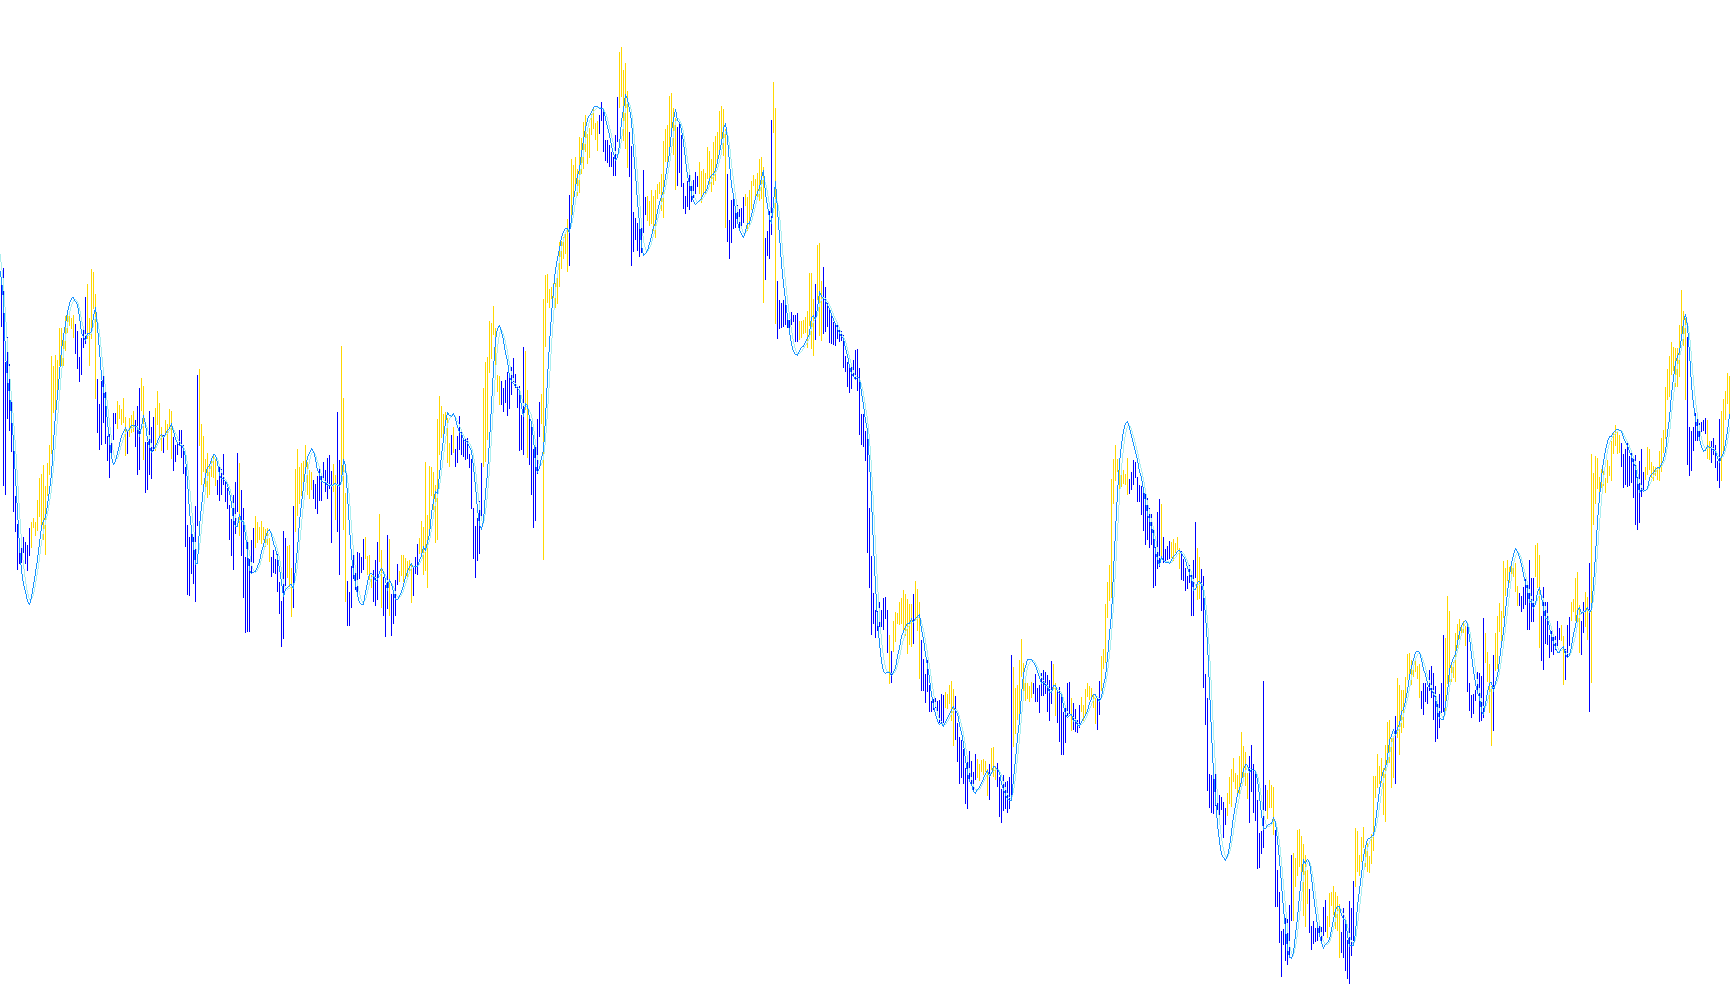
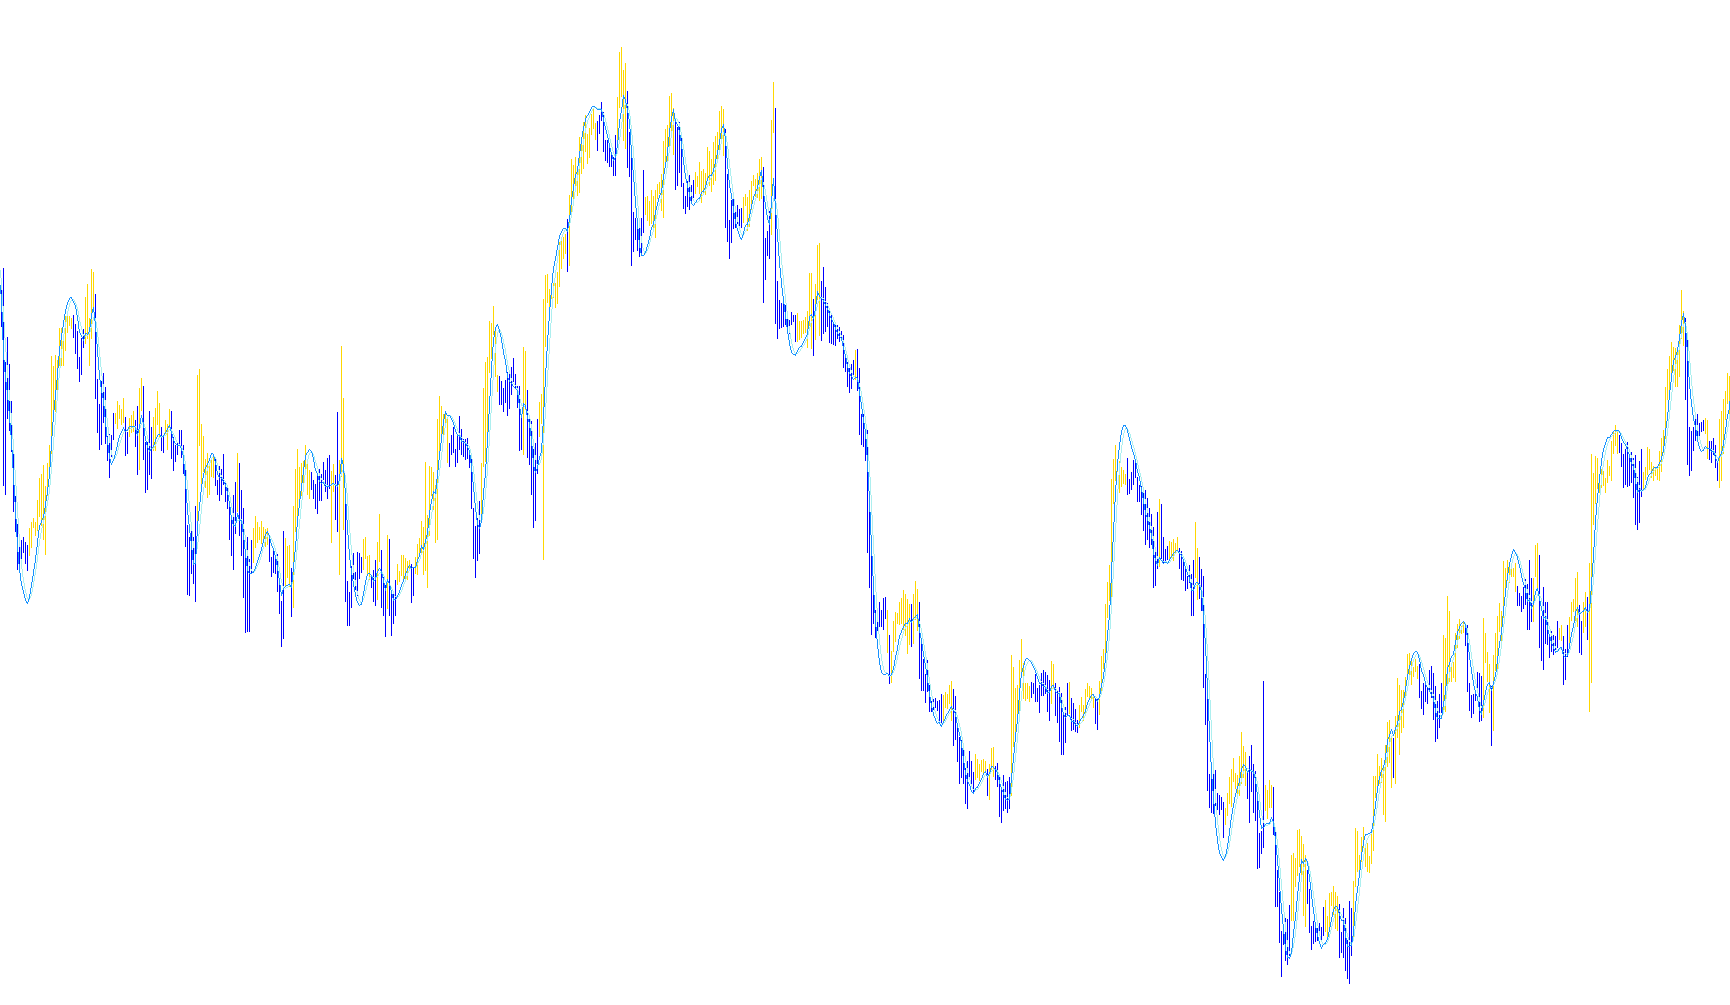
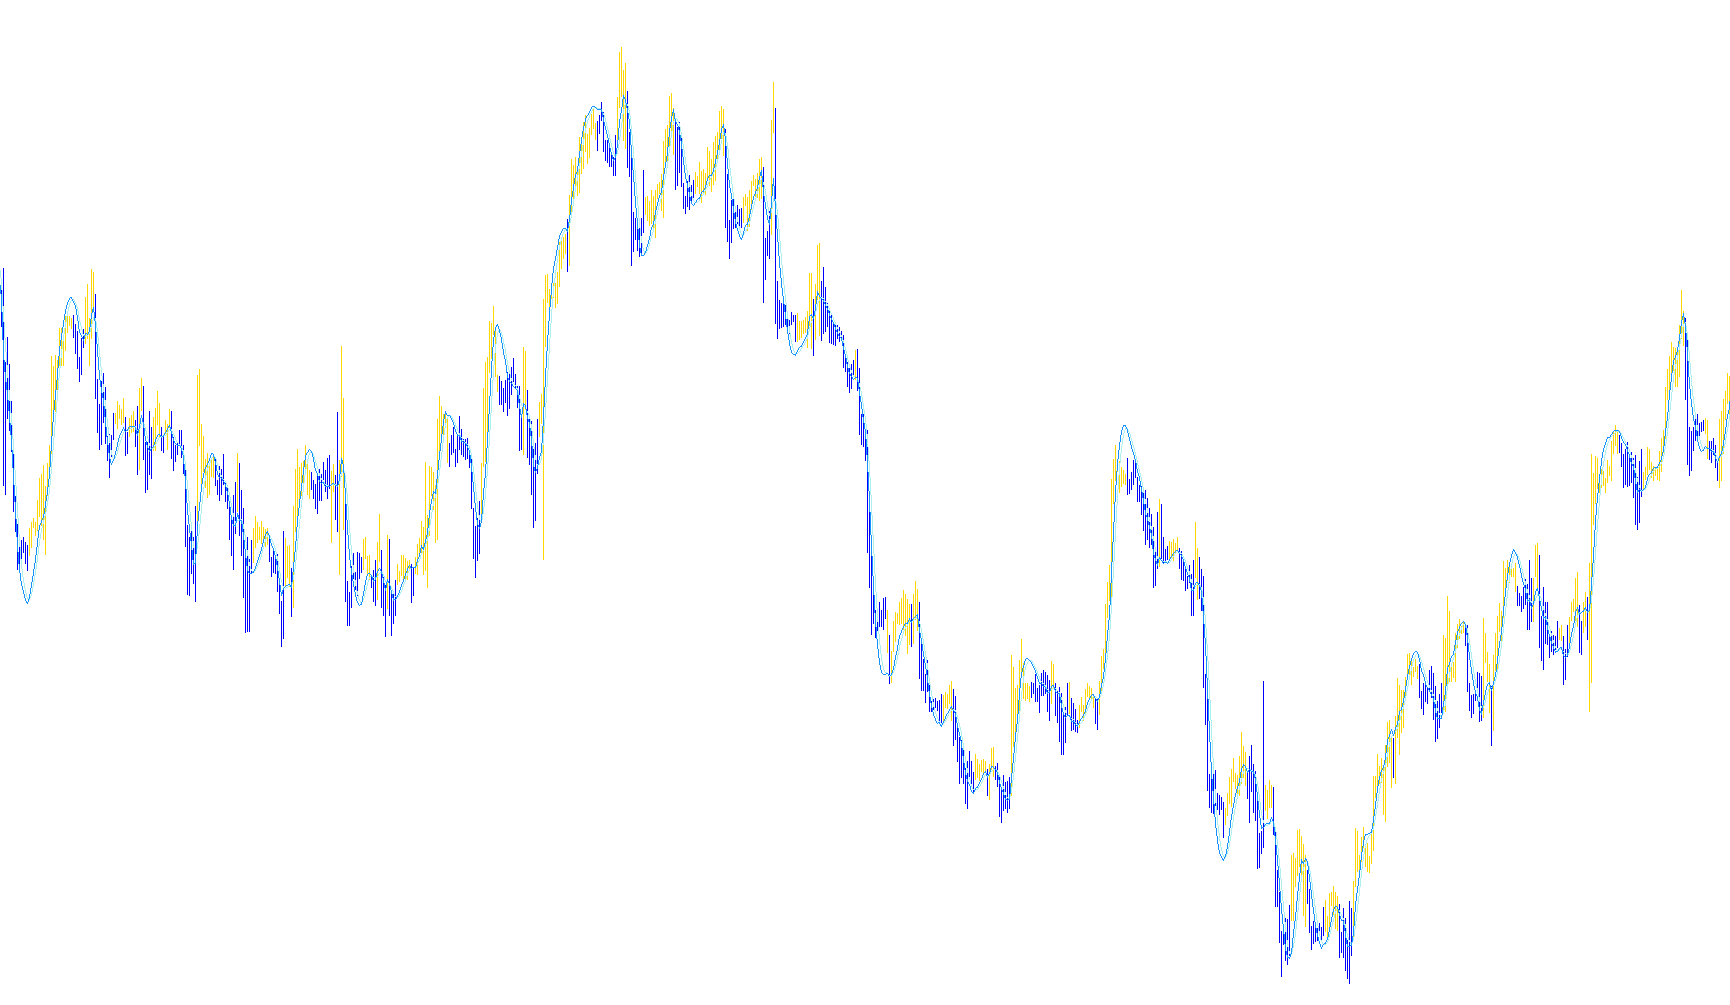
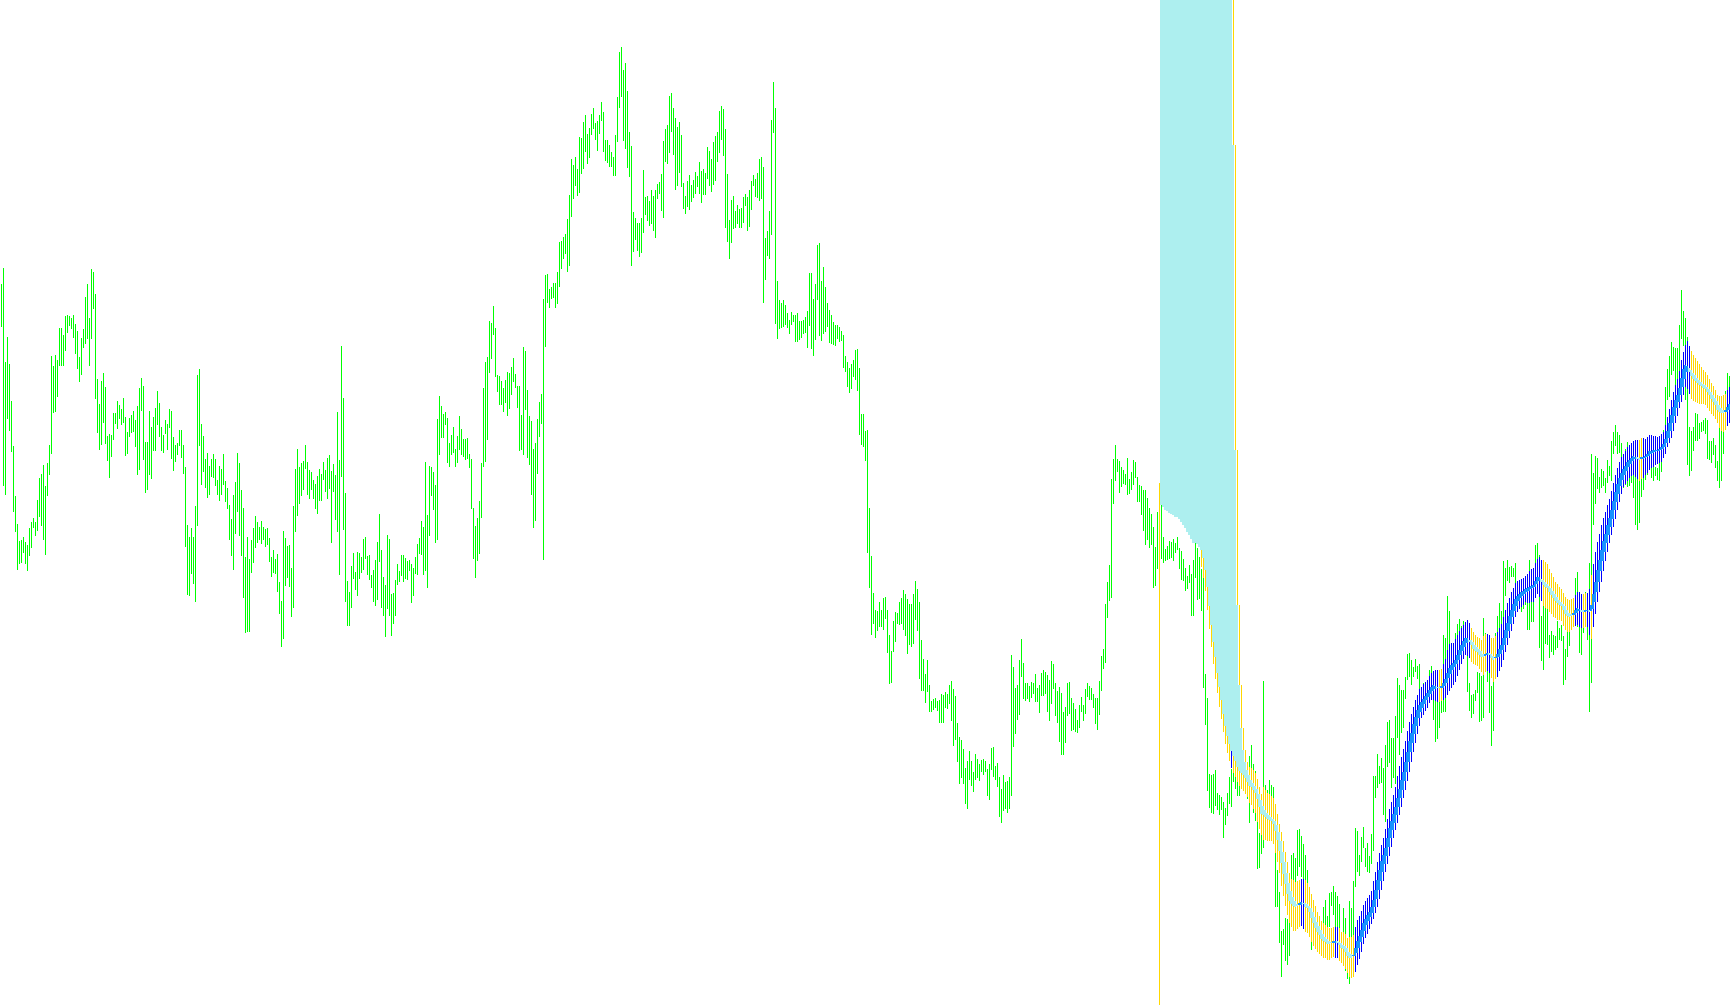
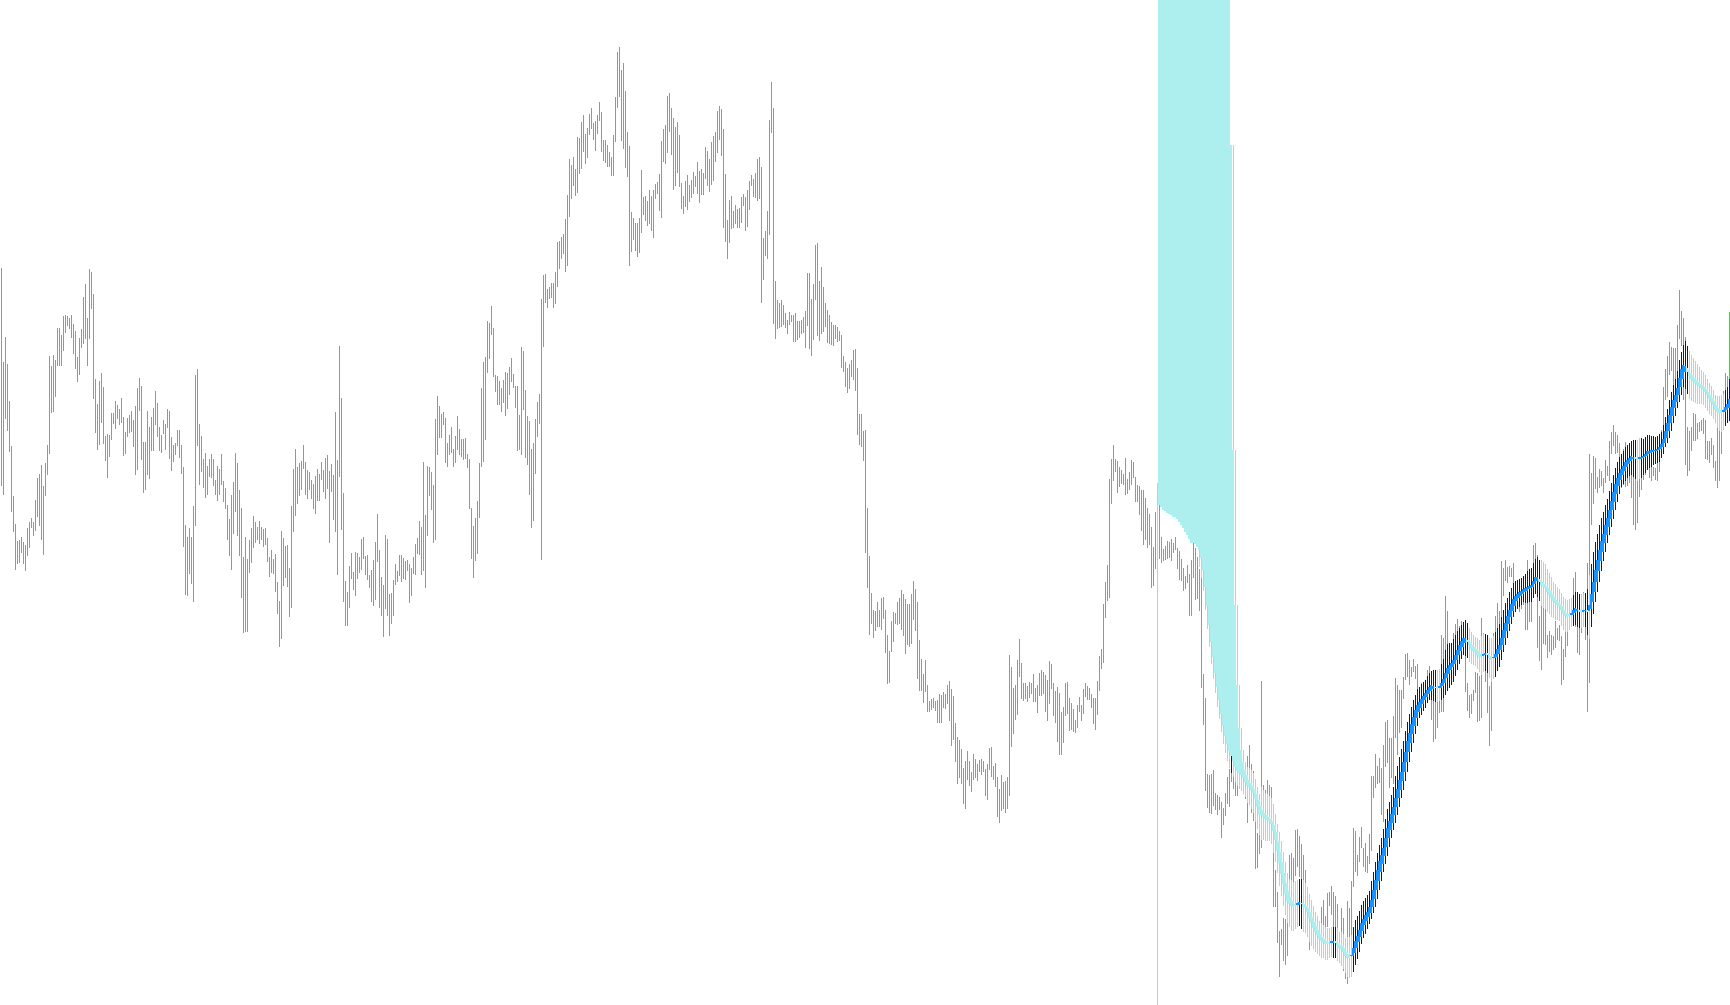
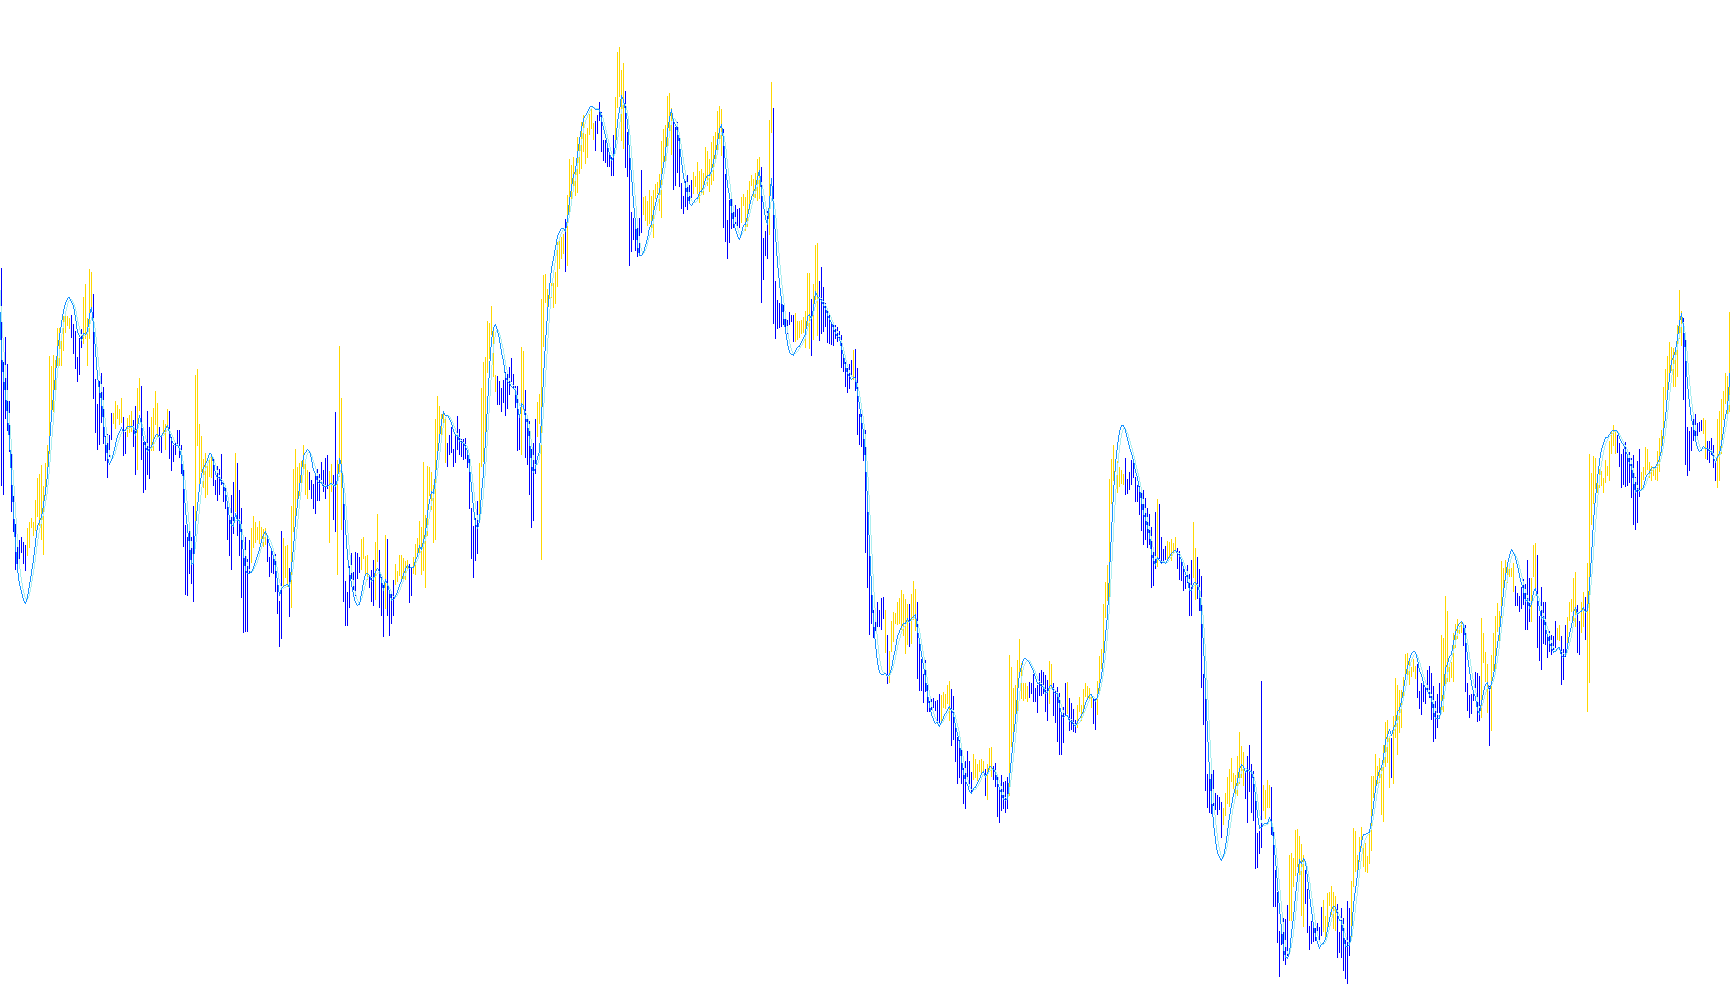
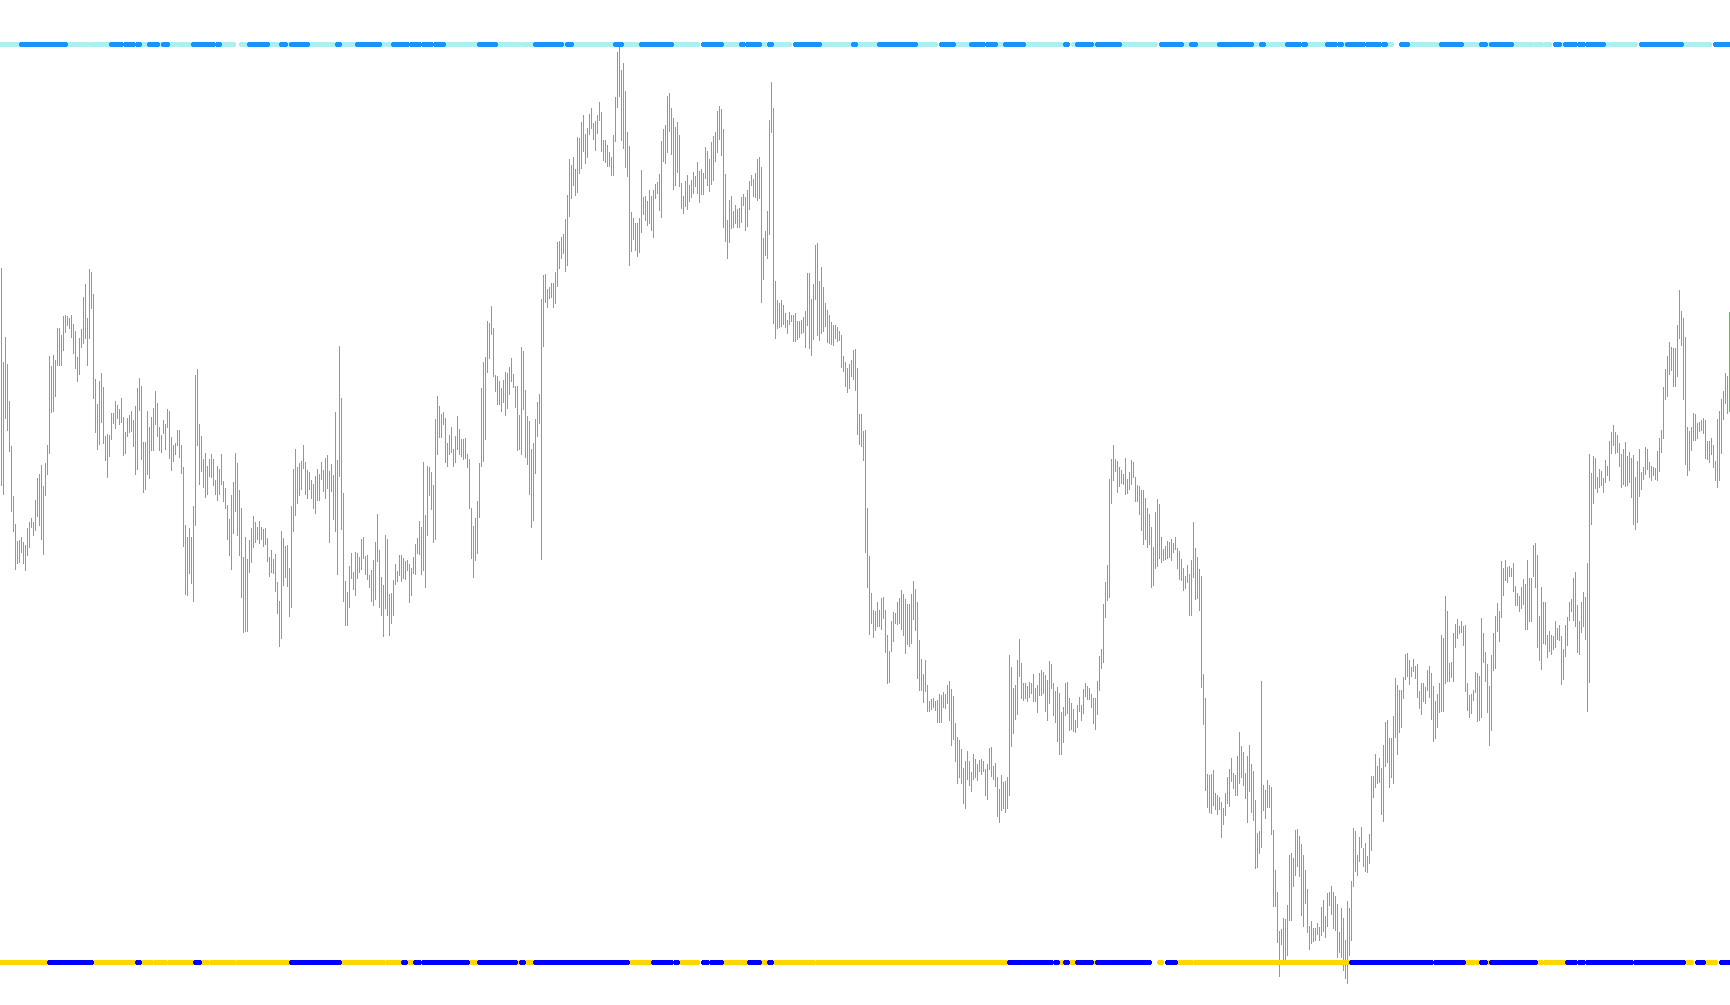
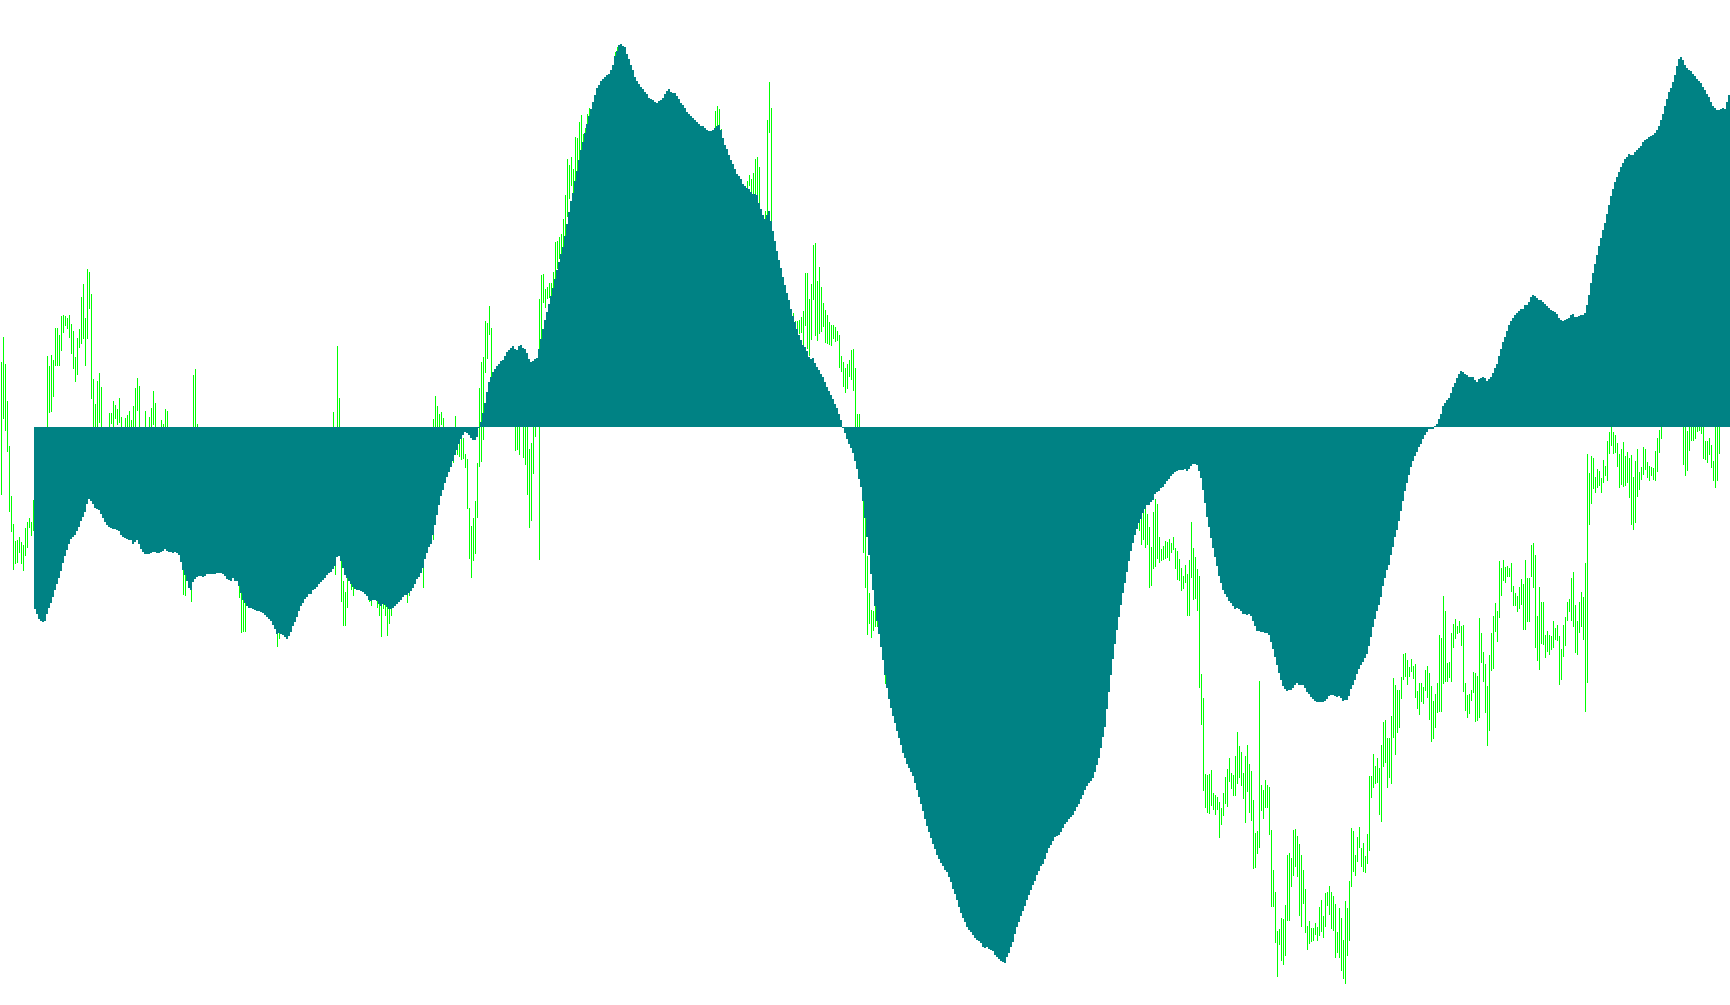
This indicator identifies trend direction by calculating the weighted variance between a dual-layered linear weighted moving average and its square-root adjusted derivative.

Hull Trend_001
Indicator

Hull Trend_001

iMAiMAOnArray

This indicator identifies trend direction by calculating the weighted difference between dual linear moving averages and comparing them against a square-root smoothed Hull Moving Average output.

Hull Trend_v1
Indicator

Hull Trend_v1

iMAiMAOnArray

This indicator identifies directional shifts by calculating the variance between weighted moving average components to project trend flow and highlight price extremes.

Hull Trend_v2
Indicator

Hull Trend_v2

iMAiMAOnArray

This indicator calculates the Hull Moving Average to identify structural momentum shifts by comparing smoothed price velocity against dynamic lag-reduced averages.

Hull Trend_v3
Indicator

Hull Trend_v3

iMAiMAOnArray

This indicator calculates a dynamic trend envelope by applying a linear weighted moving average to the difference between two offset Hull Moving Averages to identify directional momentum.

Hull-MA
Indicator

Hull-MA

iMAiMAOnArray

This indicator calculates a weighted linear moving average of the difference between two distinct weighted periods to minimize lag and provide rapid price trend tracking.

Hull-MA_v1
Indicator

Hull-MA_v1

iMAiMAOnArray

This algorithm utilizes a nested linear weighted moving average structure to minimize phase lag while maintaining high responsiveness to price curvature.

Hull_HAMA
Indicator

Hull_HAMA

iMA

This indicator synthesizes Hull Moving Average calculations with Heikin Ashi price logic to smooth out market noise and visualize trend momentum through high/low extremes.

Hull_HAMA_001
Indicator

Hull_HAMA_001

iMA

This indicator synthesizes Hull Moving Average calculations with Heikin Ashi price transformations to generate smoothed trend channels and mean reversion signals.

Hull_HAMA_m
Indicator

Hull_HAMA_m

iMA

This indicator synthesizes Hull Moving Average smoothing with Heikin-Ashi price action logic to filter market noise and visualize trend momentum.

Hull_Moving_Average
Indicator

Hull_Moving_Average

iMAiMAOnArray

This indicator utilizes a nested linear weighted average calculation to generate a high-responsiveness trend line that minimizes lag while smoothing price fluctuations.

Hull_O_H_L_C
Indicator

Hull_O_H_L_C

iMA

This indicator synthesizes Hull Moving Average dynamics with Heikin-Ashi price smoothing to identify momentum shifts through multi-buffer trend crossovers.

Hull_O_H_L_C_001
Indicator

Hull_O_H_L_C_001

iMA

This indicator synthesizes Hull Moving Average calculations with Heikin Ashi candle logic to smooth price volatility and identify trend momentum across four distinct data buffers.

Hull_O_H_L_C_v2
Indicator

Hull_O_H_L_C_v2

iMA

This indicator synthesizes Hull Moving Average dynamics with Heikin-Ashi price action by calculating smoothed open, high, low, and close values to identify trend momentum.

Hull_Trend
Indicator

Hull_Trend

iMAiMAOnArray

This indicator calculates the Hull Moving Average to identify trend direction and dynamically plots high-low boundaries based on momentum crossover thresholds.

H_Bulls_n_Bears
Indicator

H_Bulls_n_Bears

iMA

This indicator quantifies the relative strength between fast and slow weighted moving averages to reveal the prevailing tug-of-war between bullish and bearish market participants.

i-BandsPrice
Indicator

i-BandsPrice

iMAiMAOnArray

This indicator quantifies the relative position of current price within Bollinger Band boundaries to produce a normalized value smoothed by an移動平均線 array.

i-BandsWidth
Indicator

i-BandsWidth

iMAiMAOnArray

This indicator quantifies market expansion by calculating the relative ratio between upper and lower Bollinger Band extremes against the moving average price.

Indicator

i-CAi

iMAiStdDev
Indicator

i-CAi_v1

iMAiStdDev
i-GentorLSMA&EMA_v.1.1
Indicator

i-GentorLSMA&EMA_v.1.1

iMA

This indicator calculates the dynamic spatial gap between price action and both Linear Weighted Moving Averages (LSMA) and Exponential Moving Averages (EMA) to identify momentum exhaustion and trend deviations.

i-GentorLSMA&EMA_v1.0
Indicator

i-GentorLSMA&EMA_v1.0

iMA

This indicator visualizes price divergence by mapping the relative position of the current close against synchronized Exponential and Linear Weighted Moving Average thresholds.

i-GentorLSMA&EMA_v1[1].0
Indicator

i-GentorLSMA&EMA_v1[1].0

iMA

The algorithm monitors price deviations relative to smoothed moving averages and linear weighted distributions to visualize bullish or bearish momentum shifts.

i-GentorLSMA&EMA_v[1].0.2
Indicator

i-GentorLSMA&EMA_v[1].0.2

iMA

The logic identifies trend boundaries by filtering price action against a Typical Price EMA while simultaneously detecting momentum shifts via a weighted linear smoothing calculation.

i-GentorLSMA&EMA_v[1].0.2_v1
Indicator

i-GentorLSMA&EMA_v[1].0.2_v1

iMA

This indicator synchronizes Exponential Moving Averages with Linear Stochastic Moving Averages to filter trend reversals and identify price momentum breaches.

i-GentorLSMA&EMA_v[1].0.2_v2
Indicator

i-GentorLSMA&EMA_v[1].0.2_v2

iMA

The algorithm identifies bullish and bearish price action by detecting breaches of the Exponential Moving Average and weighted Least Squares Moving Average boundaries.

i-GentorLSMA&EMA_v[1].1.0
Indicator

i-GentorLSMA&EMA_v[1].1.0

iMA

This indicator identifies trend reversals by monitoring the divergence between price action and dynamic smoothed moving averages (EMA and LSMA) relative to a defined zero-axis threshold.

i-GentorLSMA&EMA_v[1]
Indicator

i-GentorLSMA&EMA_v[1]

iMA

This indicator maps price action relative to smoothed moving averages by plotting specific breach points where the market deviates from EMA and Linear Regression levels.

i-GentorLSMA&EMA_v[1]2.1.0
Indicator

i-GentorLSMA&EMA_v[1]2.1.0

iMA

The indicator identifies bullish and bearish momentum by plotting relative price position against Exponential Moving Averages and Linear Weighted Averages, highlighting breaches of a specified zero-level threshold.

i-GentorLSMA&EMA_v[1]_v1
Indicator

i-GentorLSMA&EMA_v[1]_v1

iMA

Identifies trend momentum by filtering price action based on its relative position to dual linear weighted moving averages and exponential smoothing boundaries.

Indicator

i-MA-ATR-ROC

iATRiMA
i-MaZZSig-T01
Indicator

i-MaZZSig-T01

iMA

This indicator identifies trend reversals by detecting specific intersections between ZigZag pivot points and dual Exponential Moving Average crossovers.

i-RoundPrice-T01m-mod_NonLagMA_2
Indicator

i-RoundPrice-T01m-mod_NonLagMA_2

iMA

This indicator employs a weighted moving average filtered through Gaussian coefficients and trigonometric phase shifts to isolate specific price velocity trends.

Indicator

i1AMA

iMA
iACfunc
Indicator

iACfunc

iMAiMAOnArray

Calculates a secondary momentum oscillator by subtracting a smoothed moving average of the Awesome Oscillator from the original Awesome Oscillator value.

iAnchMom
Indicator

iAnchMom

iMA

Quantifies the percentage divergence between a short-term Exponential Moving Average and a long-term Simple Moving Average to identify trend velocity.

iAnchMom_v1
Indicator

iAnchMom_v1

iMA

Calculates the percentage variance between a fast Exponential Moving Average and a slower Simple Moving Average to quantify relative price velocity.

iAnchMom_v2
Indicator

iAnchMom_v2

iMA

This indicator calculates the percentage variance between a fast Exponential Moving Average and a long-term Simple Moving Average to identify momentum shifts.

iAnchMom_v3
Indicator

iAnchMom_v3

iMA

Calculates the percentage deviation of a fast Exponential Moving Average against a long-period Simple Moving Average to identify structural trend strength.

iAOfunc
Indicator

iAOfunc

iMA

This function calculates the Awesome Oscillator value by computing the arithmetic difference between two Moving Averages of varying periods on a specific symbol and timeframe.

iBearsBullsfuncs
Indicator

iBearsBullsfuncs

iMA

Quantifies market pressure by calculating the absolute distance between extreme price wicks and smoothed moving average baselines.

iCCI_Revercy v1.4
Indicator

iCCI_Revercy v1.4

iCCIiMA

This indicator calculates projected price points by algebraically reversing the Commodity Channel Index formula to estimate potential reversal levels based on a defined CCI threshold.

Indicator

ICWR v0.1 beta4

iMAiRSI
Indicator

ICWR v0.1 beta5

iMAiRSI
Indicator

ICWR v0.1.1 beta5

iMAiRSI
Indicator

ICWR v0.1.1 beta5_v1

iMAiRSI
Indicator

ICWR v0[1].1_BETA5

iMAiRSI
iDPO
Indicator

iDPO

iMA

This indicator calculates the instantaneous price variance between two moving average periods to isolate cyclical oscillations from overarching market trends.

id_lite_info_ma
Indicator

id_lite_info_ma

iMA

This indicator calculates and visualizes the real-time price delta between two moving averages, displaying the results in a customizable on-chart table with dynamic color coding based on trend direction.

iFXAnalyser
Indicator

iFXAnalyser

iMA

This indicator quantifies market momentum by calculating the first derivative (divergence), velocity (slope), and acceleration of two distinct moving averages.