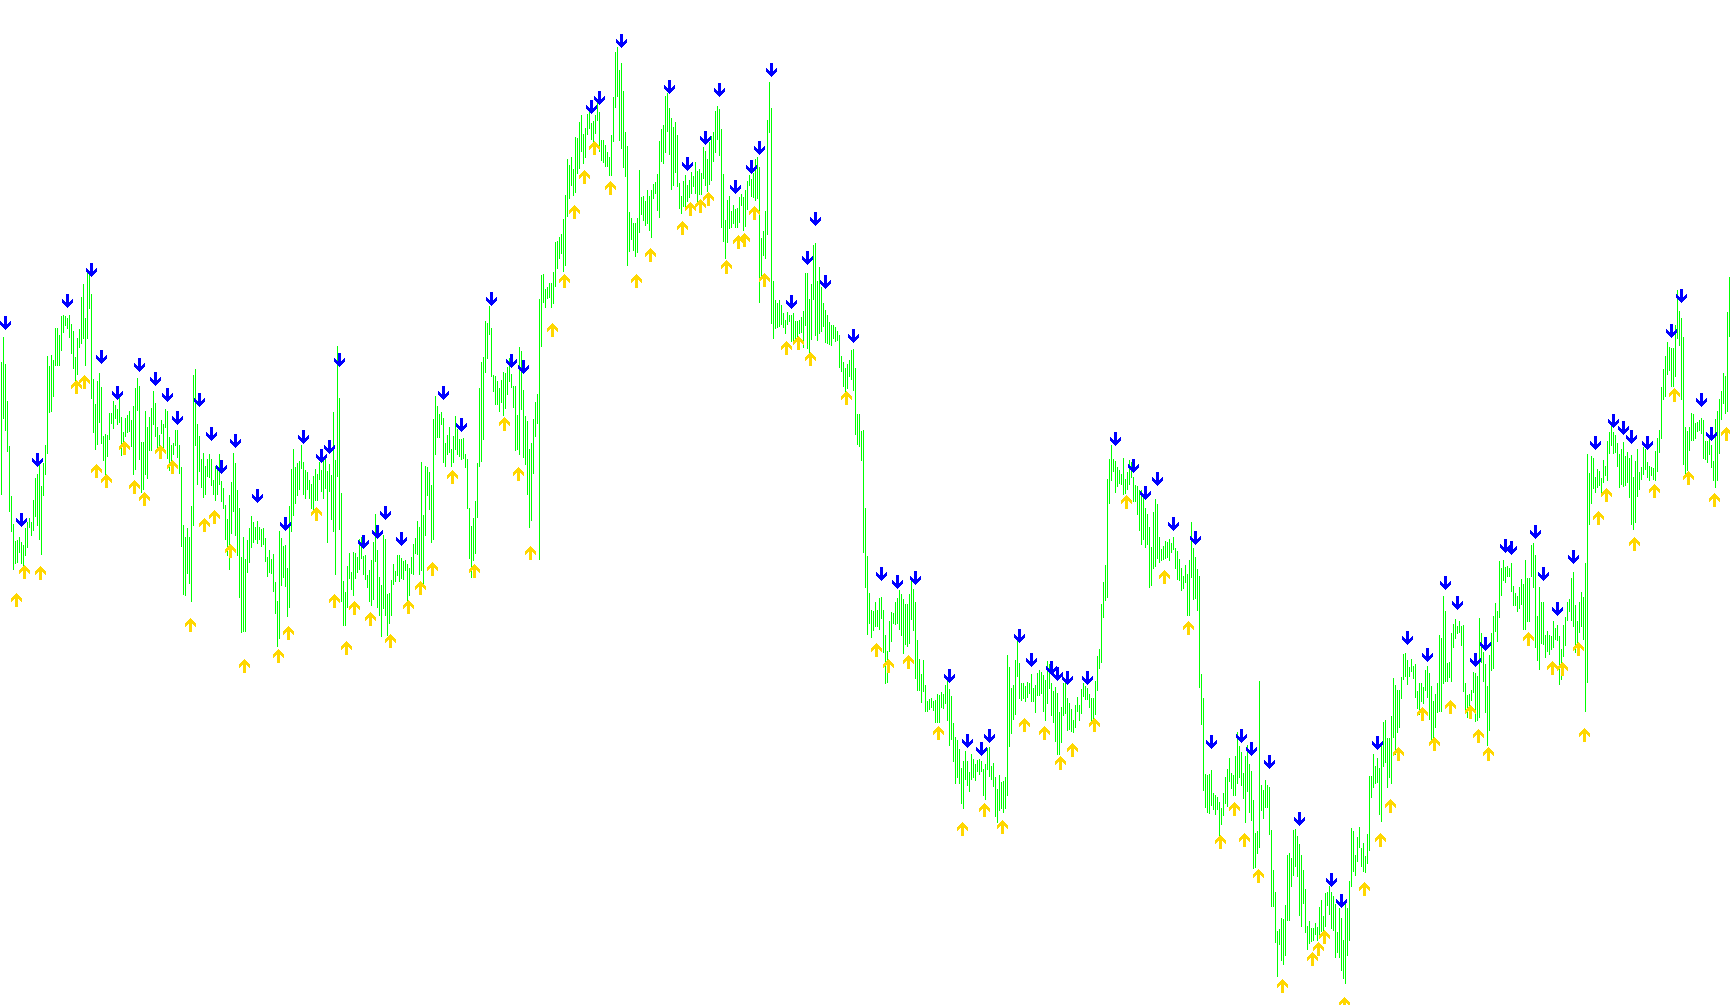
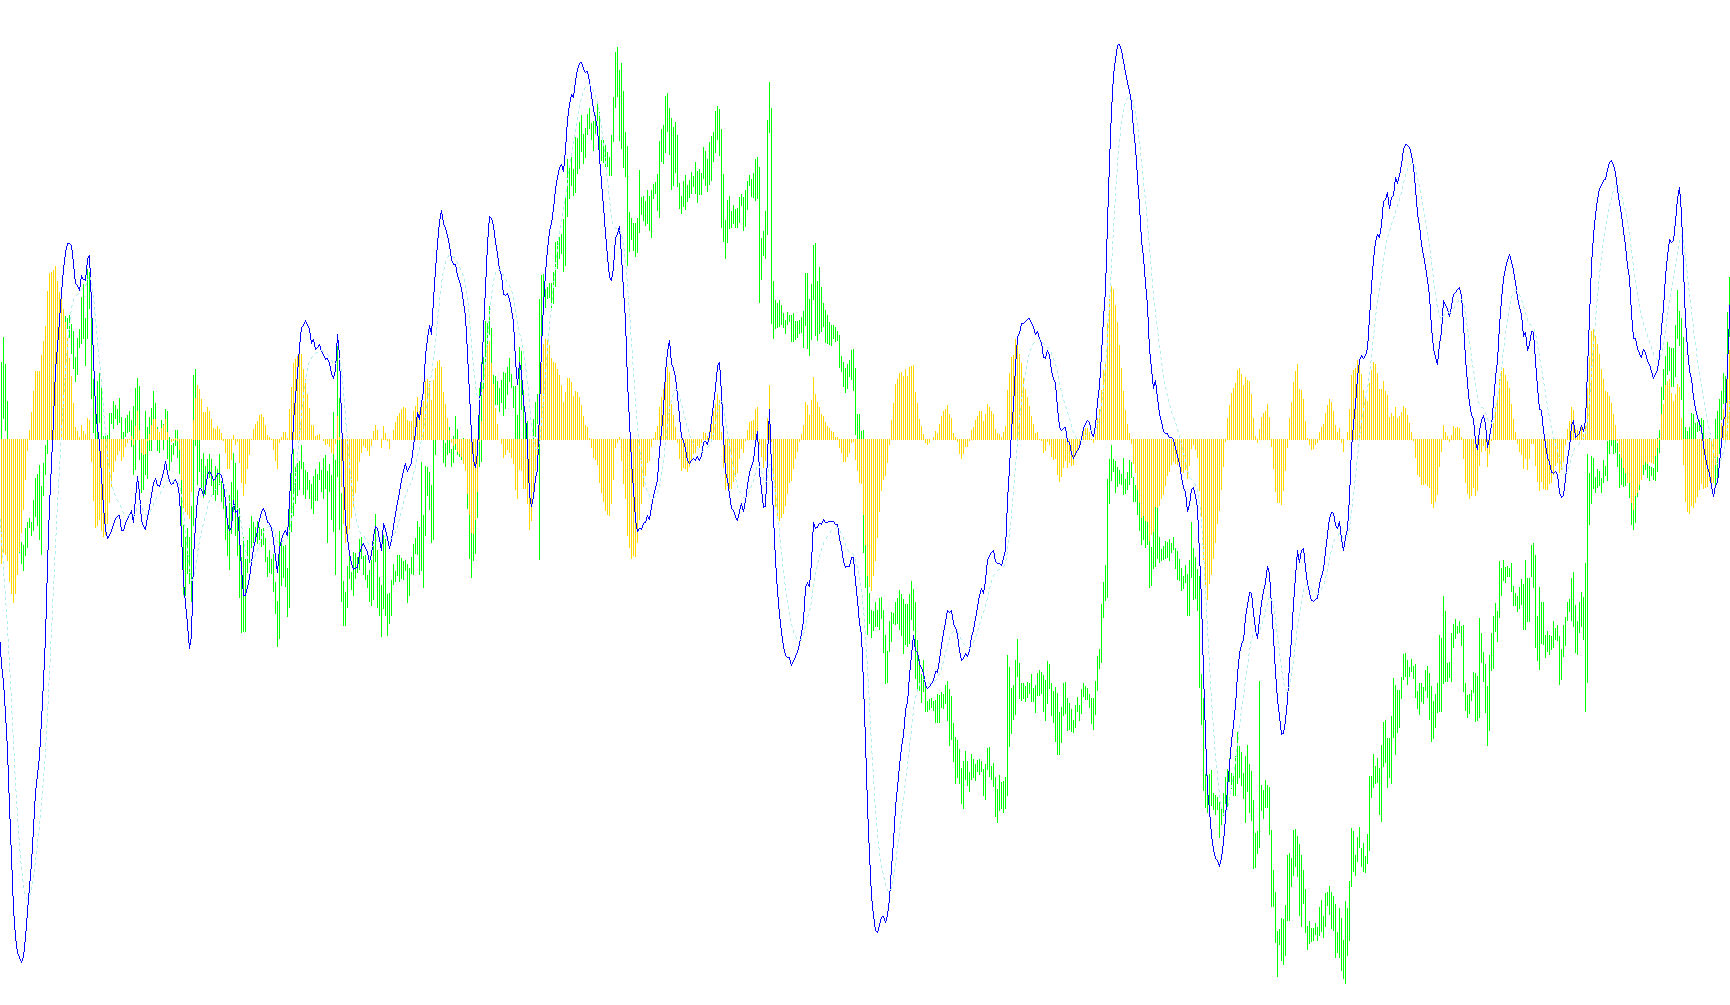
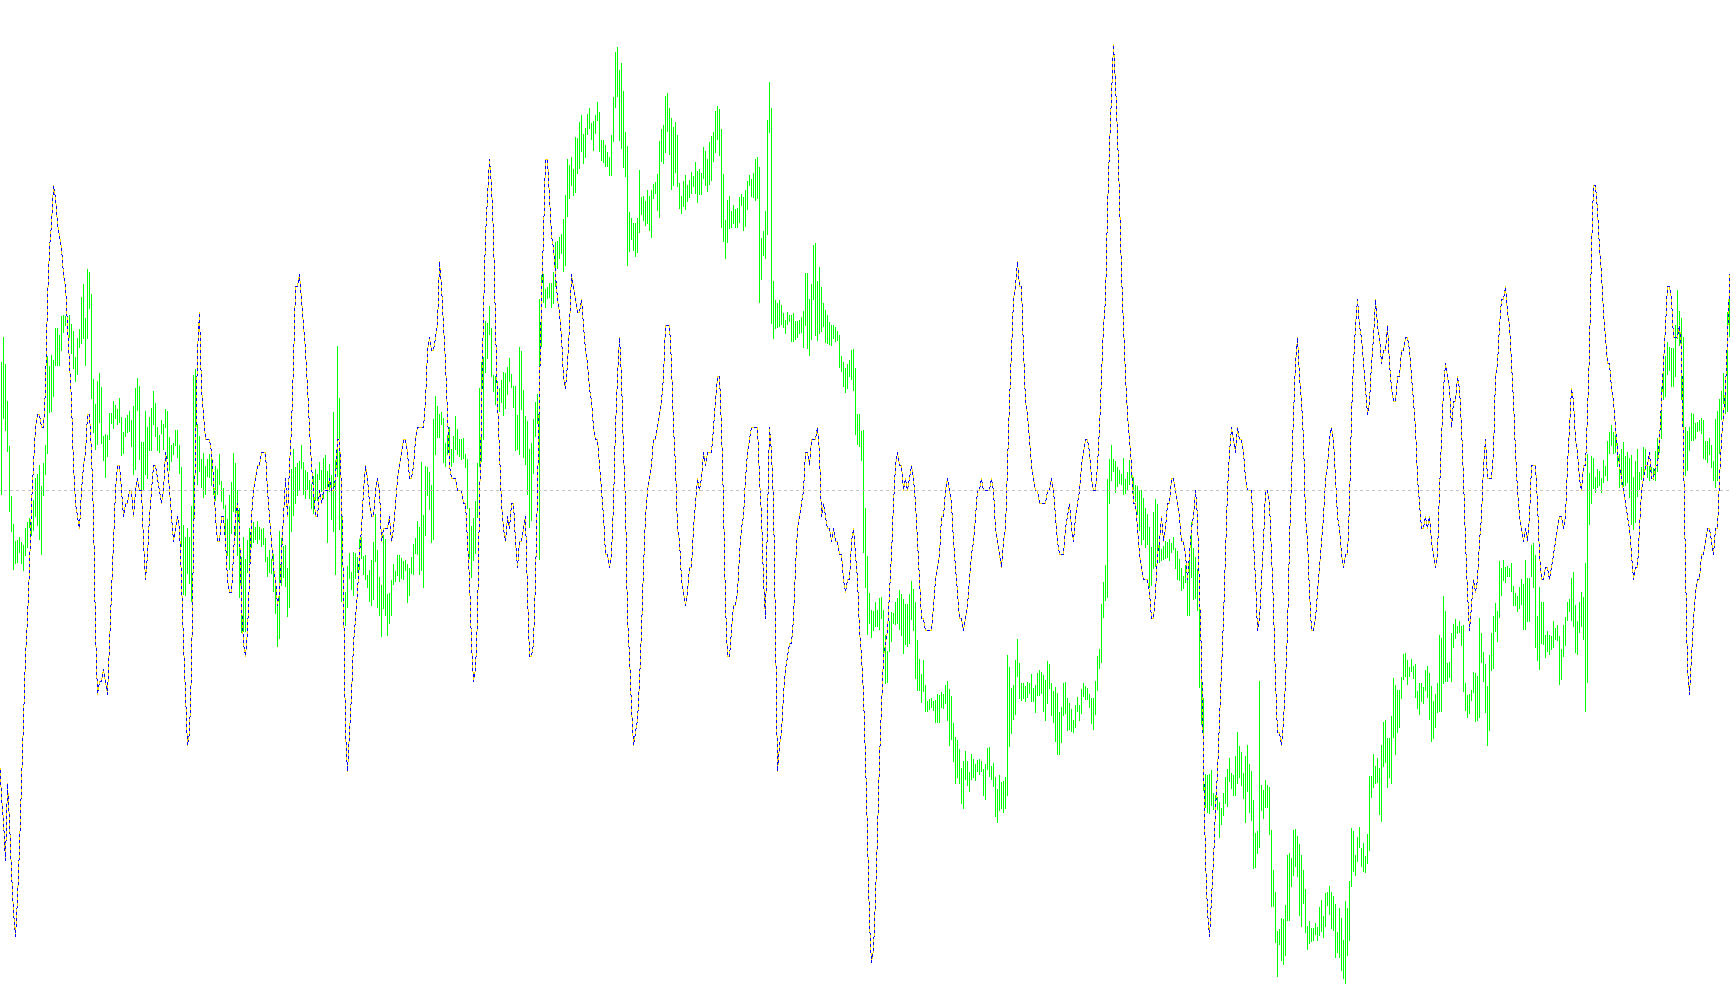
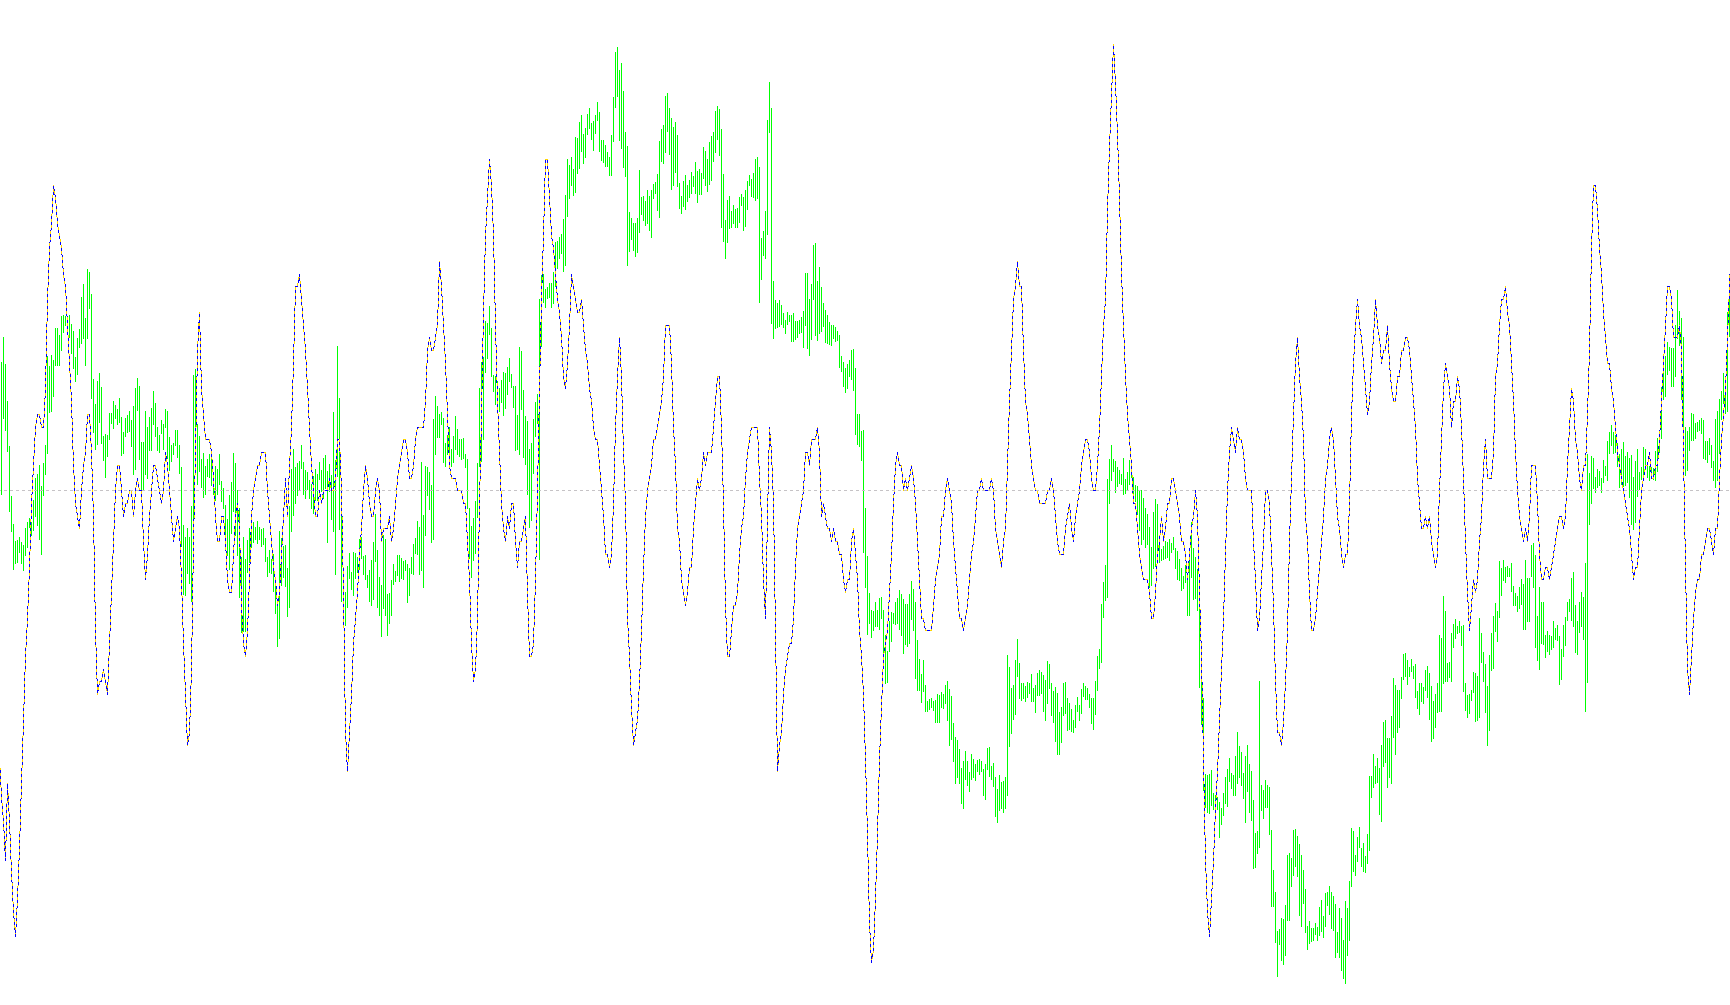
iFXAnalyser_H4-Open
Indicator

iFXAnalyser_H4-Open

iMA

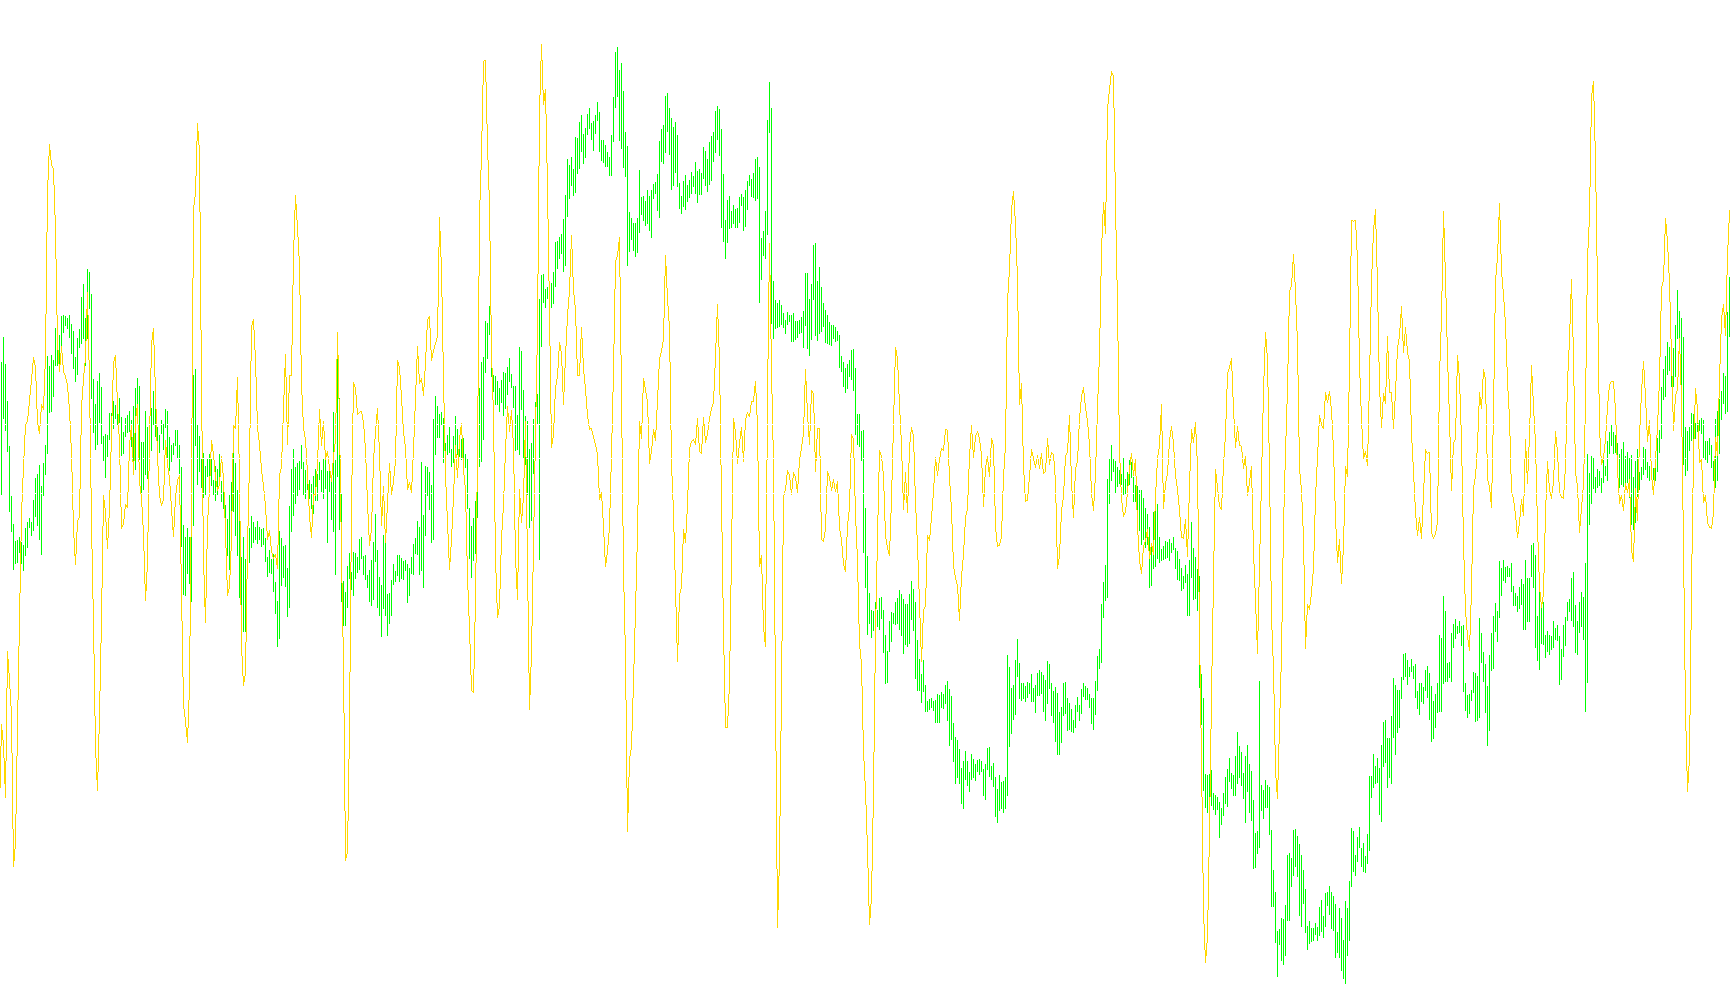
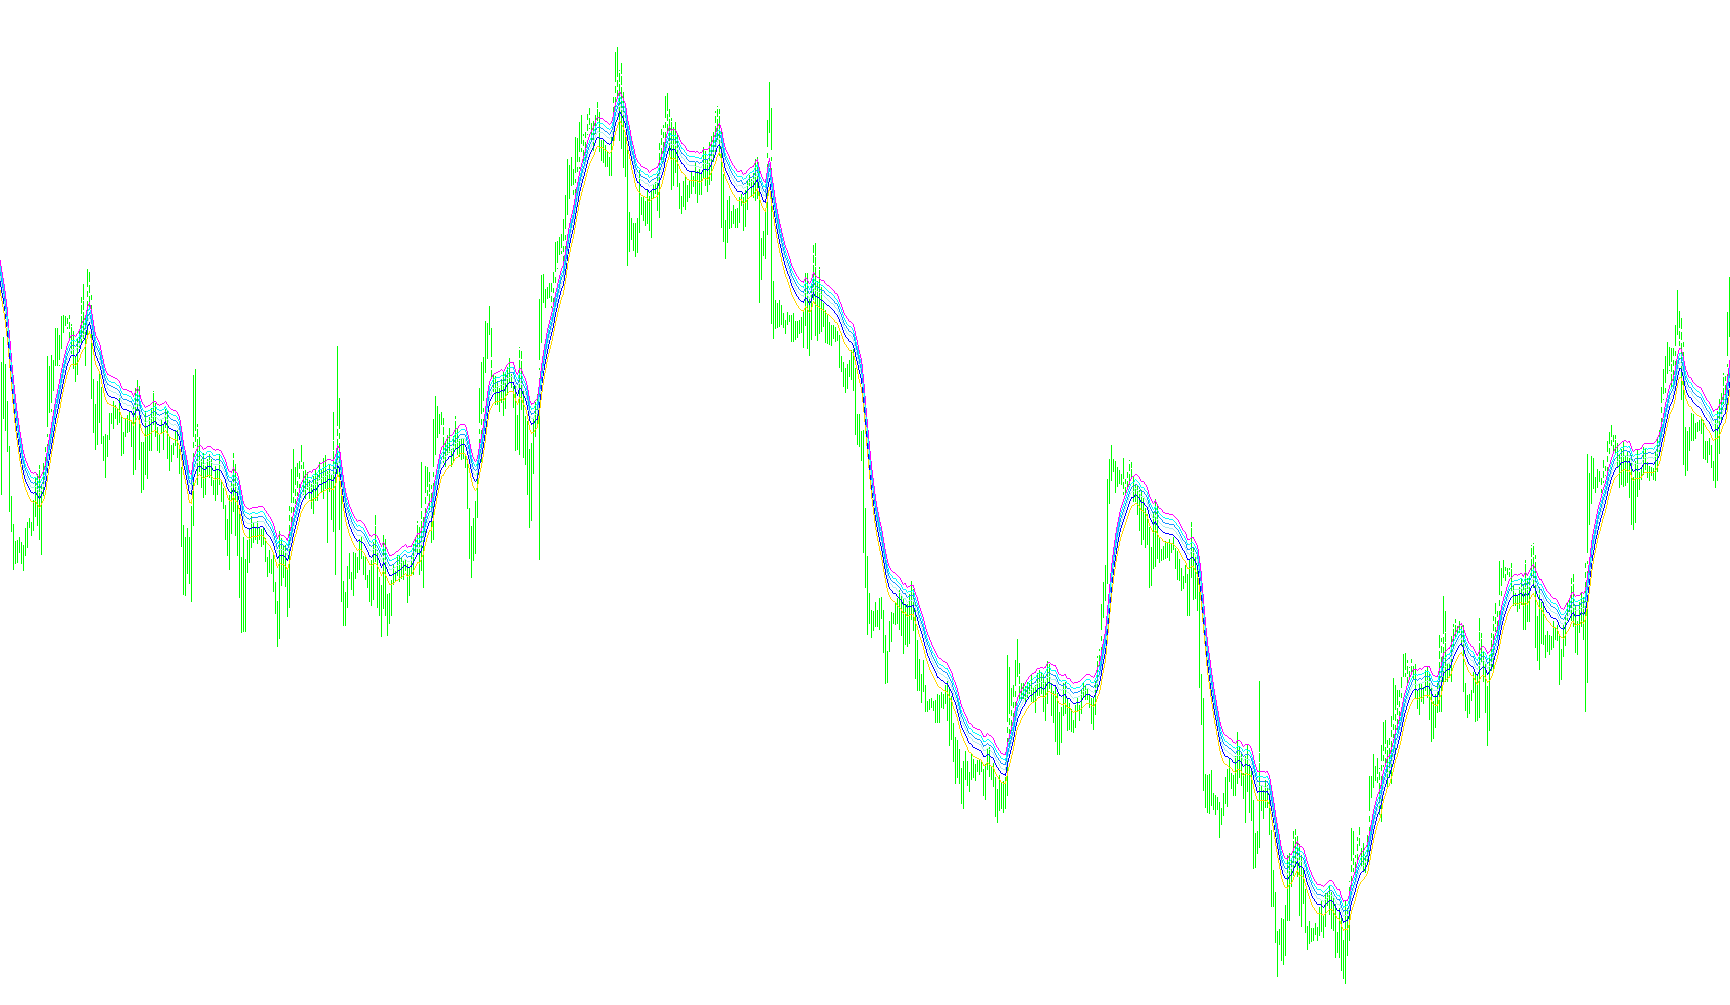
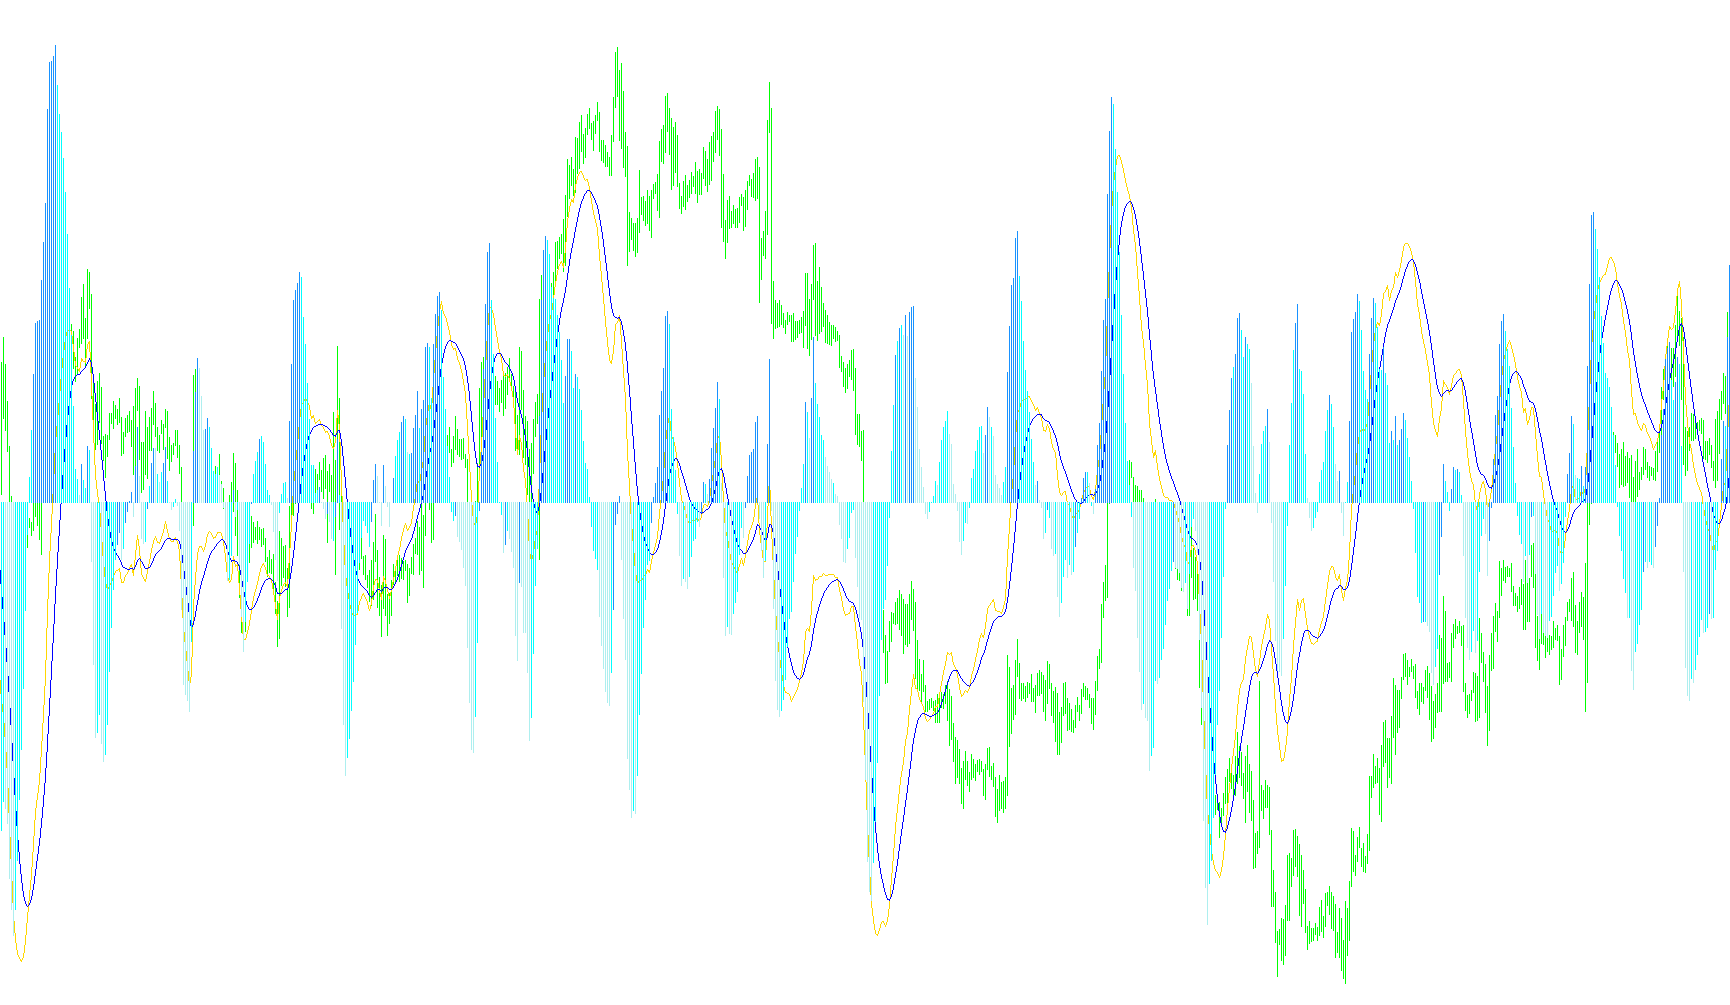
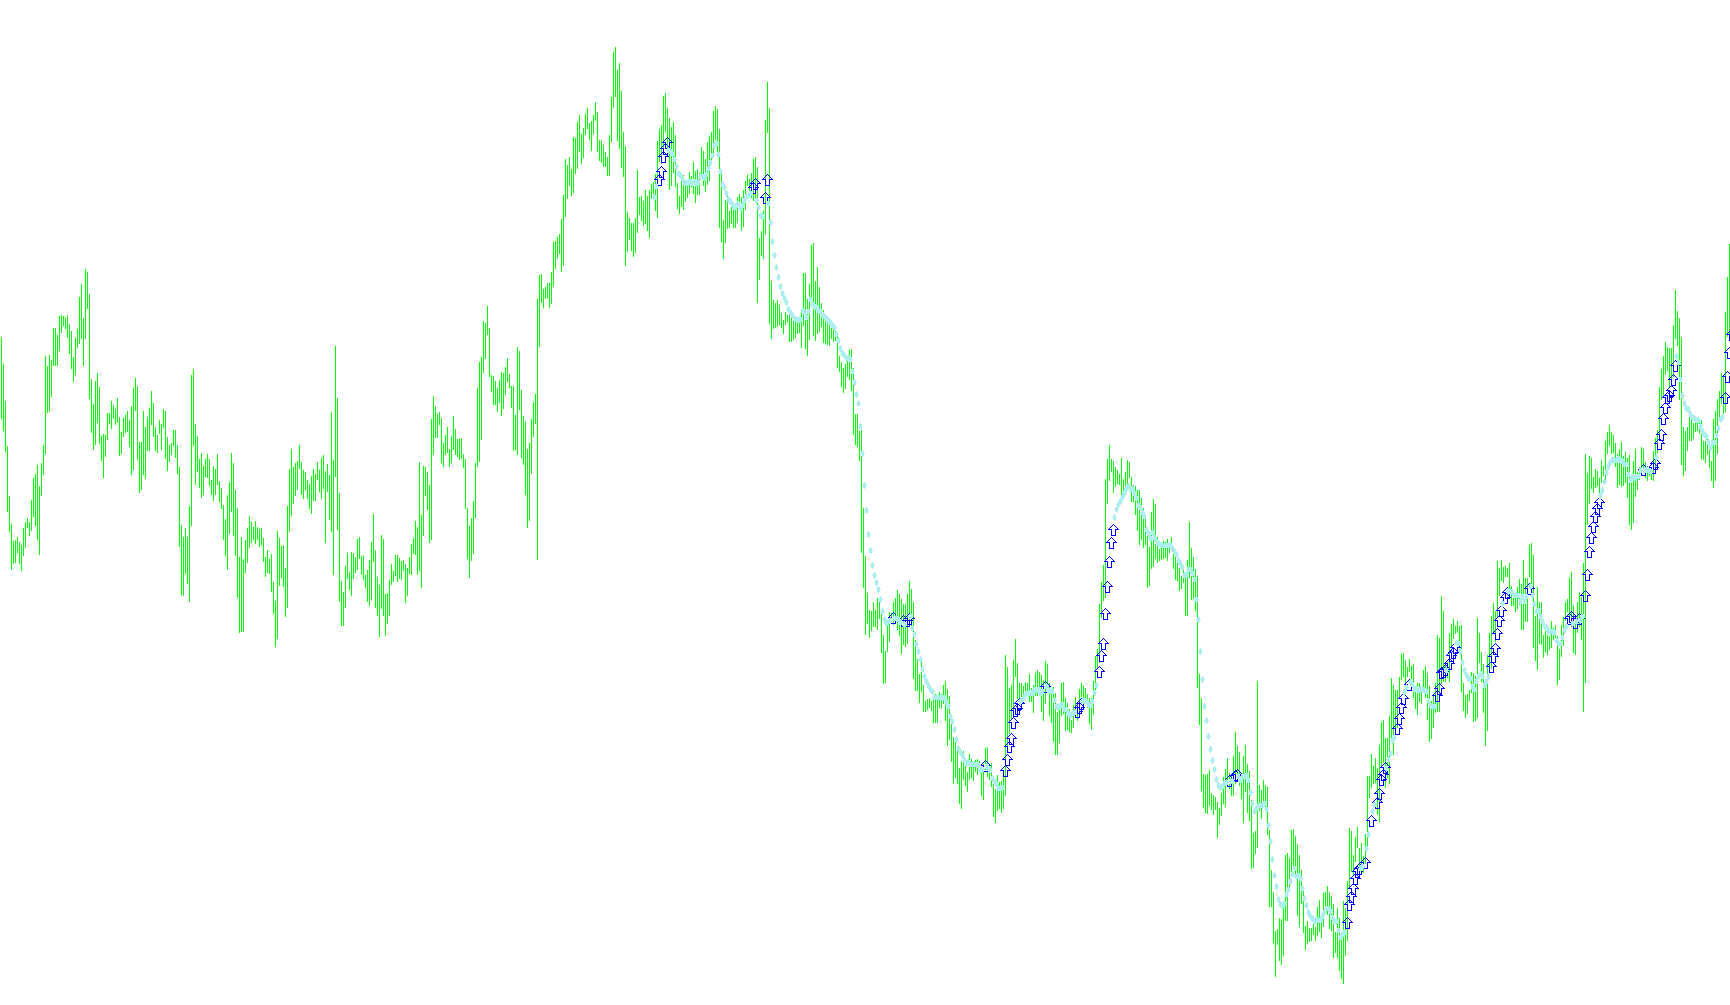
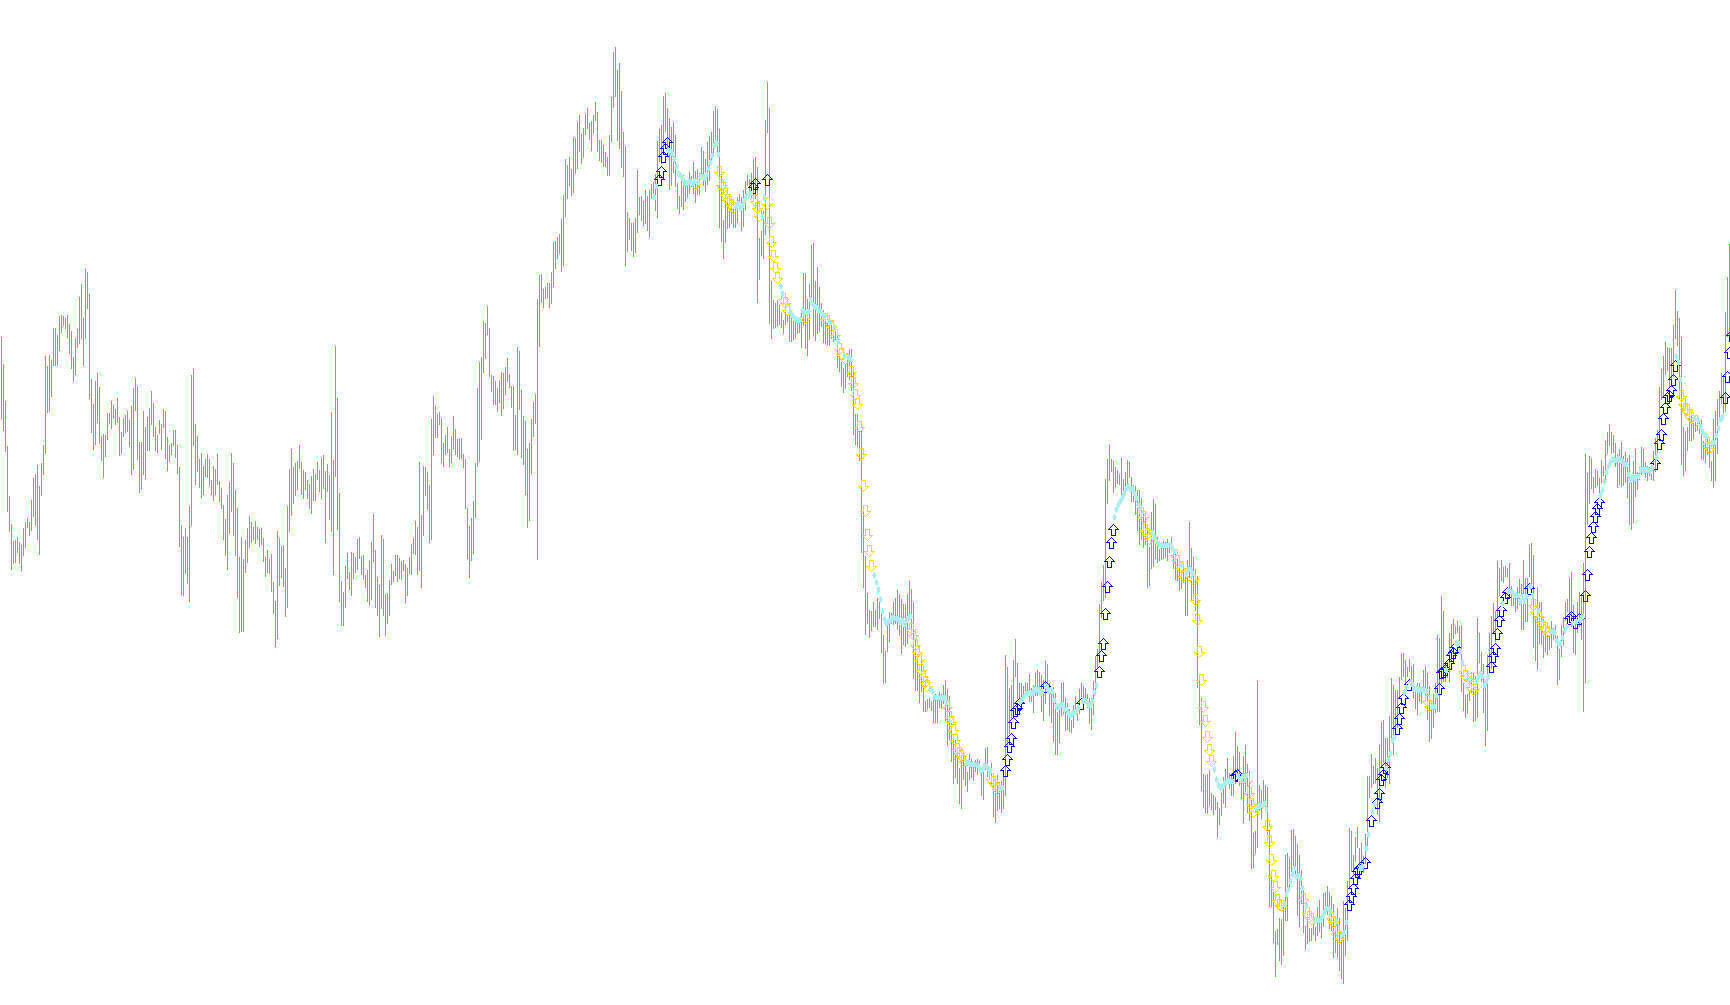
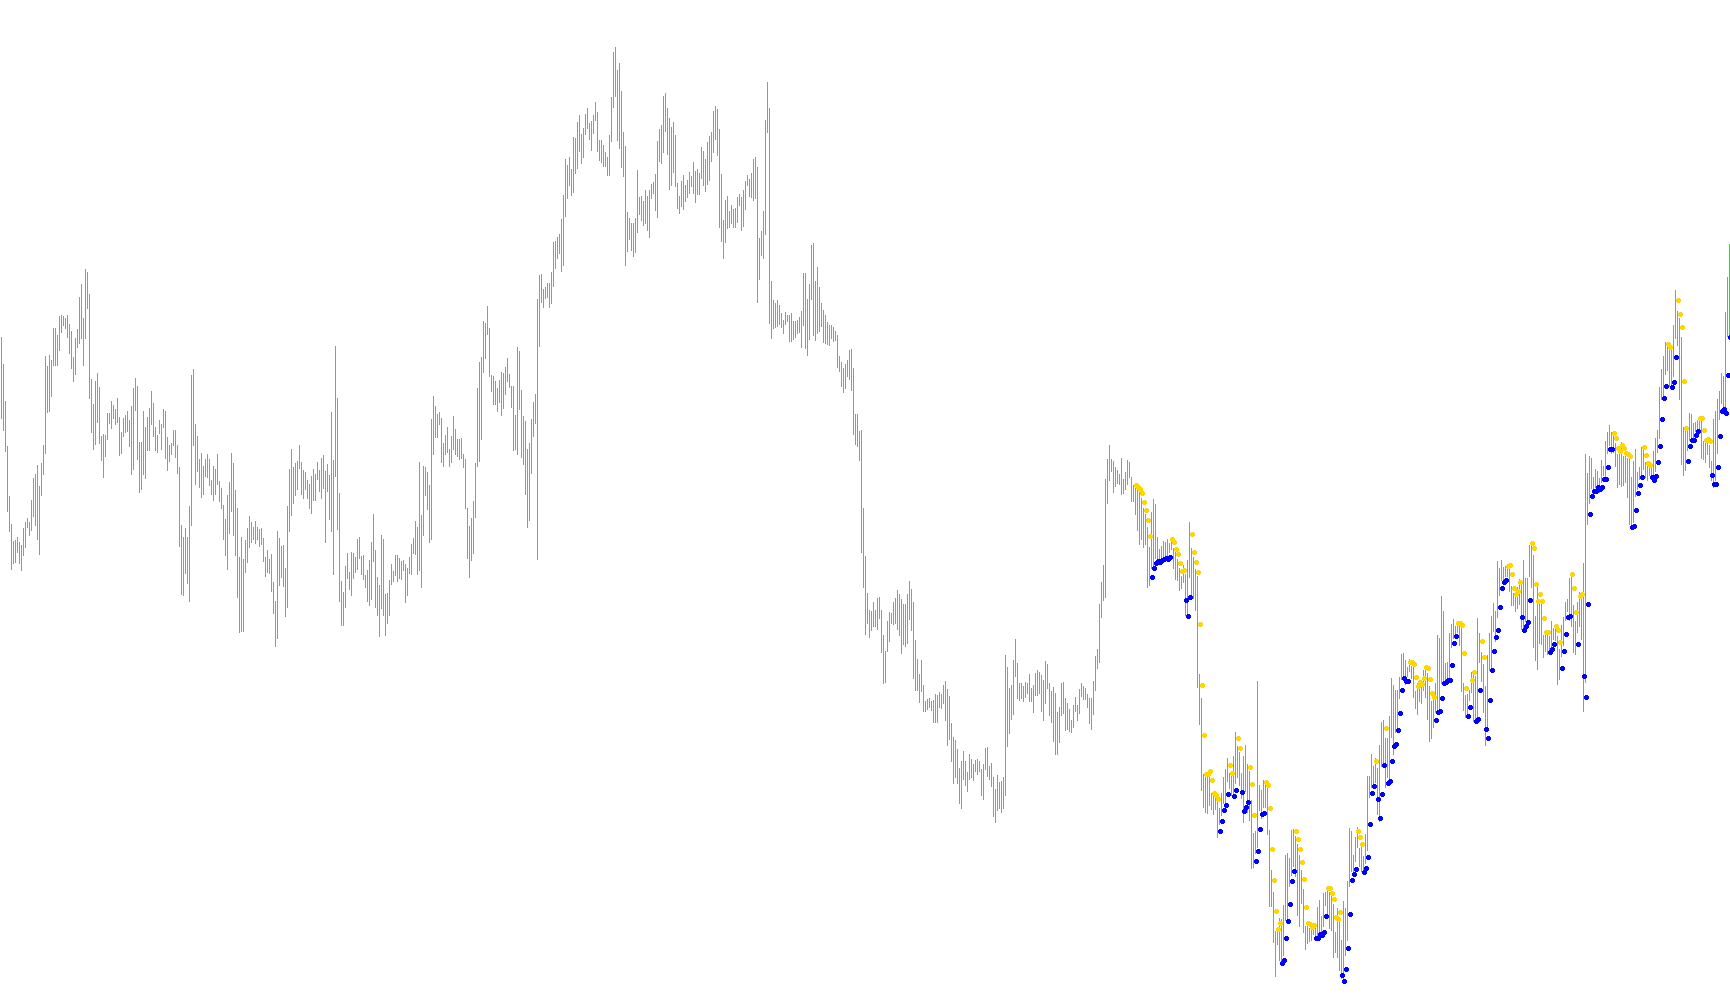
This indicator calculates the numerical spread between two moving averages to identify trend velocity, slope changes, and acceleration dynamics.

iFXAnalyser_H4-Open1
Indicator

iFXAnalyser_H4-Open1

iMA

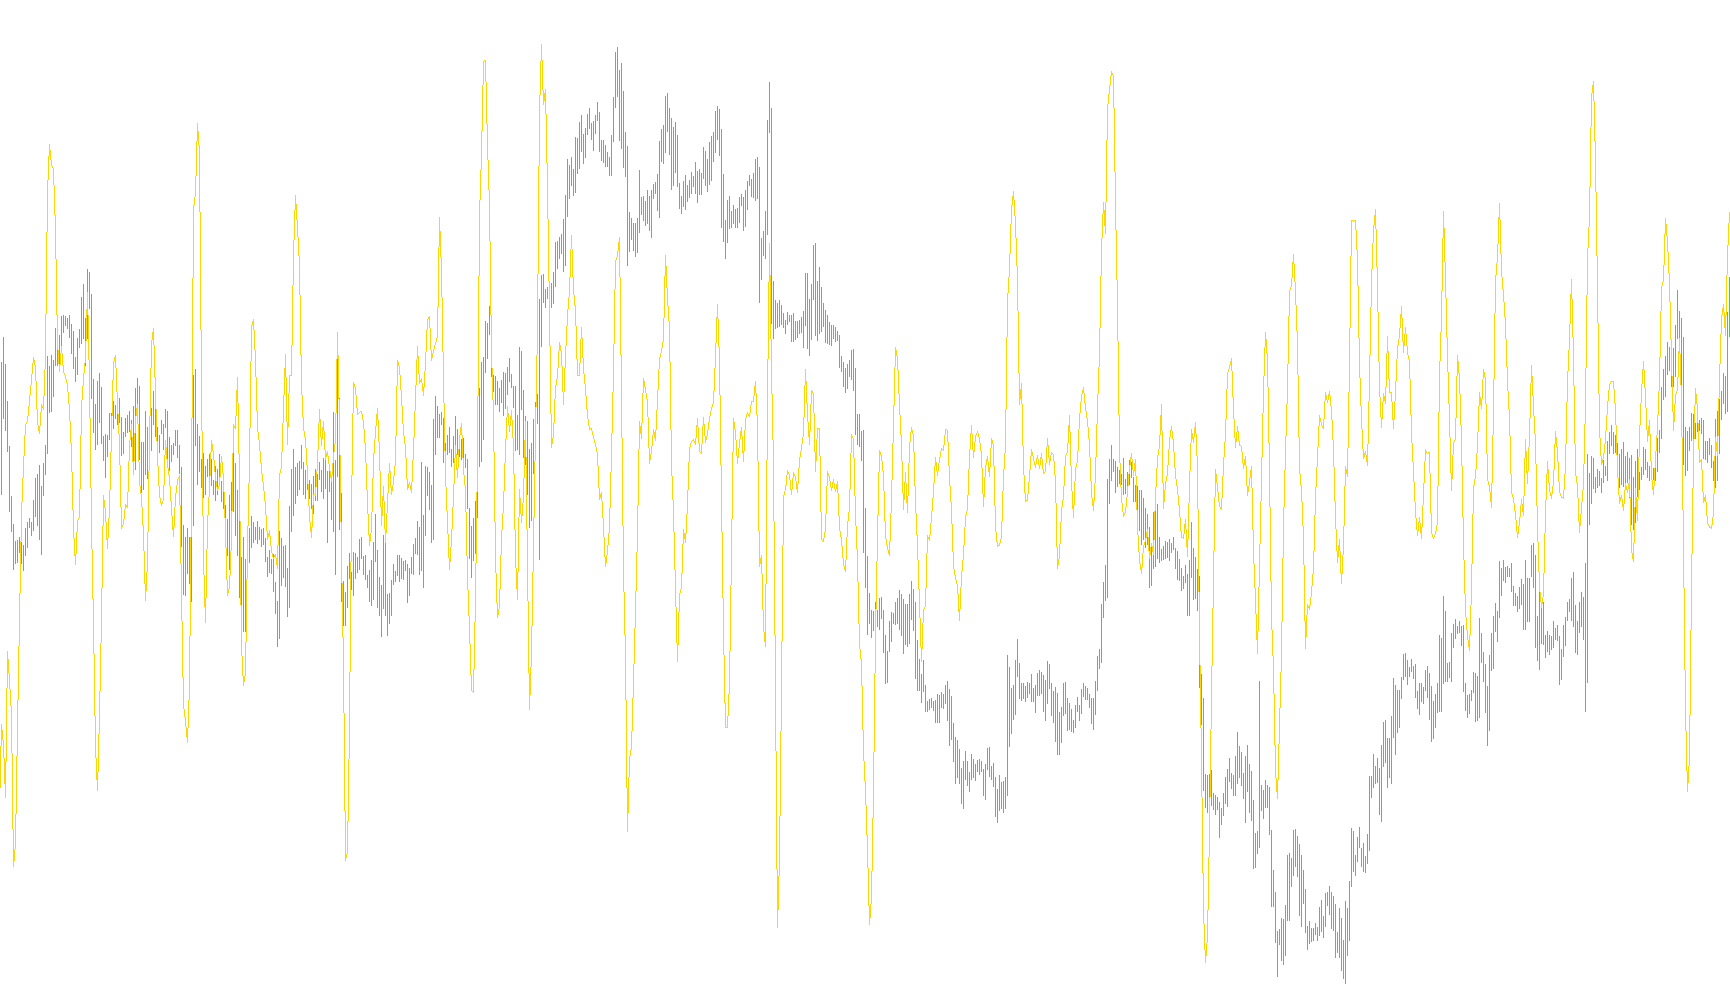
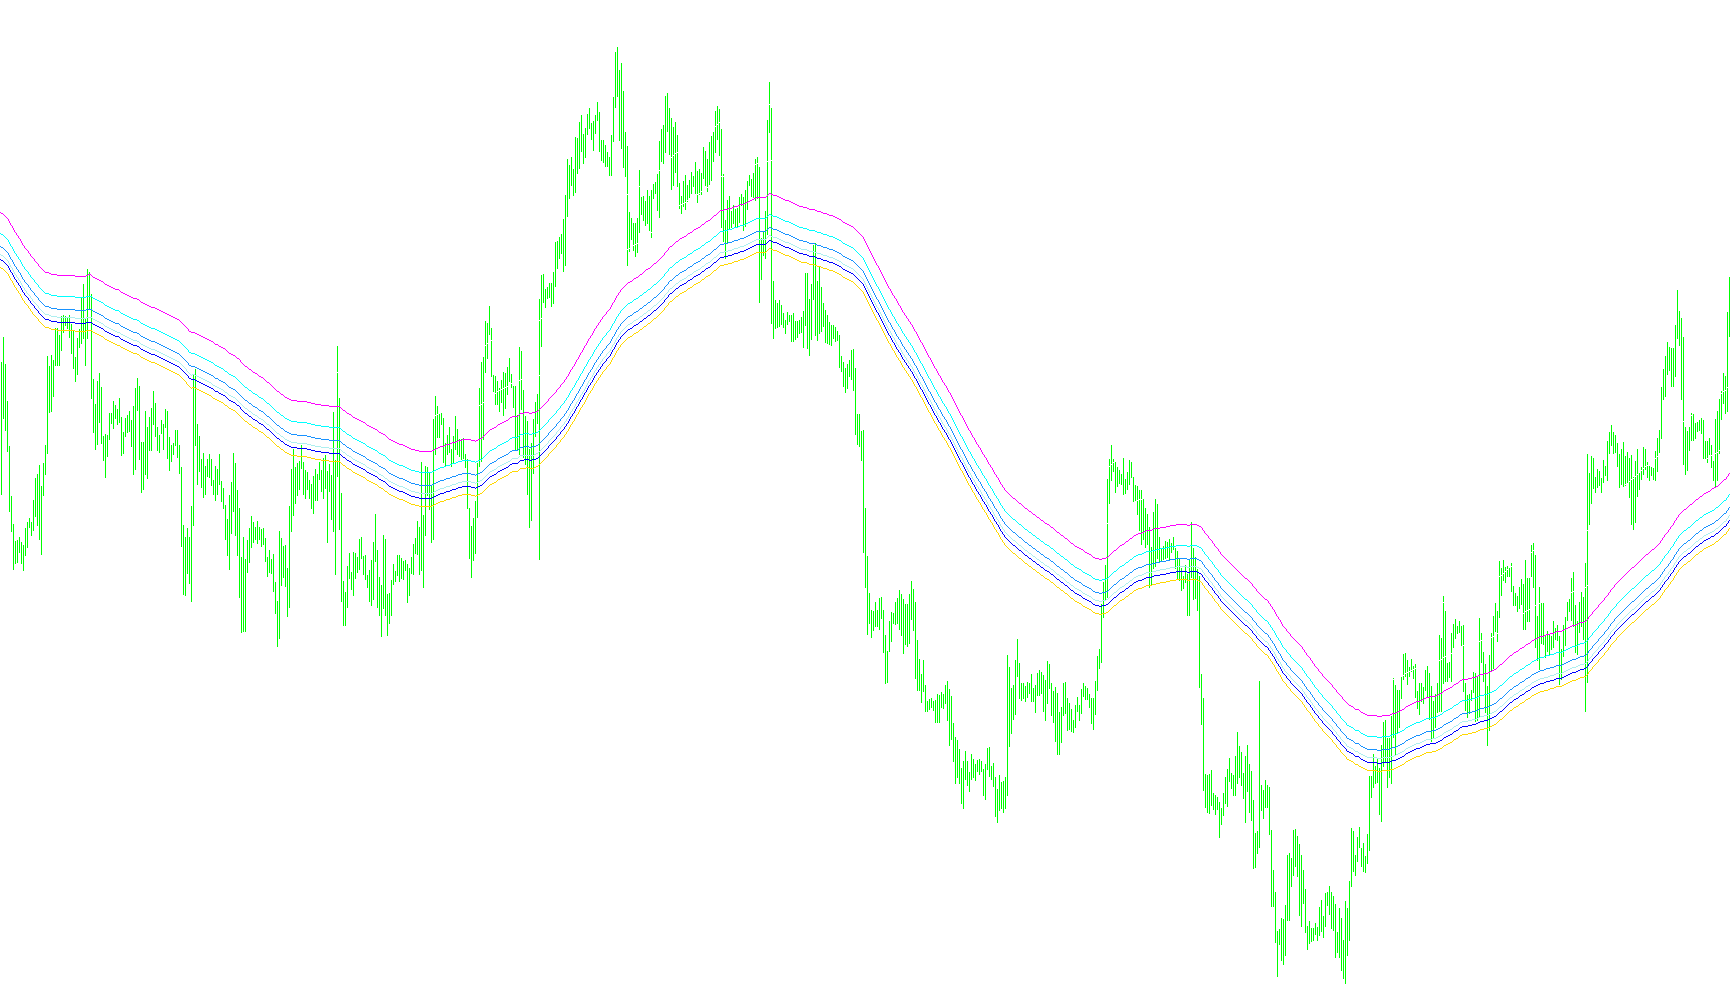
This indicator quantifies the spread between two moving averages to identify momentum divergence, its directional slope, and acceleration rates.

iFXAnalyser_H4-Open1_v1
Indicator

iFXAnalyser_H4-Open1_v1

iMA

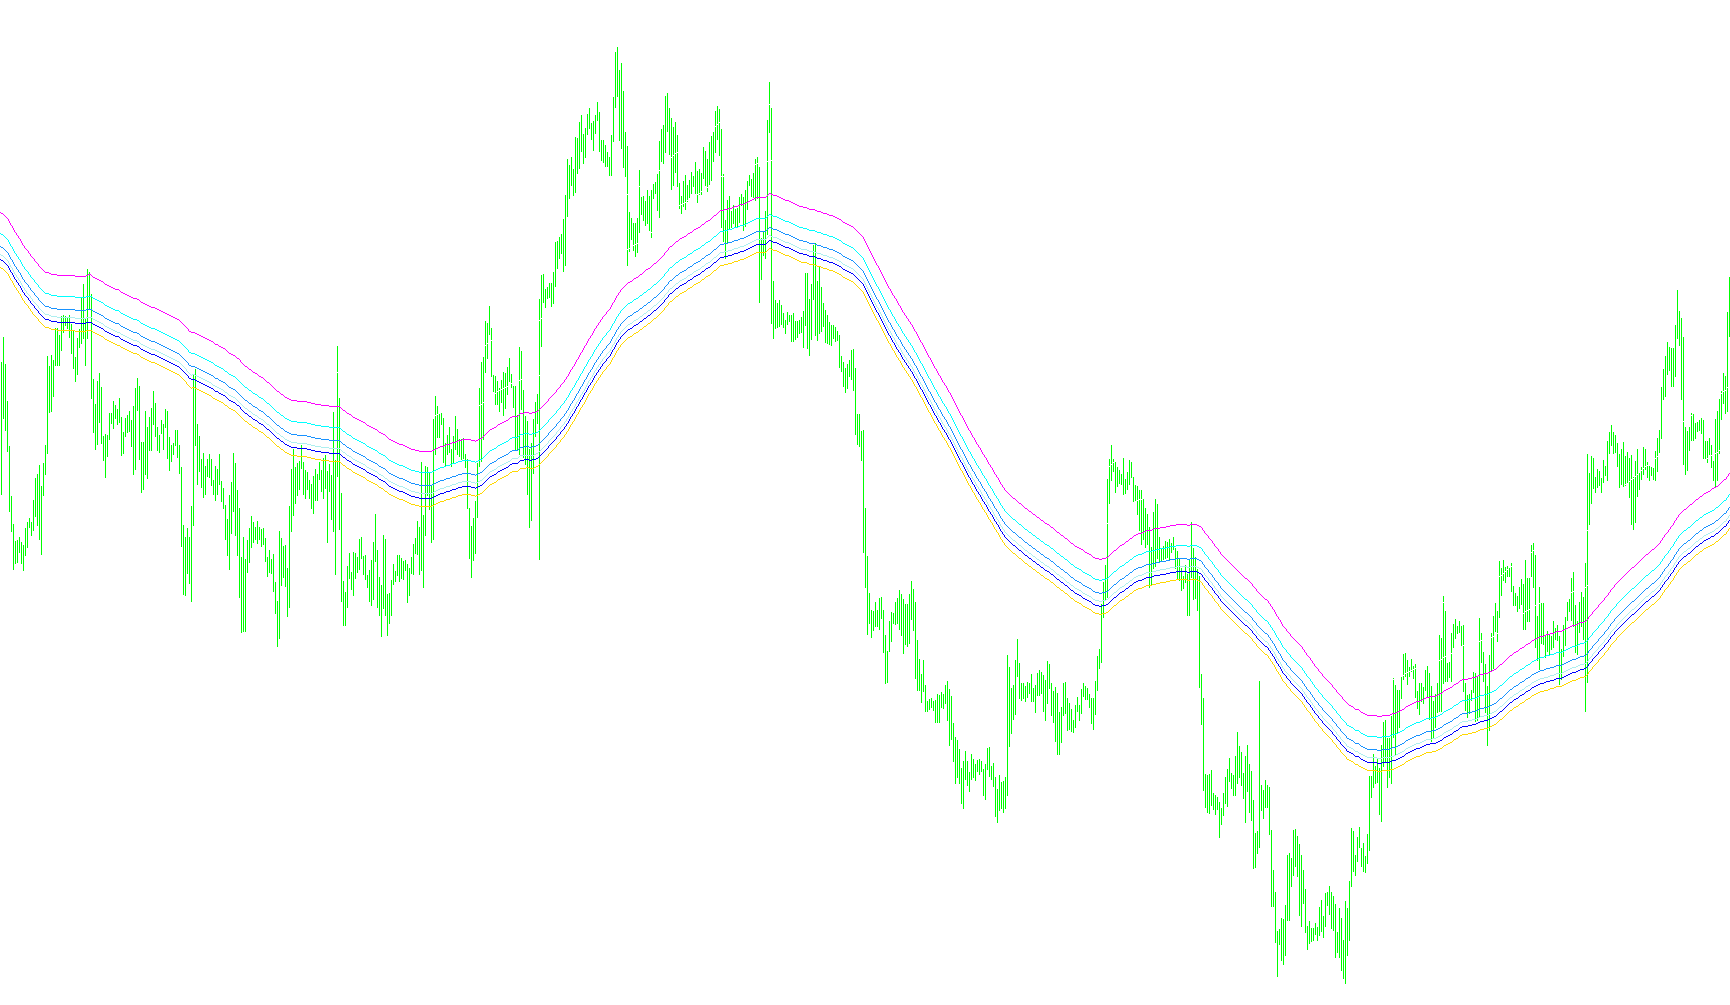
This indicator quantifies the spread between two moving averages and calculates its rate of change to identify price momentum acceleration.

iFXAnalyser_H4-Open_v1
Indicator

iFXAnalyser_H4-Open_v1

iMA

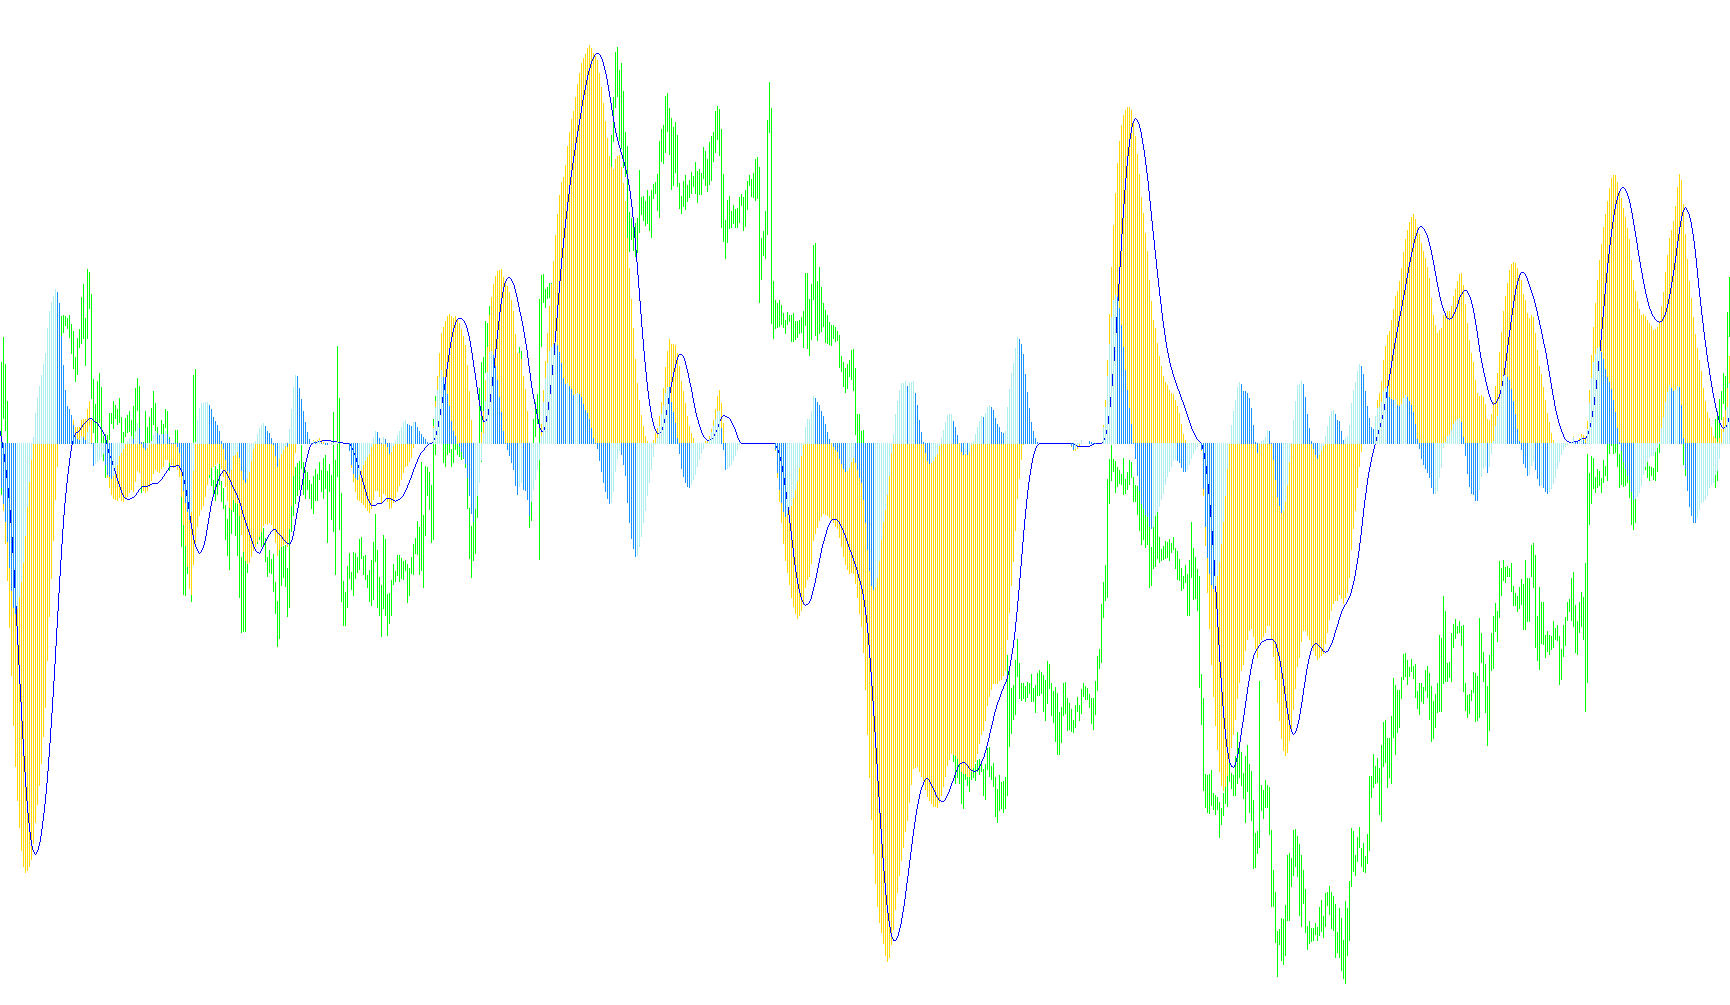
This indicator quantifies market momentum by calculating the variance between two moving averages and deriving its first-order rate of change to detect slope acceleration.

iFXAnalyser_H4
Indicator

iFXAnalyser_H4

iMA

The indicator quantifies market momentum by calculating the instantaneous spread between two fast-moving averages and identifying the subsequent rate of change in that divergence.

iFXAnalyser_H4_Ron_v011
Indicator

iFXAnalyser_H4_Ron_v011

iMA

This indicator calculates the numerical variance between fast and slow moving averages to identify extreme price velocity and momentum shifts via threshold-based signaling.

iFXAnalyser_H4_v1
Indicator

iFXAnalyser_H4_v1

iMA

This indicator quantifies price momentum by calculating the spread between two moving averages and deriving their rate of change to identify acceleration trends.

iFXAnalyser_v1
Indicator

iFXAnalyser_v1

iMA

This indicator calculates and visualizes the progressive derivatives of moving average differences to identify divergence, price slope, and acceleration velocity.

iFXAnalyser_v2
Indicator

iFXAnalyser_v2

iMA

This indicator quantifies market dynamics by calculating the differential, first derivative (slope), and second derivative (acceleration) between two moving averages to reveal underlying price velocity.

IINWMARROWS alert
Indicator

IINWMARROWS alert

iMA

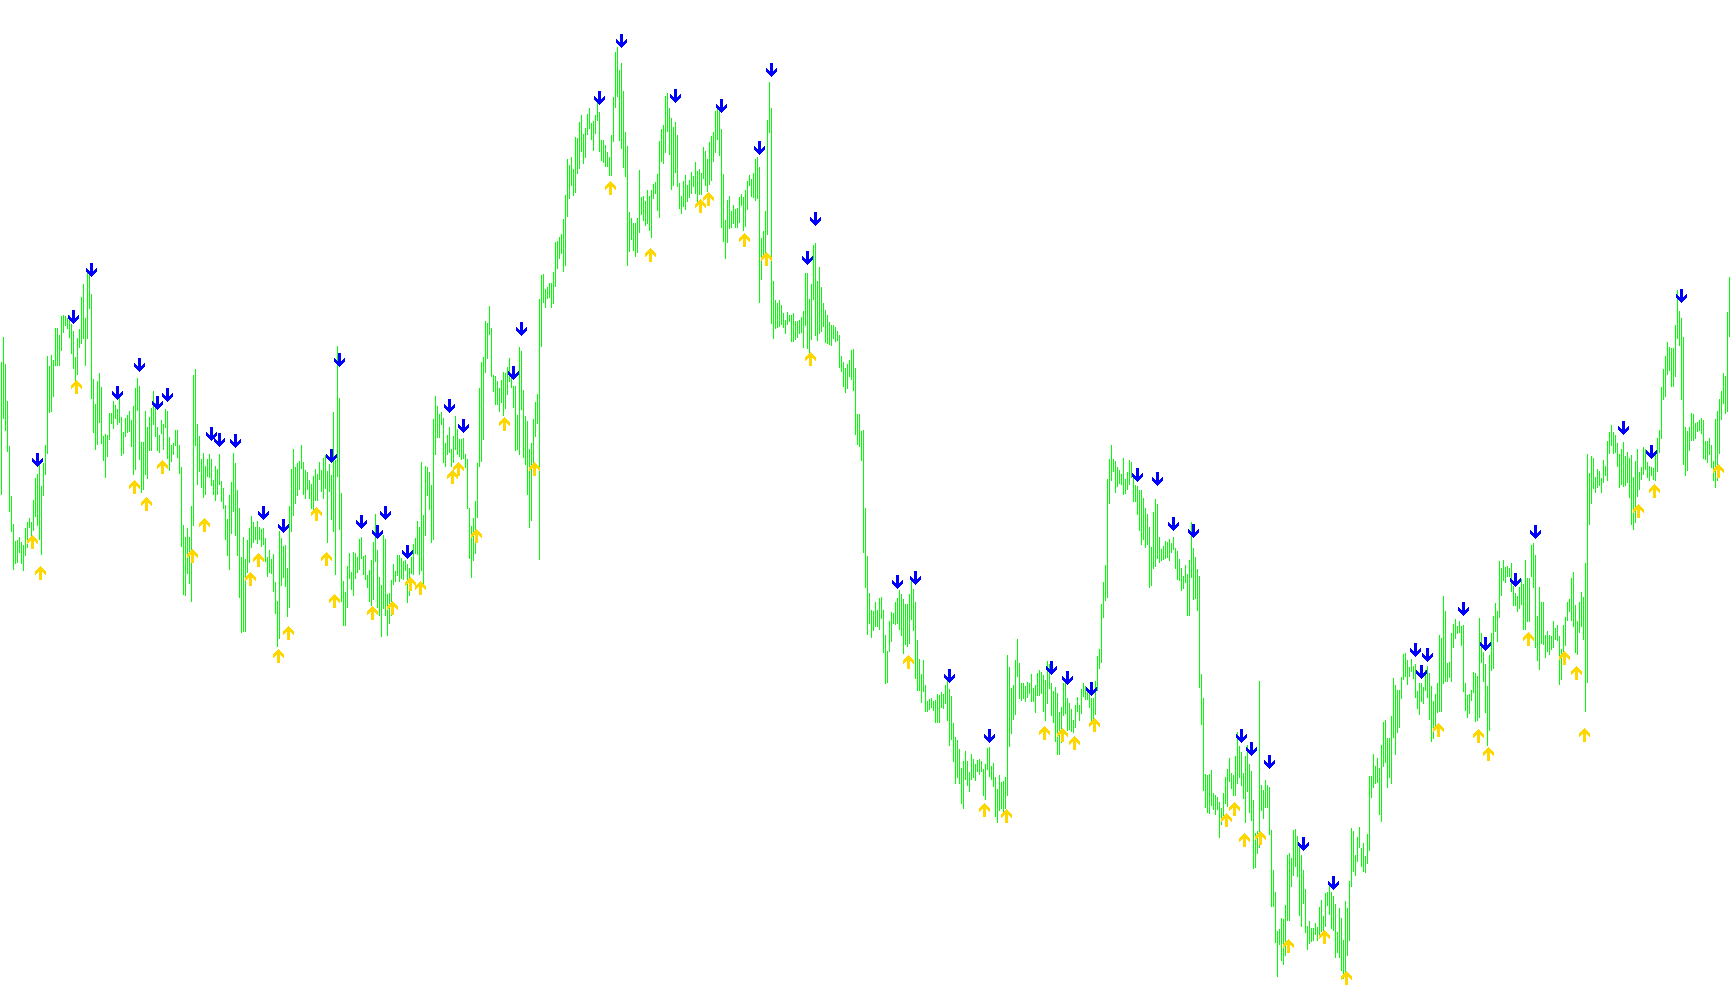
This indicator identifies high-probability trend reversals by detecting precise intersection points between two moving averages of different calculation modes and price sources.

IINWMARROWS
Indicator

IINWMARROWS

iMA

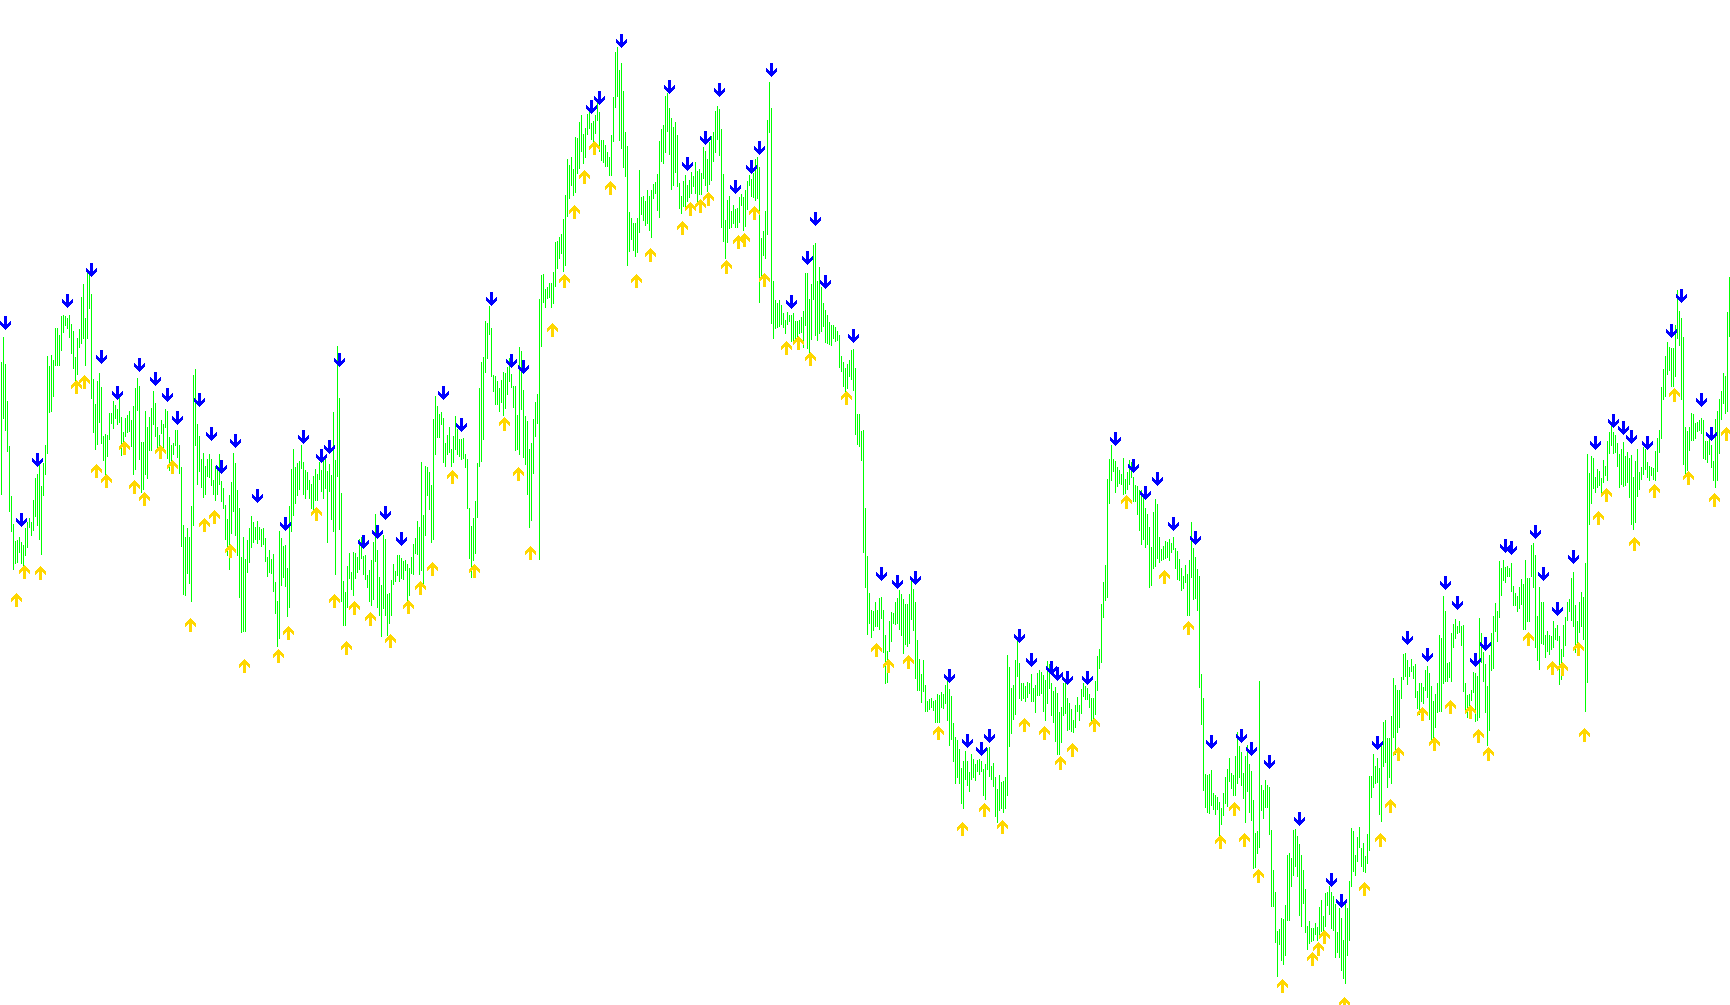
This indicator identifies trend reversals by detecting precise geometric crossovers between two distinct moving average velocities while normalizing signals against local volatility ranges.

IINWMARROWS_002
Indicator

IINWMARROWS_002

iMA

This indicator identifies trend shifts by detecting precise crossovers between two configurable moving averages of varying smoothing types, plotted as dynamic range-based signals.

IINWMARROWS_003
Indicator

IINWMARROWS_003

iMA

Identifies momentum shifts by detecting precise crossover points between high-frequency and low-frequency moving averages using configurable smoothing methods.

IINWMARROWS_004
Indicator

IINWMARROWS_004

iMA

Identifies trend shifts by detecting specific price crossovers between two customizable moving average types using a normalized volatility buffer for visual offset.
ima
Indicator

ima

iMA

This indicator calculates and plots a continuous moving average line to identify core price momentum and trend direction based on user-defined period and smoothing methods.

iMACD
Indicator

iMACD

iMA

This indicator calculates the differential between two Exponential Moving Averages to derive a momentum line, subsequently smoothing it into a signal line to highlight price velocity shifts.

iMACross
Indicator

iMACross

iMA

This indicator calculates the real-time variance between a fast and slow moving average, applying an exponential smoothing filter to derive a signal line for momentum identification.

iMACross_v1
Indicator

iMACross_v1

iMA

This indicator calculates the absolute variance between two distinct moving averages and smooths the resulting differential into a signal stream to identify momentum shifts.

iMACross_v2
Indicator

iMACross_v2

iMA

This indicator calculates the arithmetic difference between two moving averages of varying types and periods, scaled by a factor of ten thousand to visualize momentum shifts.

iMA_Fibs_Above
Indicator

iMA_Fibs_Above

iMA

This indicator projects multiple Fibonacci-scaled price levels relative to a customizable moving average baseline, including support for Linear Regression Smoothing.

iMA_Fibs_Above_v1
Indicator

iMA_Fibs_Above_v1

iMA

This indicator projects multiple price levels based on specific Fibonacci percentage offsets derived from various Moving Average types including LSMA, EMA, and SMMA.

iMA_Fibs_Above_v2
Indicator

iMA_Fibs_Above_v2

iMA

This indicator projects a series of dynamic price levels derived from specific Fibonacci offsets relative to various moving average types, including Linear Regression.

iMA_Fibs_Below
Indicator

iMA_Fibs_Below

iMA

This indicator projects multiple dynamic price levels by subtracting specific Fibonacci-weighted point offsets from a user-selectable moving average base.

iMA_Fibs_Below_v1
Indicator

iMA_Fibs_Below_v1

iMA

This indicator projects a series of dynamic support and resistance levels based on specific Fibonacci percentages derived from various moving average types including EMA, SMMA, LWMA, and LSMA.

iMA_TrueFibs_Above
Indicator

iMA_TrueFibs_Above

iMA

This indicator calculates a selectable moving average and projects multiple horizontal price levels based on Fibonacci sequence offsets from that mean value.

iMA_TrueFibs_Above_v1
Indicator

iMA_TrueFibs_Above_v1

iMA

This indicator projects a series of multi-level price boundaries at fixed intervals above a selected moving average type.

iMA_TrueFibs_Below
Indicator

iMA_TrueFibs_Below

iMA

This indicator calculates a primary moving average and generates seven distinct parallel price levels shifted downward based on specific Fibonacci sequence integers.

iMA_TrueFibs_Below_v1
Indicator

iMA_TrueFibs_Below_v1

iMA

This indicator generates a primary moving average line along with seven dynamic offset levels based on specific Fibonacci sequences to identify potential support and resistance zones.

impuls
Indicator

impuls

iMACDiMA

This indicator synchronizes the rate of change from Exponential Moving Averages and MACD momentum to visualize bullish, bearish, and neutral market impulses.

Impulse CDC
Indicator

Impulse CDC

iMAiMAOnArray

The algorithm identifies bullish and bearish momentum by calculating the spread between weighted moving averages and smoothed high/low extremes, visualized through dynamic convergence-divergence histogram shifts.

Impulse MACD
Indicator

Impulse MACD

iMAiMAOnArray

This indicator calculates the variance between a linearly weighted moving average and its corresponding smoothed high/low extremes to isolate momentum shifts.

ImpulseOsMA
Indicator

ImpulseOsMA

iMAiMAOnArray

This indicator identifies directional momentum by calculating the spread between nested exponential moving averages and filtering trends through a secondary moving average confirmation layer.

impulsmodify
Indicator

impulsmodify

iMACDiMA

This indicator synchronizes the velocity of Exponential Moving Averages and MACD main lines to visualize multi-layered trend momentum through a three-color histogram.

Ind-GG01-101
Indicator

Ind-GG01-101

iBandsiMAiSAR

This indicator identifies high-probability entry points by synchronizing Parabolic SAR trend reversals with smoothed moving average crossovers and expanding Bollinger Band volatility expansion.

Ind-GG01
Indicator

Ind-GG01

iBandsiMAiSAR

Identifies high-momentum entries by correlating smoothed moving average crossovers, parabolic SAR price action, and expanding Bollinger Band volatility thresholds.

Ind-GG01M
Indicator

Ind-GG01M

iBandsiMAiSARiStdDev

Identifies trend reversals by synchronizing smoothed moving average crossovers with Parabolic SAR filters and expanding Bollinger Band volatility thresholds.

Ind-GG01M1
Indicator

Ind-GG01M1

iBandsiMAiSARiStdDev

This indicator identifies trend reversal points by synthesizing smoothed moving average crossovers, Parabolic SAR positioning, and expanding Bollinger Band width to filter for high-momentum volatility.

Ind-GG01M_sw
Indicator

Ind-GG01M_sw

iBandsiMAiSARiStdDev

This indicator identifies high-probability reversal points by synchronizing Parabolic SAR trend breaks with expanding Bollinger Band dynamics and smoothed moving average deviations.

Ind-TRWscalper
Indicator

Ind-TRWscalper

iMA

Identifies directional trend shifts by detecting sequential SMA price movements that exceed a predefined volatility threshold.

ind2
Indicator

ind2

iMA

This indicator identifies trend reversals by detecting price crossovers between the moving average of highs and lows, plotting directional arrows based on consecutive momentum shifts.

Index_pair_Dev_v1
Indicator

Index_pair_Dev_v1

iMAOnArrayiMAiRSIOnArrayiStdDev

This indicator calculates synthetic currency strength indices using geometric means of standard deviations and moving averages across multiple forex pairs, subsequently applying a smoothed RSI filter to identify momentum.

Index_pair_v22
Indicator

Index_pair_v22

iMAOnArrayiMAiRSIOnArray

This indicator synthesizes multi-pair exchange rate data into synthetic currency indices, applying an RSI filter with EMA smoothing to identify momentum trends across major fiat markets.

Index_pair_v22b
Indicator

Index_pair_v22b

iMAOnArrayiMAiRSIOnArray

This indicator calculates a synthetic currency strength index by aggregating cross-pair price data into weighted geometric means, processed through a double-layered RSI and EMA smoothing filter.

Index_pair_v22b_diff
Indicator

Index_pair_v22b_diff

iMAOnArrayiMAiRSIOnArray

This indicator calculates the relative strength between currency components by synthesizing cross-rate indices into a smoothed RSI difference signal to identify divergent momentum across major pairs.

Index_pair_v23b
Indicator

Index_pair_v23b

iMAOnArrayiMAiRSIOnArray

This indicator synthesizes cross-currency price data into unique currency indices to calculate smoothed Relative Strength Index and ADX values for identifying momentum shifts across major forex pairs.

indicatorarrows
Indicator

indicatorarrows

iMACDiOsMAiMAiStochastic
indicatorcandles
Indicator

indicatorcandles

iCCIiMAiRSI

This indicator projects synthetic price candles onto a separate window based on real-time calculations from PRI, RSI, CCI, or standard price data to visualize momentum and trend strength.

Indicator_Strength
Indicator

Indicator_Strength

iMACDiMAiStochastic

This indicator quantifies price velocity by calculating and visualizing the variance between primary moving average, MACD, or Stochastic components in a dual-polarized histogram.

IndiTest
Indicator

IndiTest

iMA

This expert utilizes a self-evolving artificial neural network architecture to analyze multi-period moving average momentum, performing real-time synaptic weight adjustment and neuron pruning to identify overbought and oversold market states.

Indicator

ind_aMU

iMA