HMA_Color_v02_v1
Indicator

HMA_Color_v02_v1

iMAiMAOnArray

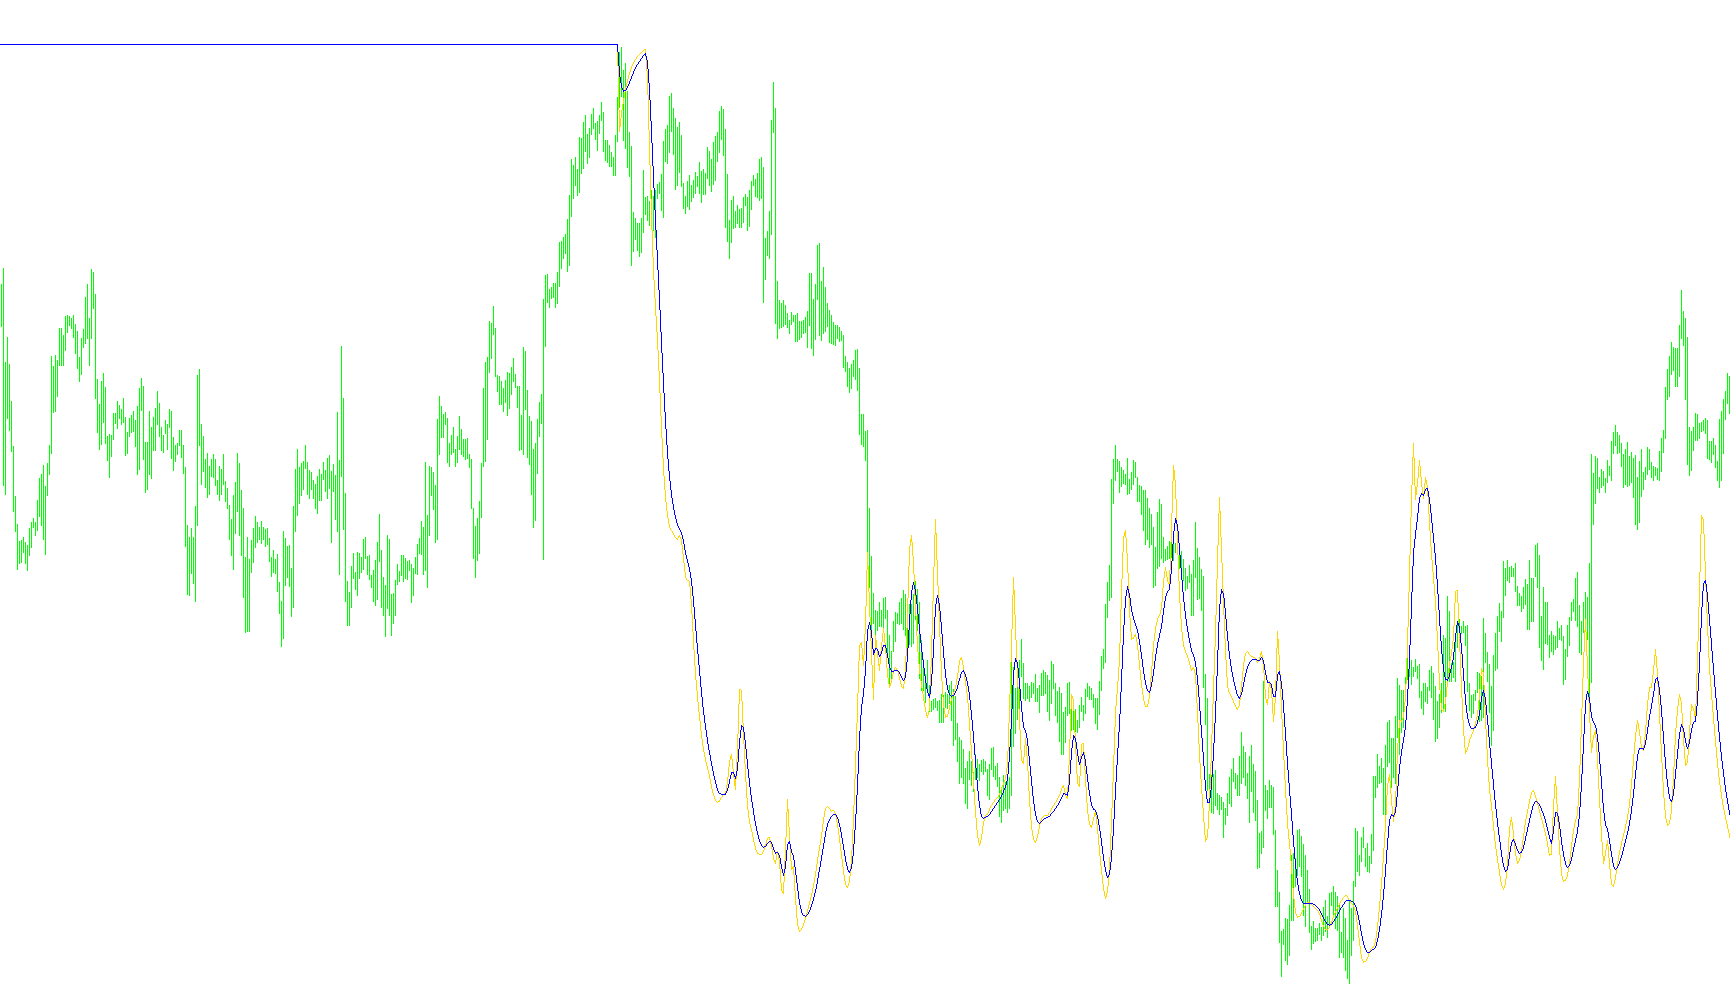
This indicator utilizes a weighted moving average of the difference between dual-period averages to identify trend momentum and execute color-coded directional shifts.

HMA_Color_v03
Indicator

HMA_Color_v03

iMAiMAOnArray

This indicator calculates a high-speed moving average by applying a weighted difference between dual-period averages and smoothing the result with a square-root volatility constant to identify trend reversals.

HMA_Color_v03_v1
Indicator

HMA_Color_v03_v1

iMAiMAOnArray

This indicator calculates a Hull Moving Average by weighting the difference between two weighted averages and applies a final smoothing layer to identify momentum shifts.

HMA_Color_v1
Indicator

HMA_Color_v1

iMAiMAOnArray

This indicator calculates a high-speed weighted moving average by applying a secondary linear weight to the difference between two primary smoothed price averages.

HMA_Color_v3
Indicator

HMA_Color_v3

iMAiMAOnArray

This indicator calculates a smoothed weighted moving average by processing the difference between two linear weighted averages to identify price trends with reduced lag.

Indicator

HMA_Histogram

iMAiMAOnArray
Indicator

HMA_Modified_sigalert

iATRiMAiMAOnArray
Indicator

HMA_Modified_sigalert_001

iATRiMAiMAOnArray
HMA_Momentum_Test1
Indicator

HMA_Momentum_Test1

iMomentumOnArrayiMA

This indicator calculates market velocity by applying a momentum calculation to a Hull Moving Average variance, identifying directional shifts through trend-reversal tracking.

HMA_No_Solid
Indicator

HMA_No_Solid

iMAiMAOnArray

This indicator computes a high-speed smoothed trend line by applying a weighted linear moving average to the difference between two scaled linear weighted averages.

HMA_No_Solid_v1
Indicator

HMA_No_Solid_v1

iMAiMAOnArray

This indicator calculates a responsive moving average by applying a weighted linear transformation to the price differences of nested averages to minimize lag while maintaining high sensitivity.

HMA_RSI_Test1
Indicator

HMA_RSI_Test1

iMAiRSIOnArray

This indicator calculates the Relative Strength Index based on a smoothed Hull Moving Average to identify directional trend shifts and momentum fluctuations.

HMA_Russian
Indicator

HMA_Russian

iMAiMAOnArray

This indicator calculates a weighted average by applying a second-order moving average to the difference between two weighted means, significantly reducing lag while maintaining price proximity.

HMA_Russian_Color
Indicator

HMA_Russian_Color

iMAiMAOnArray

This indicator calculates a weighted moving average of the difference between two sub-periods to identify trend directionality and momentum transitions.

HMA_Russian_Color_001
Indicator

HMA_Russian_Color_001

iMAiMAOnArray

This indicator calculates a smoothed moving average by applying a weighted volatility adjustment to the price series to identify trend direction and momentum.

HMA_Russian_Color_02_mod
Indicator

HMA_Russian_Color_02_mod

iMAiMAOnArray

This indicator identifies momentum shifts by calculating a secondary moving average over a weighted velocity vector to smooth volatility and highlight directional trend reversals.

HMA_Russian_Color_sep
Indicator

HMA_Russian_Color_sep

iMAiMAOnArray

This indicator calculates a smoothed volatility-adjusted moving average using a weighted double-summation formula to identify and plot discrete directional trend shifts.

HMA_Russian_Color_sep_v1
Indicator

HMA_Russian_Color_sep_v1

iMAiMAOnArray

This indicator calculates a smoothed trend line by applying a weighted moving average to the difference between two primary moving averages, effectively minimizing lag while identifying directional shifts.

HMA_Russian_Color_sep_v2
Indicator

HMA_Russian_Color_sep_v2

iMAiMAOnArray

The logic calculates a specialized moving average by processing the difference between dual weighted averages to identify and plot distinct bullish and bearish directional shifts.

HMA_Russian_Color_v1
Indicator

HMA_Russian_Color_v1

iMAiMAOnArray

This indicator calculates a smoothed moving average by applying a weighted secondary calculation to reduce lag while identifying directional trend shifts through price momentum.

HMA_TwoTone
Indicator

HMA_TwoTone

iMAiMAOnArray

This indicator calculates a weighted volatility-adjusted moving average by applying a secondary smoothing pass to a linear combination of dual-period weighted averages.

HMA_TwoTone_v1
Indicator

HMA_TwoTone_v1

iMAiMAOnArray

This indicator calculates a high-speed moving average by applying a weighted volatility adjustment and square-root period smoothing to minimize lag while maintaining trend sensitivity.

Indicator

HMA_v02

iMAiMAOnArray
Indicator

HMA_v02_v1

iMAiMAOnArray
Indicator

HMA_v03

iMAiMAOnArray
Indicator

HMA_v03_v1

iMAiMAOnArray
HMA_v04
Indicator

HMA_v04

iMAiMAOnArray

This indicator calculates a weighted moving average of the difference between two multi-period smoothed averages to visualize trend direction through color-coded momentum shifts.

HMA_v04_v1
Indicator

HMA_v04_v1

iMAiMAOnArray

This indicator calculates a reduced-lag moving average by weight-averaging dual linear momentum components to identify trend reversals through color-coded directional shifts.

HMA_v05
Indicator

HMA_v05

iMAiMAOnArray

This indicator identifies trend shifts by calculating the derivative of weighted moving averages to detect directional changes in price momentum.

HMA_v05_v1
Indicator

HMA_v05_v1

iMAiMAOnArray

Identifies directional bias by detecting slope changes in a weighted moving average calculation derived from dual-period linear weights.

Indicator

HMA_v06

iMAiMAOnArray
Indicator

HMA_v06_v1

iMAiMAOnArray
HMA_v07.1
Indicator

HMA_v07.1

iMAiMAOnArray

This indicator calculates a weighted moving average of the difference between two half-period and full-period linear weighted averages to minimize lag while identifying trend directional shifts.

HMA_v07
Indicator

HMA_v07

iMAiMAOnArray

This indicator calculates a weighted moving average of price variance to identify trend reversals by bifurcating the hull mean into independent bullish and bearish directional components.

HMA_v07_v1
Indicator

HMA_v07_v1

iMAiMAOnArray

This indicator calculates a weighted moving average hybrid that identifies price momentum shifts by separating upward and downward trends into distinct color-coded streams based on slope velocity.

HMA_v1
Indicator

HMA_v1

iMAiMAOnArray

This indicator calculates a smoothed trend trajectory by applying nested linear weighted averages to capture price momentum with minimal lag.

HMA_v2
Indicator

HMA_v2

iMAiMAOnArray

This indicator calculates a smoothed Hull Moving Average and employs a standard deviation-based percentile filter to identify distinct directional trend shifts while minimizing noise.

Indicator

HMA_V2_v1

iMAiMAOnArray
HMA_v3
Indicator

HMA_v3

iMAiMAOnArray

This indicator calculates a smoothed Hull Moving Average derivative to isolate momentum shifts and visually differentiate bullish trajectories from bearish declines.

HMA_v4
Indicator

HMA_v4

iMAiMAOnArray

This script calculates a weighted linear moving average by processing the difference between two half-period averages to minimize lag while maintaining high price sensitivity.

HMA_v5
Indicator

HMA_v5

iMAiMAOnArray

This indicator calculates a high-velocity trend line by applying a weighted moving average to the variance between two different period linear weighted averages.

HMA_v7
Indicator

HMA_v7

iMAiMAOnArray

This indicator calculates a smoothed directional trajectory by processing a weighted difference of dual moving averages to isolate trend momentum and flip between bullish and bearish states.

HMA_vUnKnown
Indicator

HMA_vUnKnown

iMAiMAOnArray

This algorithm calculates a weighted moving average by applying a linear weighted mean to the difference between two nested LWMA values, then smoothing the result with a square root period lag.

HMA_withAlerts
Indicator

HMA_withAlerts

iMAiMAOnArray

This indicator calculates a weighted moving average by applying a square-root period smoothing to the difference between two weighted averages, dynamically shifting colors and sending alerts based on directional slope changes.

Homodyne Discriminator
Indicator

Homodyne Discriminator

iMA

This indicator, based on J. Ehlers' work, calculates and smooths the dominant cycle period of price data using quadrature components and filtering techniques.

Homodyne Discriminator_001
Indicator

Homodyne Discriminator_001

iMA

This indicator estimates the dominant cycle period of price data using a complex homodyne discriminator algorithm derived from detrended prices and quadrature components.

Hour
Indicator

Hour

iMA

This indicator plots three moving averages with dynamically varying time periods to visualize structural trend shifts across different temporal scales.

hull THV
Indicator

hull THV

iMA

This indicator calculates a weighted moving average of the difference between two median price averages to identify trend velocity and directional shifts based on a specific slope threshold.

Hull Trend
Indicator

Hull Trend

iMAiMAOnArray

This indicator calculates a weighted moving average variance to identify directional momentum and highlights price extremes based on structural shifts.

Hull Trend1
Indicator

Hull Trend1

iMAiMAOnArray

This indicator utilizes the Hull Moving Average formula to calculate price momentum and identifies trend polarity by comparing weighted linear averages against their own square-root offsets.