ind_Test
Indicator

ind_Test

iMA

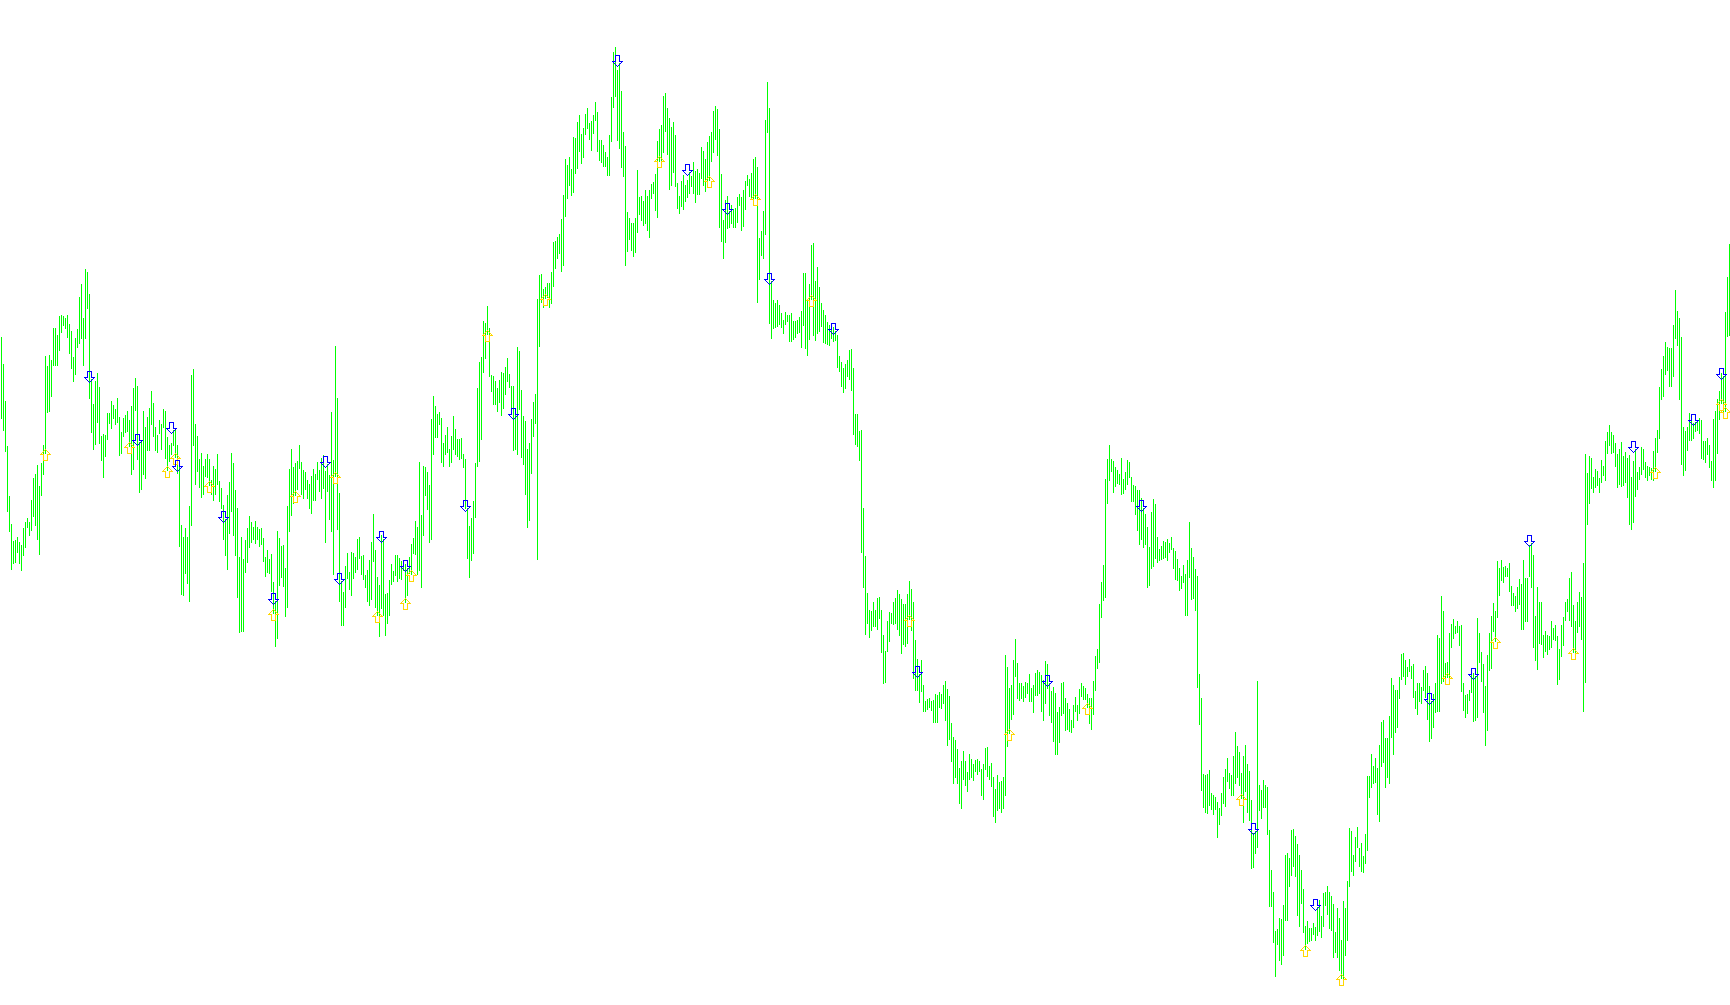
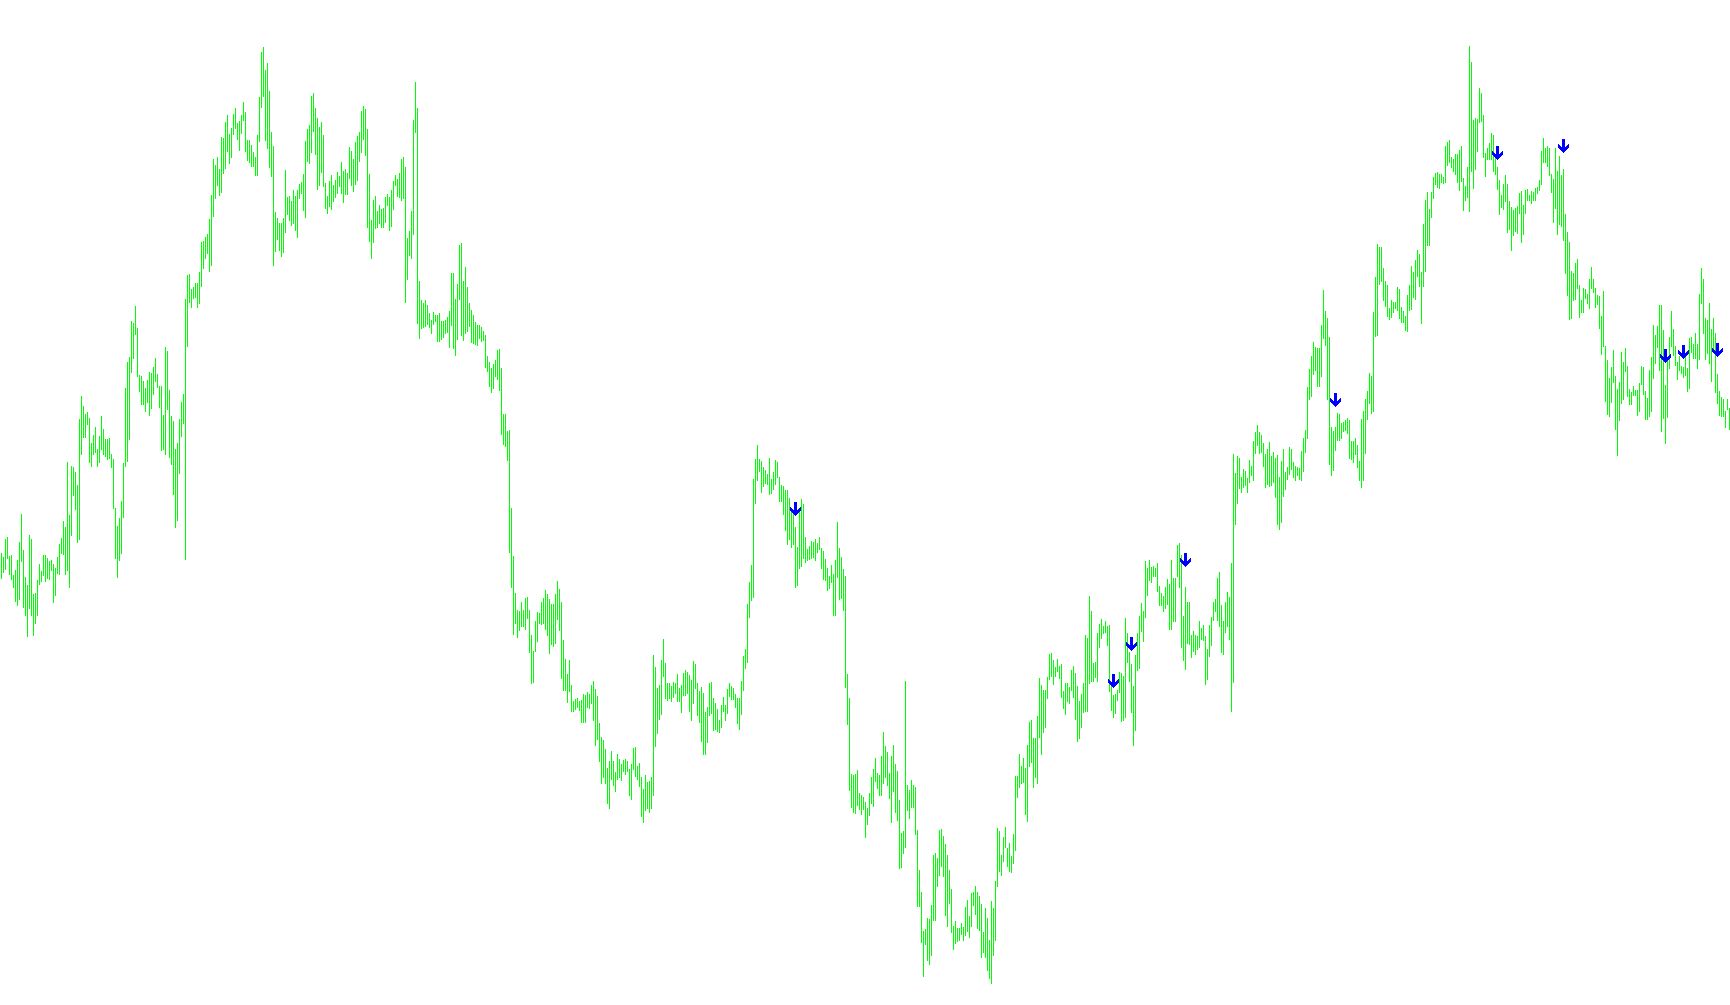
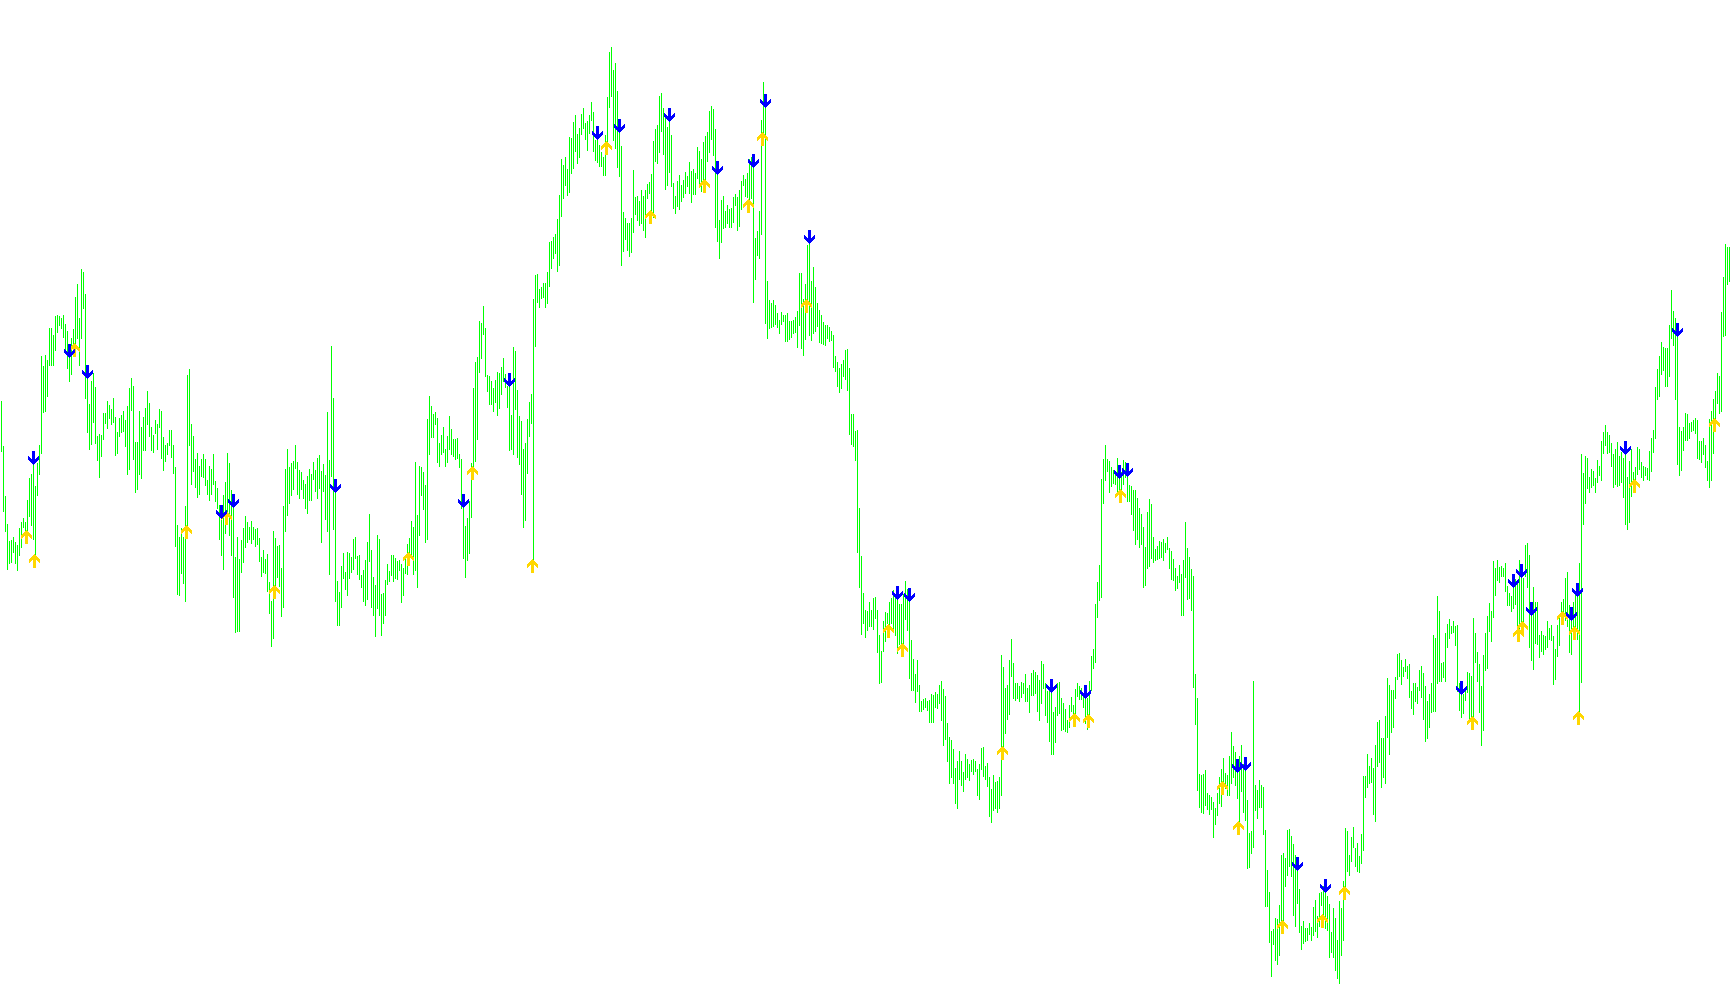
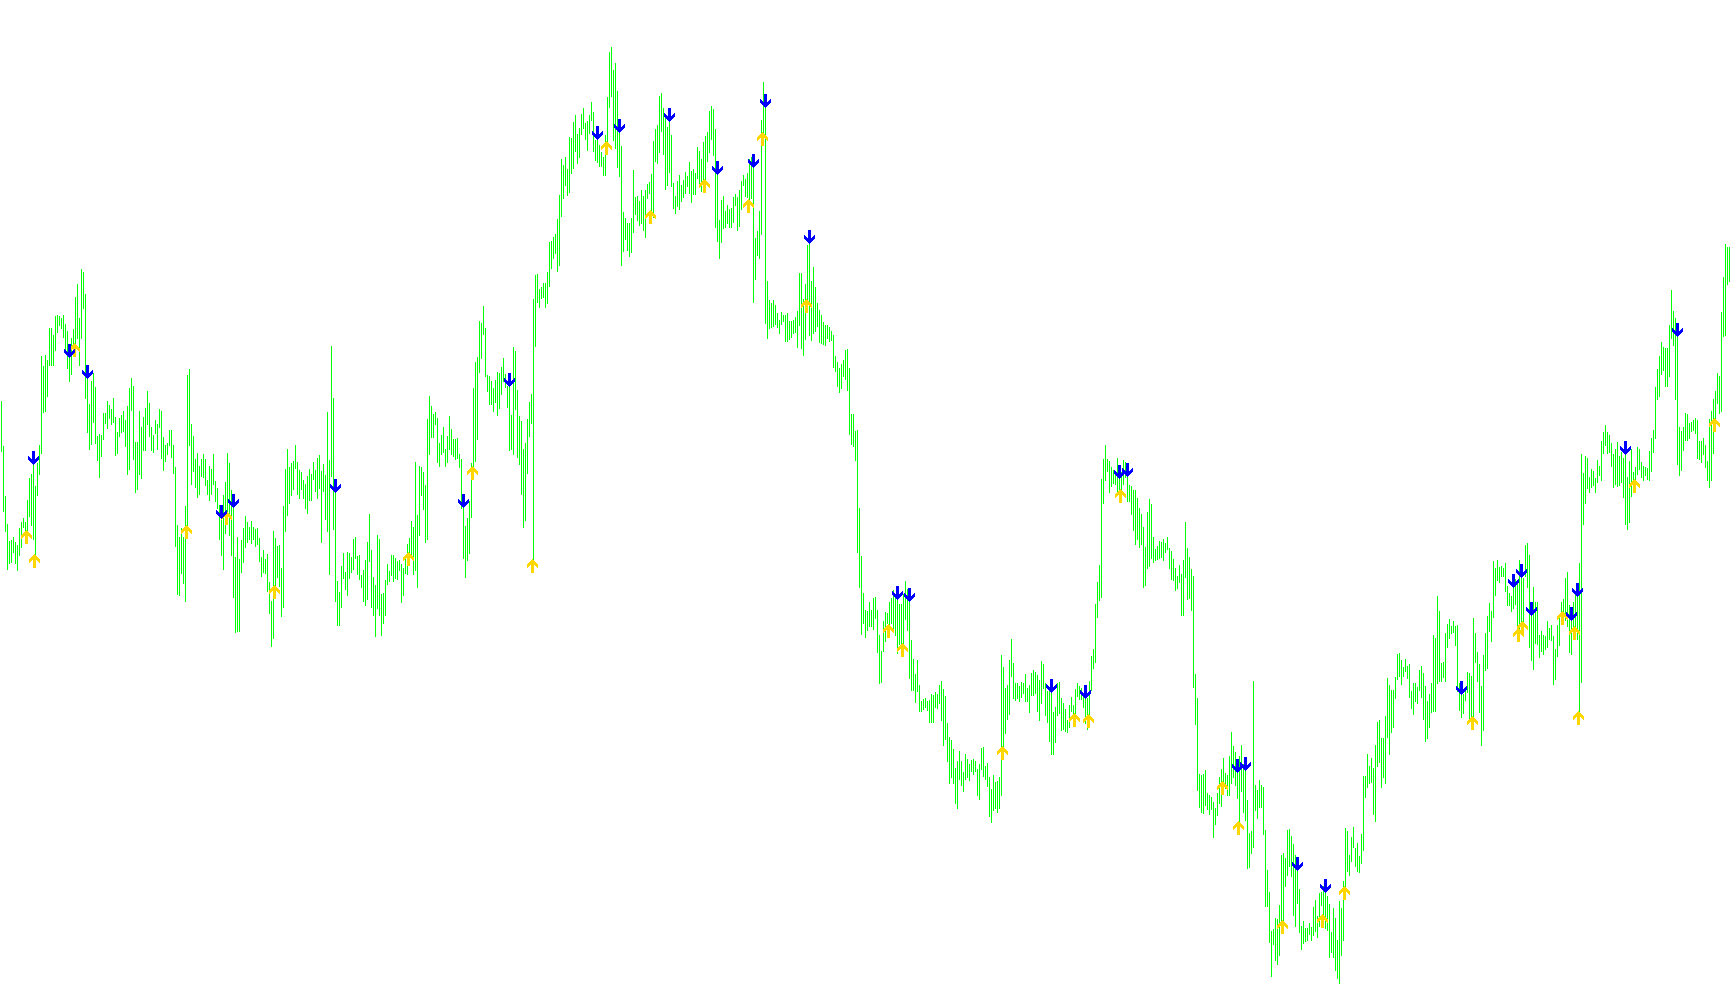
Identifies directional shifts by detecting the precise moment the fast moving average intersects and breaches the slow moving average threshold.

Information
Indicator

Information

iCCIiMACDiRSIiStochastic

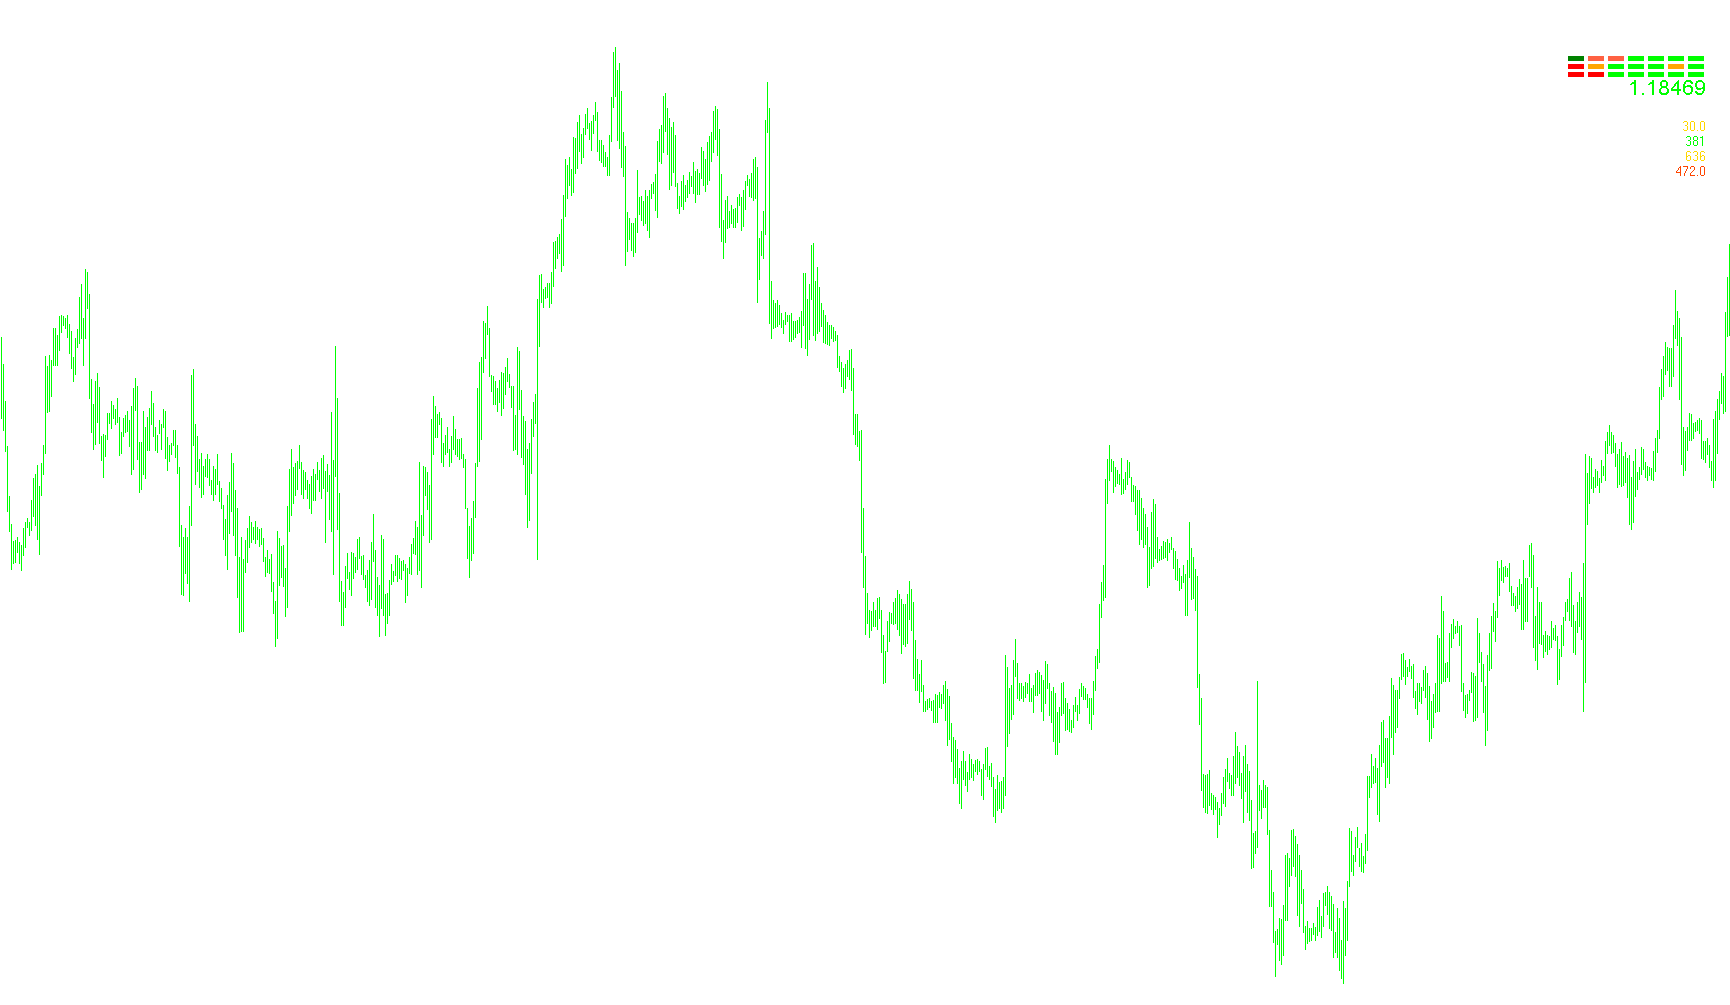
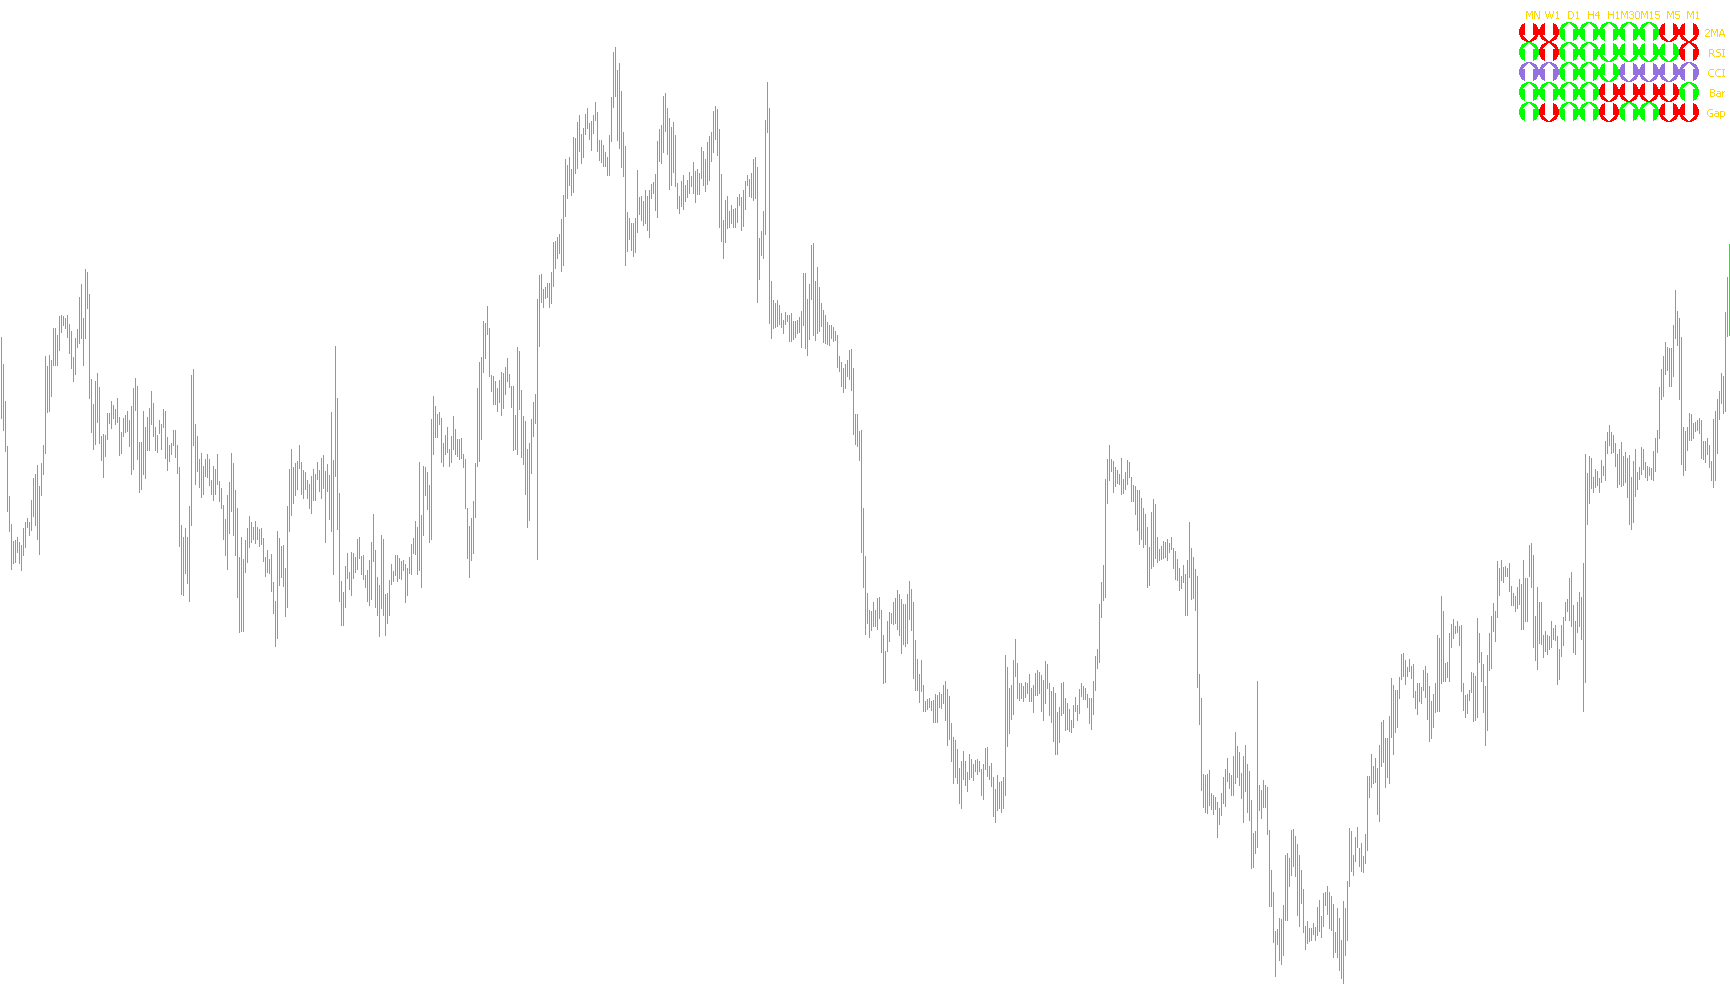
This indicator aggregates synchronized momentum, trend, and volatility data across multiple timeframes into a single visual dashboard to identify high-probability trade bias.

Information_5_deci
Indicator

Information_5_deci

iCCIiMACDiRSIiStochastic

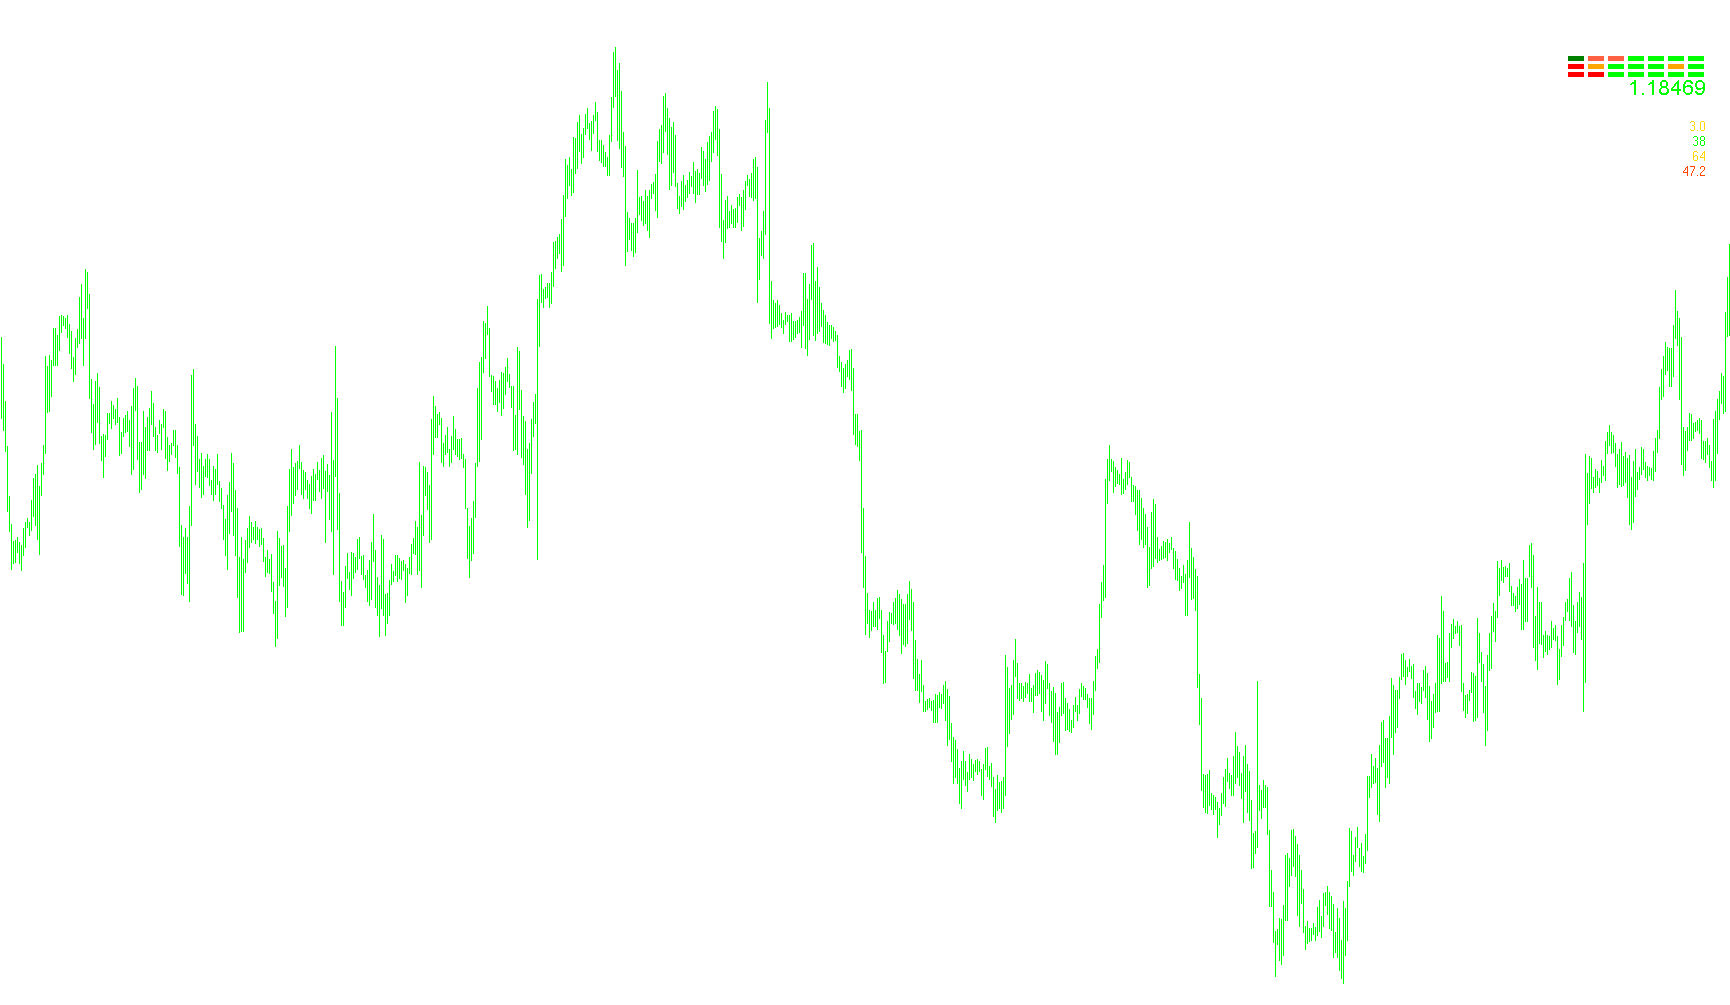
This indicator synchronizes MACD, RSI, Stochastic, CCI, and EMA metrics across multiple timeframes to provide a unified visual heatmap of trend direction and price volatility.

Information_5_deci_MTF
Indicator

Information_5_deci_MTF

iCCIiMACDiRSIiStochastic

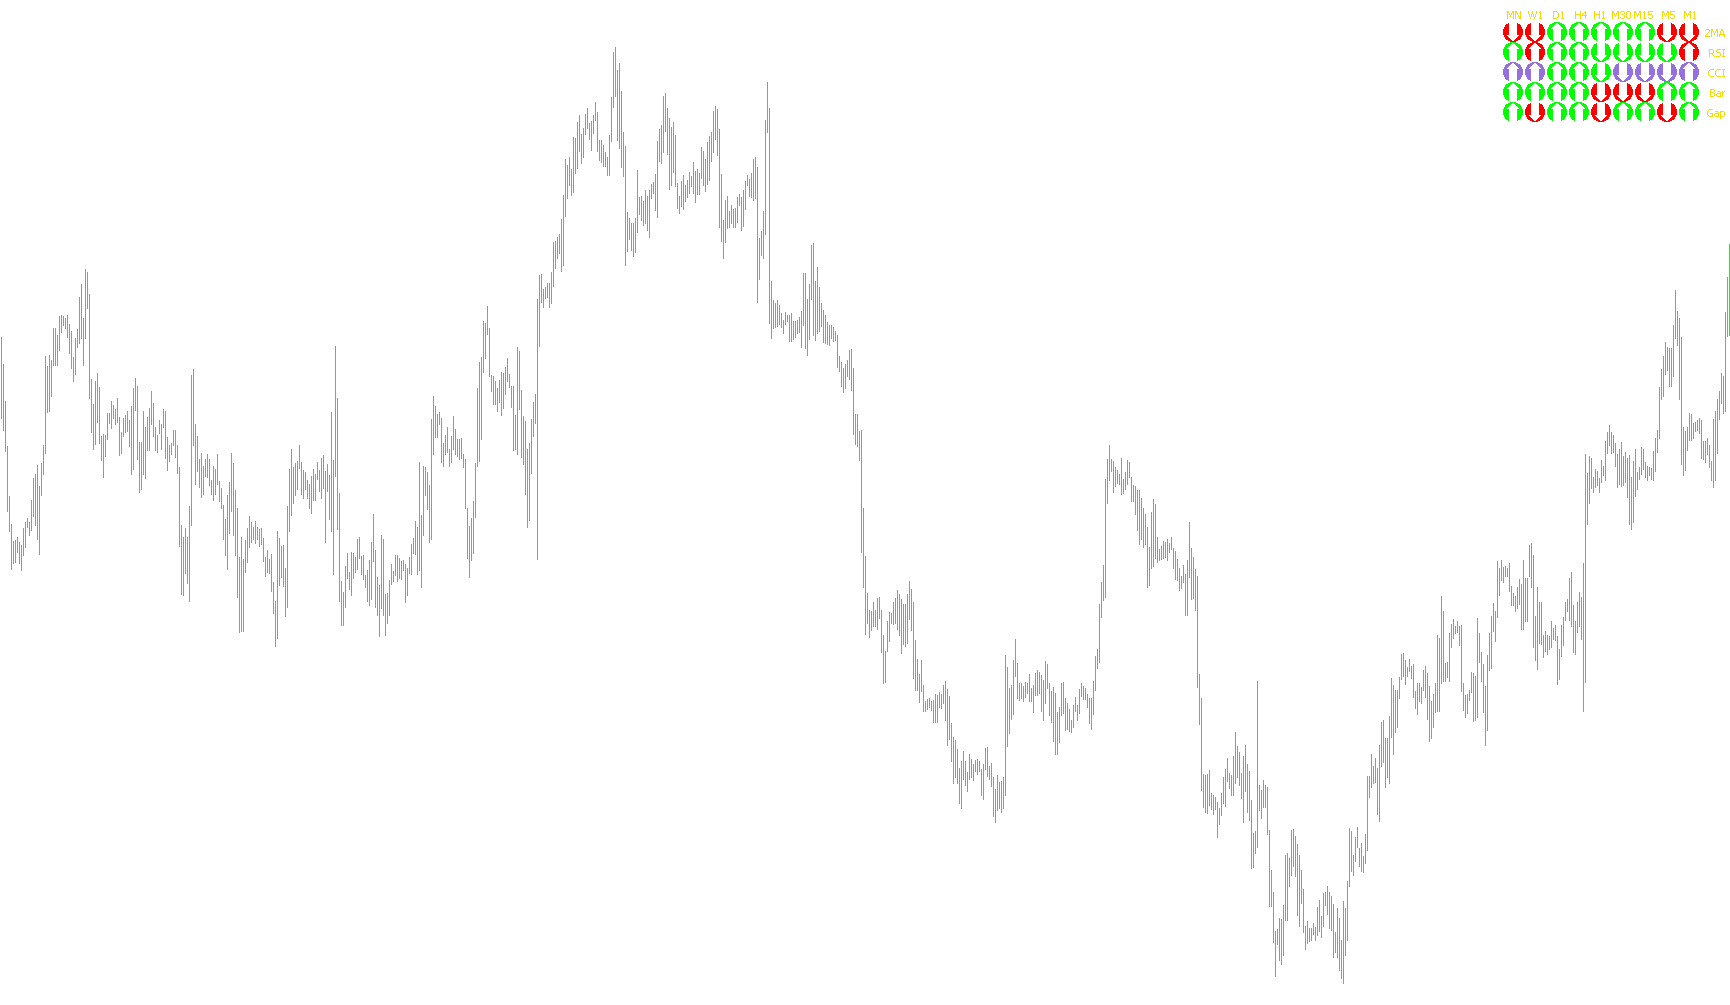
This indicator aggregates real-time MACD, RSI, Stochastic, CCI, and EMA signals across nine distinct timeframes to provide a synchronized visual overview of trend momentum and market volatility.

info_Table_v0Satop_en v1
Indicator

info_Table_v0Satop_en v1

iCCIiMAiRSI

This indicator aggregates real-time trend, momentum, and price action signals across nine different timeframes into a single visual dashboard for synchronized market analysis.

info_Table_v0Satop_en
Indicator

info_Table_v0Satop_en

iCCIiMAiRSI

This indicator renders a comprehensive dashboard visualizing concurrent trend, momentum, and price action signals across nine distinct timeframes simultaneously.

InstTrendLine_v1
Indicator

InstTrendLine_v1

iATRiMA

An advanced trend identification system utilizing a multi-stage signal processing pipeline involving complex smoothing, Hilbert transform-based cycle detection, and notch filters to isolate dominant market movements from noise.

iTREND_alexcud(2)
Indicator

iTREND_alexcud(2)

iACiMA

This indicator identifies trend reversals by synchronizing moving average gradients and Awesome Oscillator momentum shifts across three distinct timeframes.

i_dayma_v1_1
Indicator

i_dayma_v1_1

iMA

This indicator calculates a moving average based on a variable count of elapsed calendar days rather than a fixed number of bars, adjusting automatically to historical timeframes.

J-EM 7-21
Indicator

J-EM 7-21

iMA

This indicator identifies bullish and bearish trend reversals by detecting precise crossover points between a fast and slow Exponential Moving Average while utilizing a 10-period volatility range for dynamic signal placement.

JJN-BigTrend
Indicator

JJN-BigTrend

iMA

This indicator displays trend direction for multiple currency pairs across different timeframes using Moving Averages and High/Low price comparisons, visually indicating uptrends, downtrends, or ranging markets with distinct colors.

JJN-Nugget
Indicator

JJN-Nugget

iMA

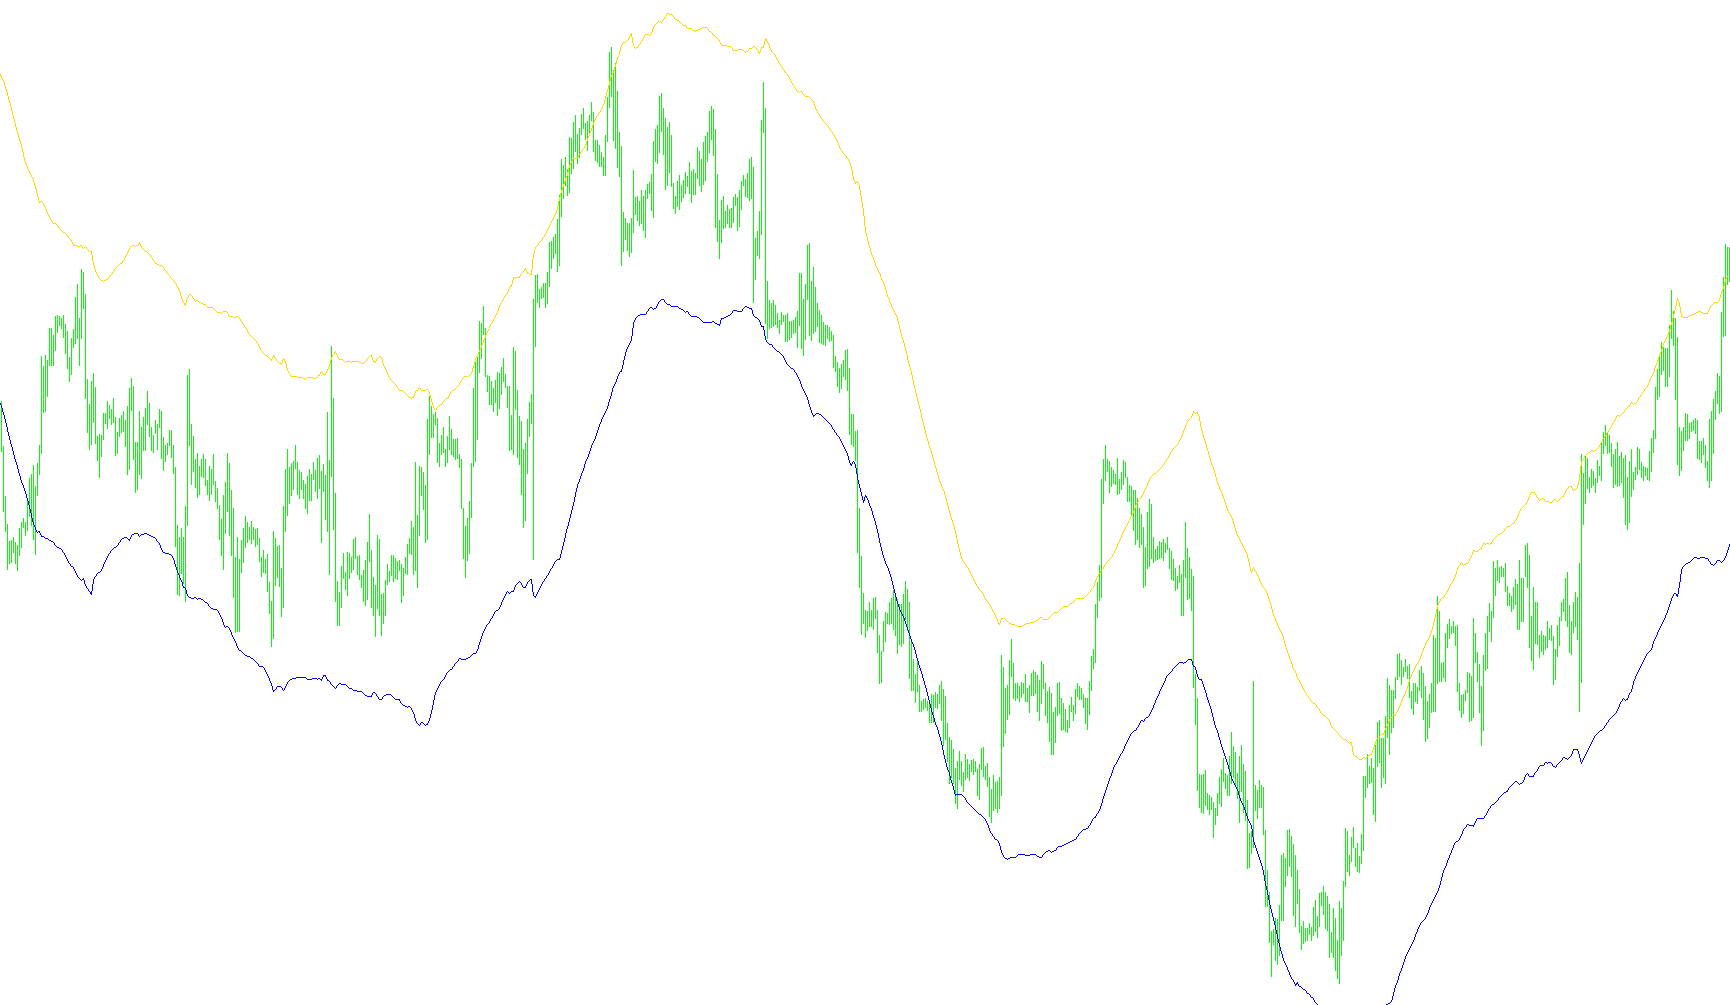
This indicator identifies trend shifts by comparing the arithmetic mean of eight Fibonacci-based Exponential Moving Averages against the current price's mid-range point.
JJN-Promise
Indicator

JJN-Promise

iMAiMAOnArray

This indicator calculates the cumulative deviation of exponential moving averages using a Fibonacci-based shifting sequence to identify momentum divergences and signal volatility.

JR_Trend_Indicator
Indicator

JR_Trend_Indicator

iMA

The indicator quantifies the rate of change between a 5-period SMA and a 21-period EMA to identify directional momentum shifts and trend acceleration.

JR_Trend_Indicator_001
Indicator

JR_Trend_Indicator_001

iMA

This indicator identifies weekly trend shifts by measuring the rate of change in the spread between a 5-period SMA and a 21-period EMA.

JR_Trend_Indicator_v1
Indicator

JR_Trend_Indicator_v1

iMA

This indicator quantifies weekly market bias by calculating the rate of change between a 5-period Simple Moving Average and a 21-period Exponential Moving Average.

Juice StdDev with Histogram  LA
Indicator

Juice StdDev with Histogram LA

iMA

Quantifies market price dispersion by calculating the square root of the mean squared deviations from a customizable moving average over a specific lookback period.

Kairi
Indicator

Kairi

iMA

This indicator quantifies the percentage variance between the current closing price and a simple moving average to highlight momentum extremes.

Kamikaze[1]
Indicator

Kamikaze[1]

iMA

This indicator identifies bullish and bearish market biases by calculating the deviation between typical price and Simple Moving Averages across 5, 15, 30, and 60-minute intervals.

Kanal_Ant
Indicator

Kanal_Ant

iMA

This indicator projects a multi-layered dynamic corridor by calculating three distinct sets of upper and lower bands based on Fibonacci ratios (0.382, 0.618, and 1.0) applied to a moving average.

KantorInformationDD
Indicator

KantorInformationDD

iMA

This indicator aggregates multi-timeframe SMA averages to project daily and hourly weighted levels while providing real-time breakeven tracking and swap cost dynamics.

Indicator

KaseCD Peak oscilator

iATRiMA
KaufWMAcross
Indicator

KaufWMAcross

iMA

This indicator identifies bullish and bearish trend shifts by detecting the exact price point where a Kaufman Adaptive Moving Average crosses a Linear Weighted Moving Average.

KaufWMAcross_v2
Indicator

KaufWMAcross_v2

iMA

This indicator identifies trend reversals by detecting price action crossovers between the Kaufman Adaptive Moving Average and a Linear Weighted Moving Average.

KC
Indicator

KC

iATRiMA

This indicator generates a dynamic corridor by offsetting an Exponential Moving Average by a multiple of the Average True Range to visualize price volatility limits.

KC_v1
Indicator

KC_v1

iATRiMA

This indicator calculates a dynamic trading channel by offsetting an Exponential Moving Average by a multiplier of the Average True Range to identify volatility-based extremes.

KC_v2
Indicator

KC_v2

iATRiMA

This indicator projects a dynamic trading corridor by calculating the deviation of an Exponential Moving Average based on a multiplier of the Average True Range.

Keltner Channel
Indicator

Keltner Channel

iMA

This indicator calculates a dynamic trading corridor by offsetting a typical price moving average with the mean daily range to visualize price expansion and contraction.

Keltner Channels B
Indicator

Keltner Channels B

iATRiMA

This indicator calculates a centralized moving average baseline flanked by upper and lower boundaries derived from customized range-based volatility offsets.

Keltner Channels F
Indicator

Keltner Channels F

iATRiMA

This indicator calculates a central moving average flanked by upper and lower boundaries derived from the product of K-factor and either Average True Range or custom range variance.

Keltner Channels
Indicator

Keltner Channels

iMA

This indicator maps price action boundaries by offsetting a simple moving average of typical prices by the mean absolute range of recent candles.

Keltner Channels1
Indicator

Keltner Channels1

iATRiMA

This indicator projects a multi-layered channel by calculating a moving average baseline and expanding it based on either ATR values or the mean price range to visualize market expansion.

Keltner Channels_v1
Indicator

Keltner Channels_v1

iMA

This indicator plots three lines based on a simple moving average of typical prices, bounded by an added deviation derived from the mean high-low range.

Keltner Channels_v2
Indicator

Keltner Channels_v2

iMA

This indicator projects a three-line boundary system by offsetting a Simple Moving Average with the arithmetic mean of historical price ranges to map market variance.

Keltner Channels_v3
Indicator

Keltner Channels_v3

iMA

This indicator plots a dynamic trading range by calculating the deviation of typical price averages from their historical high-low spreads.

Keltner_ATR_Band mt4
Indicator

Keltner_ATR_Band mt4

iATRiMA

This indicator calculates dynamic price boundaries by projecting a multiple of the Average True Range onto a Simple Moving Average to identify extreme volatility deviations.

Keltner_ATR_Band mt4_v1
Indicator

Keltner_ATR_Band mt4_v1

iATRiMA

The indicator plots upper and lower bounds by applying a configurable multiplier of the Average True Range to a Simple Moving Average baseline.

Keltner_ATR_Band
Indicator

Keltner_ATR_Band

iATRiMA

This indicator maps price boundaries by calculating the sum of a Simple Moving Average and the product of a multiplier against the Average True Range.

Keltner_ATR_Bands
Indicator

Keltner_ATR_Bands

iATRiMA

This indicator plots dynamic upper and lower boundaries by offsetting a Simple Moving Average with a multiplier of the Average True Range to identify extreme price excursions.

Keltner_ATR_Band_v1
Indicator

Keltner_ATR_Band_v1

iATRiMA

This indicator projects dynamic upper and lower boundaries by offsetting a Simple Moving Average with a multiplier of the Average True Range to identify extreme price deviations.

Keltner_Chanel
Indicator

Keltner_Chanel

iATRiMA

This indicator generates a dynamic trading channel by projecting an Exponential Moving Average boundary outward based on a multiple of the Average True Range.

Keltner_Channel
Indicator

Keltner_Channel

iMA

This indicator constructs a three-line corridor by calculating a simple moving average of typical prices and expanding it using the mean true range of historical price action.

Keltner_Channels
Indicator

Keltner_Channels

iMA

This indicator identifies price boundaries by projecting a dynamic range derived from the average high-low spread around a simple moving average.

Keltner_ChannelsAlert
Indicator

Keltner_ChannelsAlert

iMA

This indicator identifies momentum shifts by monitoring price excursions beyond a mean-adjusted volatility band derived from the range of high and low extremes.

Keltner_Channels_v1
Indicator

Keltner_Channels_v1

iMA

This indicator projects dynamic price boundaries by calculating a standard moving average and overlaying it with the historical range of high-low price fluctuations.

KG FI V.1.0
Indicator

KG FI V.1.0

iMAiMAOnArray

This indicator quantifies price velocity by multiplying volume by the percentage change of a moving average, then applying a low-weight smoothing filter to identify trend transitions.

KG FLAT DETECTOR
Indicator

KG FLAT DETECTOR

iBandsiMA

This indicator analyzes price velocity by comparing a short-term moving average against weighted Bollinger Band extremities to identify non-trending, stagnant market phases.

KG MA 1.3b
Indicator

KG MA 1.3b

iMA

This indicator visualizes simultaneous moving average trends across multiple timeframes—ranging from 15 minutes to monthly intervals—to provide a comprehensive overview of market momentum and directional bias.

KG Momentum V.1.1a Current
Indicator

KG Momentum V.1.1a Current

iMAiMAOnArray

This indicator calculates the percentage rate of change of a long-term linear weighted moving average and generates signals based on the crossover of two smoothed momentum lines.

KhaosAssault
Indicator

KhaosAssault

iMA

This indicator captures directional momentum by calculating the delta between dual moving averages and visualizing trend shifts through color-coded histogram dynamics.