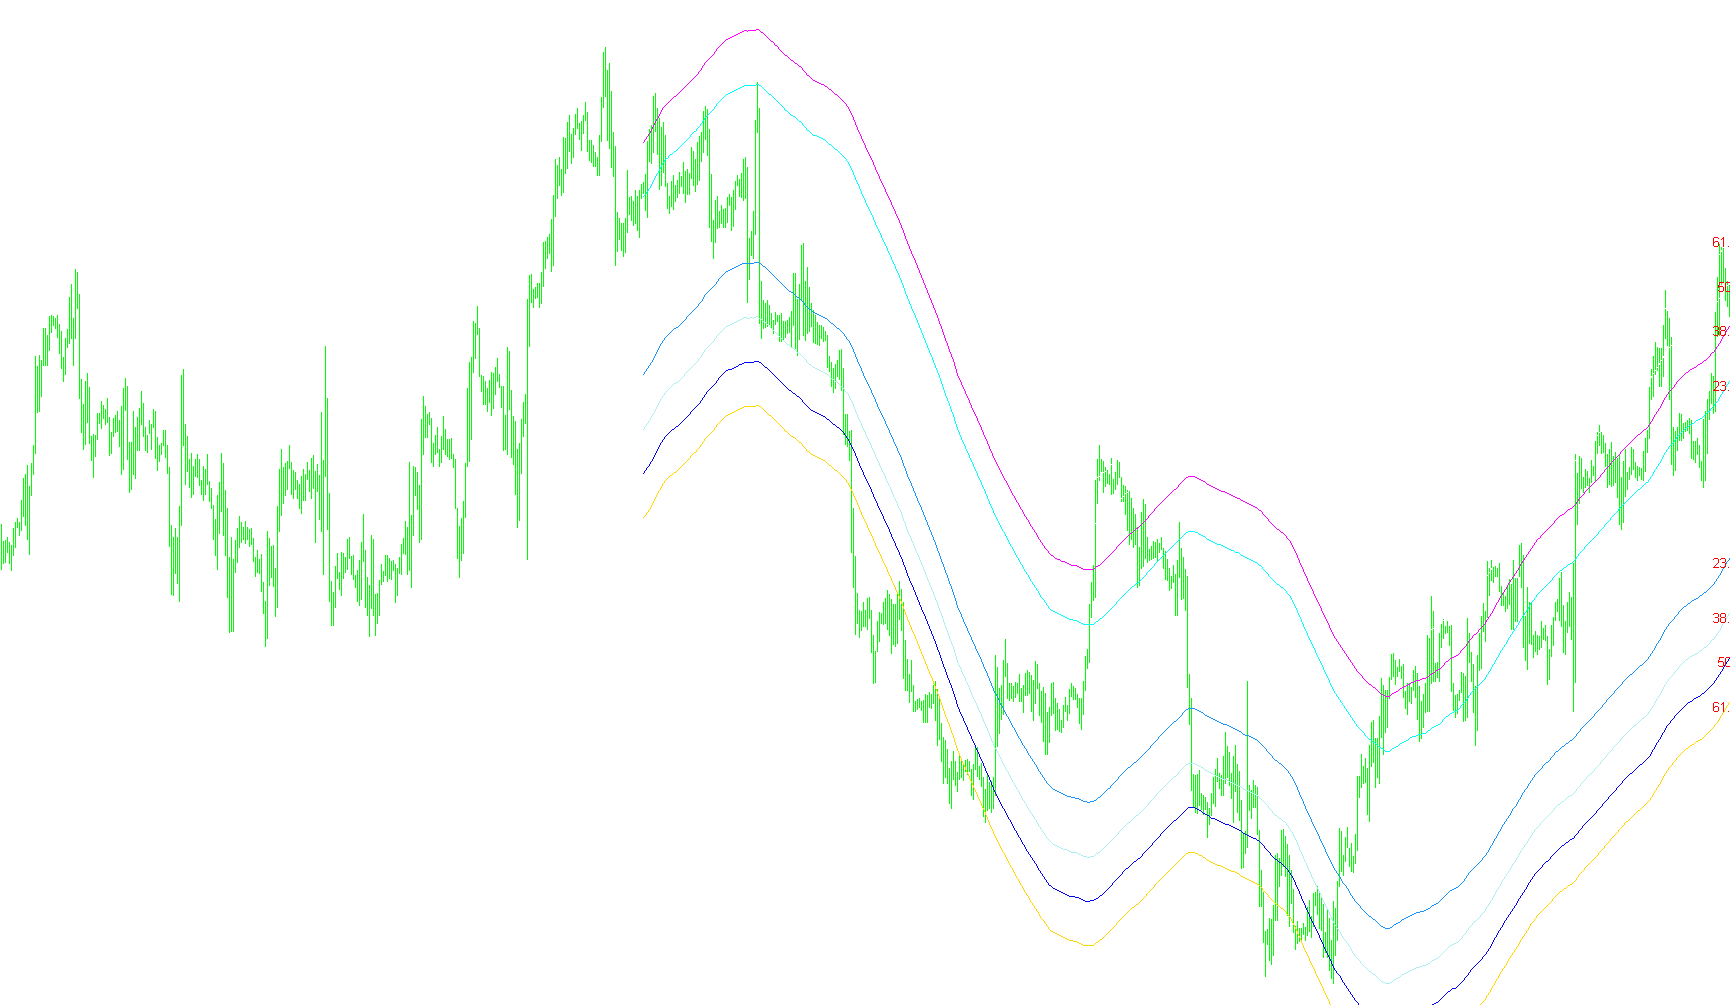
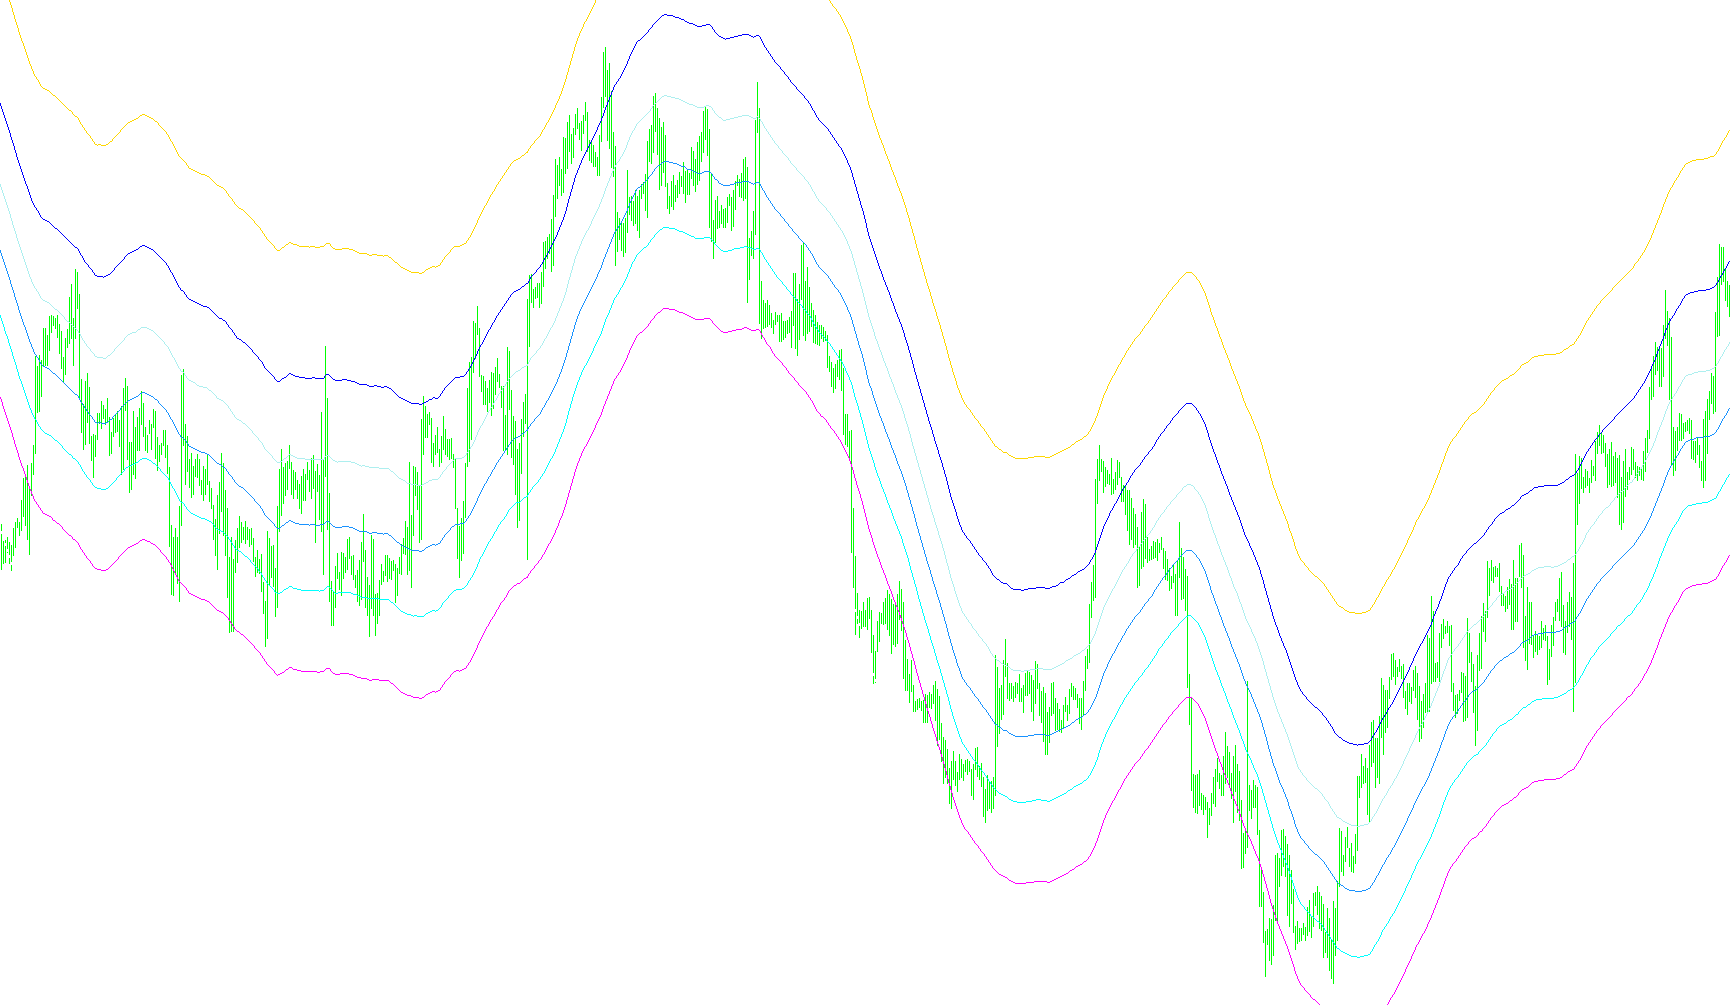
KhaosAssault2
Indicator

KhaosAssault2

iMA

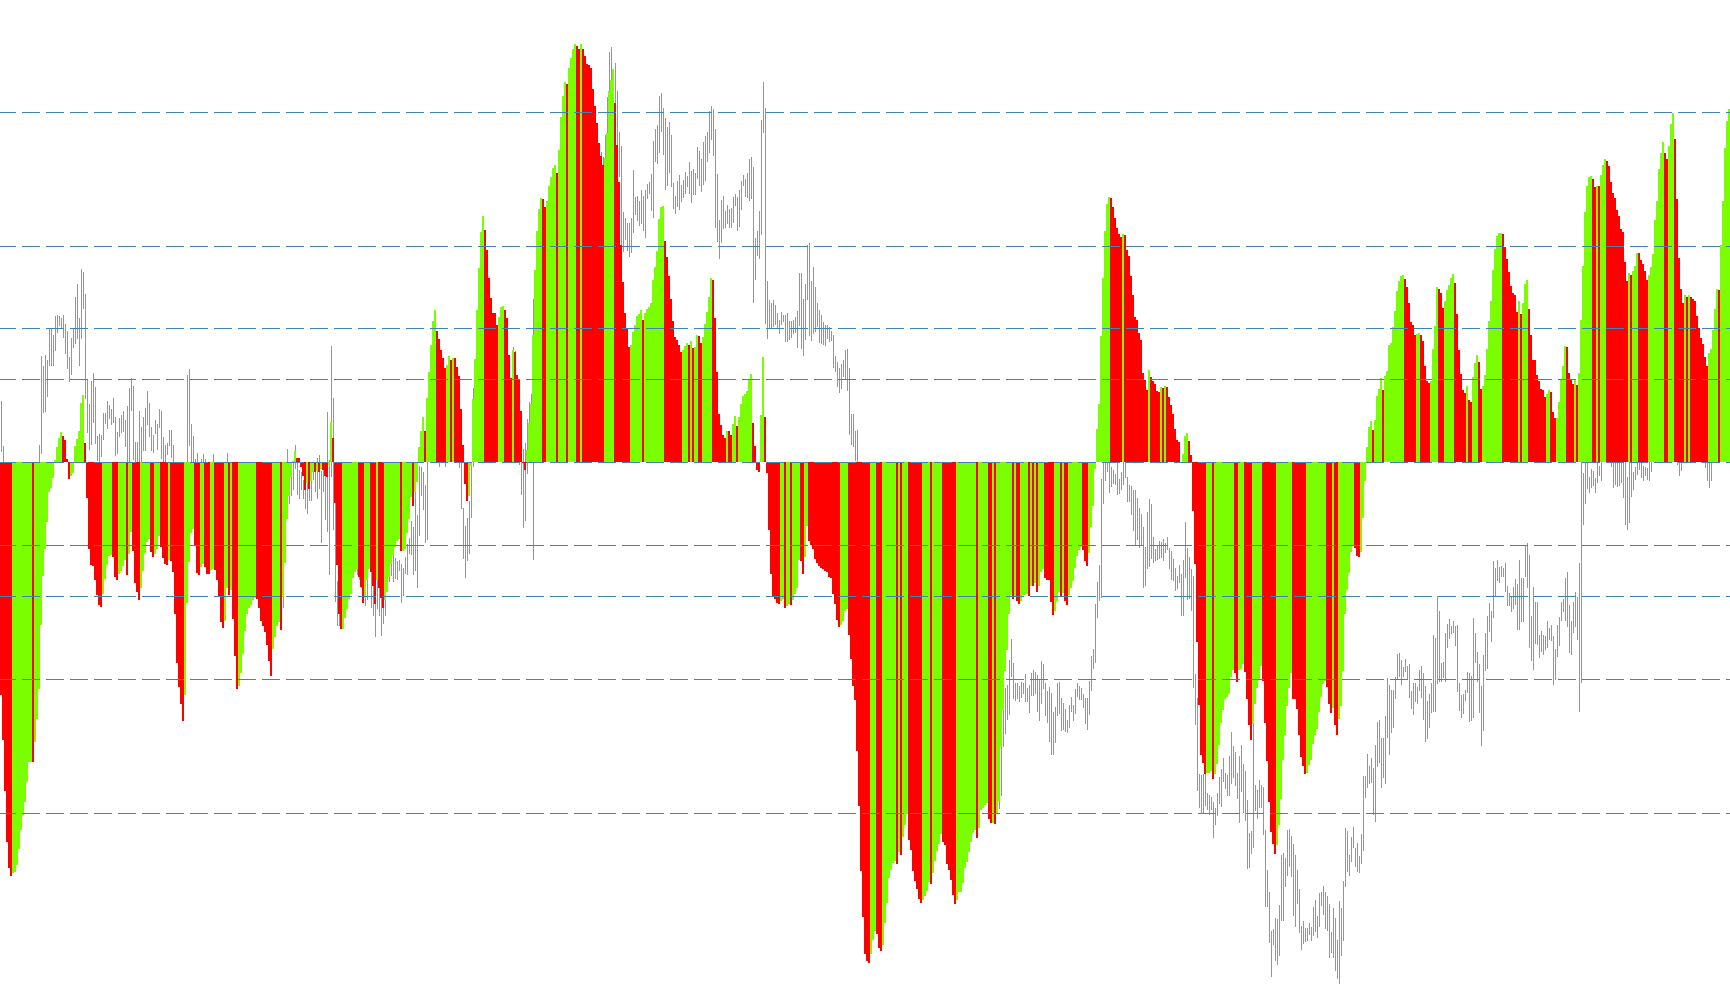
This indicator visualizes the divergence between a fast and a slow moving average using a histogram, highlighting periods where the faster MA is above (green) or below (red) the slower MA, and adjusts level lines based on whether the currency pair involves JPY.

KhaosAssault2_v1
Indicator

KhaosAssault2_v1

iMA

This indicator displays a histogram visualizing the divergence between a fast and slow moving average, highlighting periods of increasing or decreasing separation between the two.

KI-Alert
Indicator

KI-Alert

iMAiMAOnArray

This indicator calculates the dynamic spread between short and medium-term exponential moving averages, applying a third smoothing layer to identify directional trend crossovers.

KI
Indicator

KI

iMAiMAOnArray

This indicator identifies momentum shifts by calculating the moving average of the spread between two exponential averages and triggering signals upon zero-line crossovers.

kijun_candles_two_colors
Indicator

kijun_candles_two_colors

iIchimokuiMA
kino_3MA_Ribbon
Indicator

kino_3MA_Ribbon

iMA

This indicator visualizes trend dynamics by plotting a multi-period moving average ribbon that contrasts high-frequency EMA signals against a long-term SMA baseline.

KI_signals1_H1+low_3-10-18_optimized
Indicator

KI_signals1_H1+low_3-10-18_optimized

iMAiMAOnArray

This indicator detects trend shifts by calculating the EMA differential between multiple periods and identifying zero-cross signals across higher timeframe data.

KI_signals1_H1+low_3-10-18_optimized_v1
Indicator

KI_signals1_H1+low_3-10-18_optimized_v1

iMAiMAOnArray

The indicator identifies trend reversals by detecting zero-crossings of a smoothed momentum histogram while filtering signals through higher-timeframe price levels.

KI_signals_v1
Indicator

KI_signals_v1

iMAiMAOnArray

Identifies directional shifts by analyzing EMA spread velocity through a smoothed histogram differential crossover.

KI_signals_v1a
Indicator

KI_signals_v1a

iMAiMAOnArray

This indicator identifies trend reversals by detecting zero-line crossovers of a smoothed difference between multiple exponential moving averages.

KI_signals_v2
Indicator

KI_signals_v2

iMAiMAOnArray

This indicator identifies directional shifts by calculating the differential between dual EMAs and detecting zero-line crossovers of their smoothed average histogram.

KI_signals_v2_v1
Indicator

KI_signals_v2_v1

iMAiMAOnArray

This indicator identifies bullish and bearish momentum shifts by detecting zero-line crossovers of a smoothed histogram derived from the differential between dual Exponential Moving Averages.

Klasternaya Mashka
Indicator

Klasternaya Mashka

iMA

This indicator synthesizes weighted relative price movements across multiple currency pairs to calculate a composite volatility and momentum coefficient.
km-tc
Indicator

km-tc

iMA

Identifies bullish and bearish trends by detecting specific stacking orders of 7, 14, and 21 period exponential moving averages to trigger entry and exit signals.

km-trend_movers
Indicator

km-trend_movers

iATRiMACDiRSIiStochastic

This indicator synthesizes RSI, ATR, Stochastic, MACD, and CCI metrics alongside dual Moving Average crossovers to provide real-time directional strength classifications.

KRI
Indicator

KRI

iMA

The indicator quantifies the percentage variance between the current closing price and its simple moving average to identify overextended market momentum.

Indicator

Krishan

iCCIiMAiRSI
LabTrend2_v1
Indicator

LabTrend2_v1

iATRiMA

This indicator identifies trend direction using smoothed moving average crossovers and projects dynamic support and resistance levels based on weighted ATR volatility expansion.

Laguerre RSI v1.00
Indicator

Laguerre RSI v1.00

iMA

This indicator utilizes a recursive laguerre filter to compute a normalized momentum ratio that identifies trend exhaustion and volatility-adjusted reversals.

LaguerreFilter
Indicator

LaguerreFilter

iMA

This indicator applies a recursive multi-stage laguerre polynomial transform to price data to generate a smoothed trend line with reduced signal noise.

Indicator

Laguerre_RSI_v1.01m_mtf

iMA
Indicator

Laguerre_RSI_v1.01_mtf

iMA

This indicator calculates a smoothed Laguerre RSI, displays it with customizable levels, and generates alerts when the RSI crosses those levels, optionally sending notifications via pop-up, email, or sound.

lastmanstandingindicatorv11
Indicator

lastmanstandingindicatorv11

iMA

Identifies nested multi-scale price extremes by isolating distinct fractal peaks and troughs against a dynamic exponential trend filter.

LCD
Indicator

LCD

iMA

This indicator quantifies trend strength by calculating the relative position of price against both Exponential Moving Averages and Linear Weighted Moving Averages to detect momentum shifts.

LeManStop
Indicator

LeManStop

iMA

This indicator calculates a dynamic trailing stop level by projecting historical price volatility against current exponential moving average trends.

lil_youngin86
Indicator

lil_youngin86

iMA

This indicator visualizes directional momentum by calculating the divergence between two simple moving averages based on median and close prices, rendering a histogram that shifts color based on velocity changes.

Indicator

Linear RegressionMAAppliedPrice

iMA
LinearRegSlope_v1
Indicator

LinearRegSlope_v1

iMA

Quantifies the rate of change in price momentum by calculating the mathematical derivative of a linear least-squares regression over a rolling period.

LinearRegSlope_v1_v1
Indicator

LinearRegSlope_v1_v1

iMA

This indicator calculates the mathematical rate of change by determining the slope of a least-squares linear regression line over a specified lookback period.

LineMA
Indicator

LineMA

iMA

This indicator identifies and visualizes trend momentum by drawing geometric trendlines connecting specific points where two Simple Moving Averages undergo sequential crossovers.

LK_FDI_V2
Indicator

LK_FDI_V2

iMA

This indicator calculates the fractal dimension of price action to differentiate between trending market regimes and high-volatility noise using logarithmic complexity scaling.

LowPassFilter_v1
Indicator

LowPassFilter_v1

iMAiMAOnArray

The indicator applies multi-order digital filtering and standard deviation variance checks to isolate underlying price momentum from market noise.

Indicator

LR trend histo

iMA
LRDegrees
Indicator

LRDegrees

iMA

This indicator calculates multi-degree linear regression slopes to identify structural trend shifts, momentum reversals, and price orientation through geometric degree analysis.

Indicator

LRS_line_mtf

iMA
Indicator

LRS_line_SigL_x2_mtf

iMAOnArrayiMA
Indicator

LR_R2_Trend_Sqz

iATRiMAiStdDev
LSMA EMA
Indicator

LSMA EMA

iMA

This indicator visualizes price breaches of the Exponential Moving Average and Linear Weighted Moving Average to identify trend shifts and structural momentum.

LSMA_NRP
Indicator

LSMA_NRP

iMA

This indicator identifies directional shifts by calculating the weighted difference between Linear Weighted and Simple Moving Averages to highlight momentum transitions.

lsma_VininLRMA
Indicator

lsma_VininLRMA

iMA

This indicator calculates a dynamic trend line by applying a weighted linear combination of Simple Moving Average and Linear Weighted Moving Average values.

LWMA-Crossover_Signal
Indicator

LWMA-Crossover_Signal

iMA

Identifies precise bullish and bearish reversal points by detecting dynamic crossovers between two distinct linear weighted moving average periods.

LWMA-Crossover_Signal_v1
Indicator

LWMA-Crossover_Signal_v1

iMA

This indicator identifies precise trend reversal points by detecting the intersection of two Linear Weighted Moving Averages and projecting visual markers based on local price volatility.

LWMA-Crossover_Signal_v3
Indicator

LWMA-Crossover_Signal_v3

iMA

This indicator identifies precise bullish and bearish shift points by detecting the intersection of two linear weighted moving averages with a volatility-adjusted offset.

LWMA2
Indicator

LWMA2

iMA

This indicator calculates the numerical spread between twice the primary weighted moving average and the secondary weighted moving average to highlight momentum divergence.

M.A.C.H_X_alert
Indicator

M.A.C.H_X_alert

iMA

Identifies bullish and bearish trend reversals by detecting precise intersections between two shifted simple moving averages while incorporating a volatility-based range calculation for visual markers.

M.A.C.H_X_alert_v2
Indicator

M.A.C.H_X_alert_v2

iMA

Identifies bullish and bearish momentum shifts by detecting precise crossovers between shifted Simple Moving Averages relative to localized volatility ranges.

MA Candles
Indicator

MA Candles

iMA

This indicator renders real-time price action aesthetics by painting candle bodies and wicks based on the relative bullish or bearish positioning of two distinct moving average crossovers.

MA Chanels FIBO
Indicator

MA Chanels FIBO

iMA

This indicator projects dynamic Fibonacci retracement levels relative to a moving average basis by calculating the historical price extremes within a user-defined lookback period.

MA Chanels FiboEnv Mid
Indicator

MA Chanels FiboEnv Mid

iMA

This indicator projects a multi-layered Fibonacci retracement zone around a moving average by calculating the historical volatility range of price deviations.

MA Chanels
Indicator

MA Chanels

iMA

This indicator projects dual-sided Fibonacci retracement levels based on the maximum historical price deviation from a Simple Moving Average.