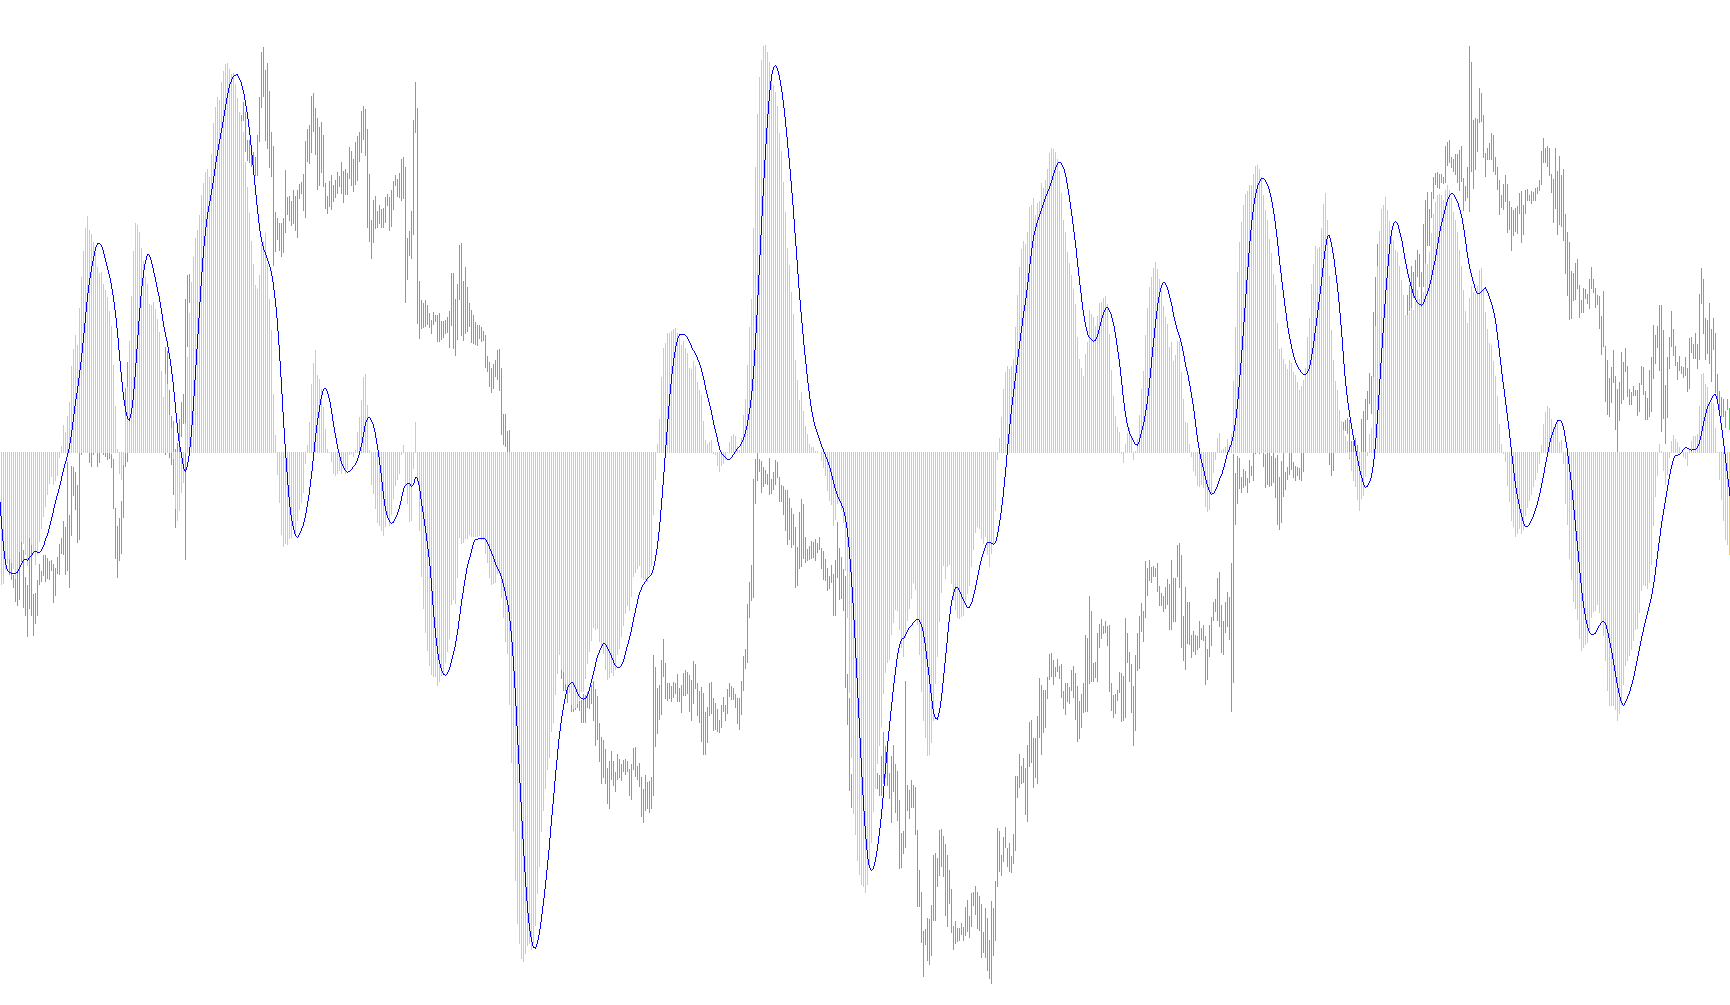
MA Crossover Shift Dots by Dr House
Indicator

MA Crossover Shift Dots by Dr House

iMA

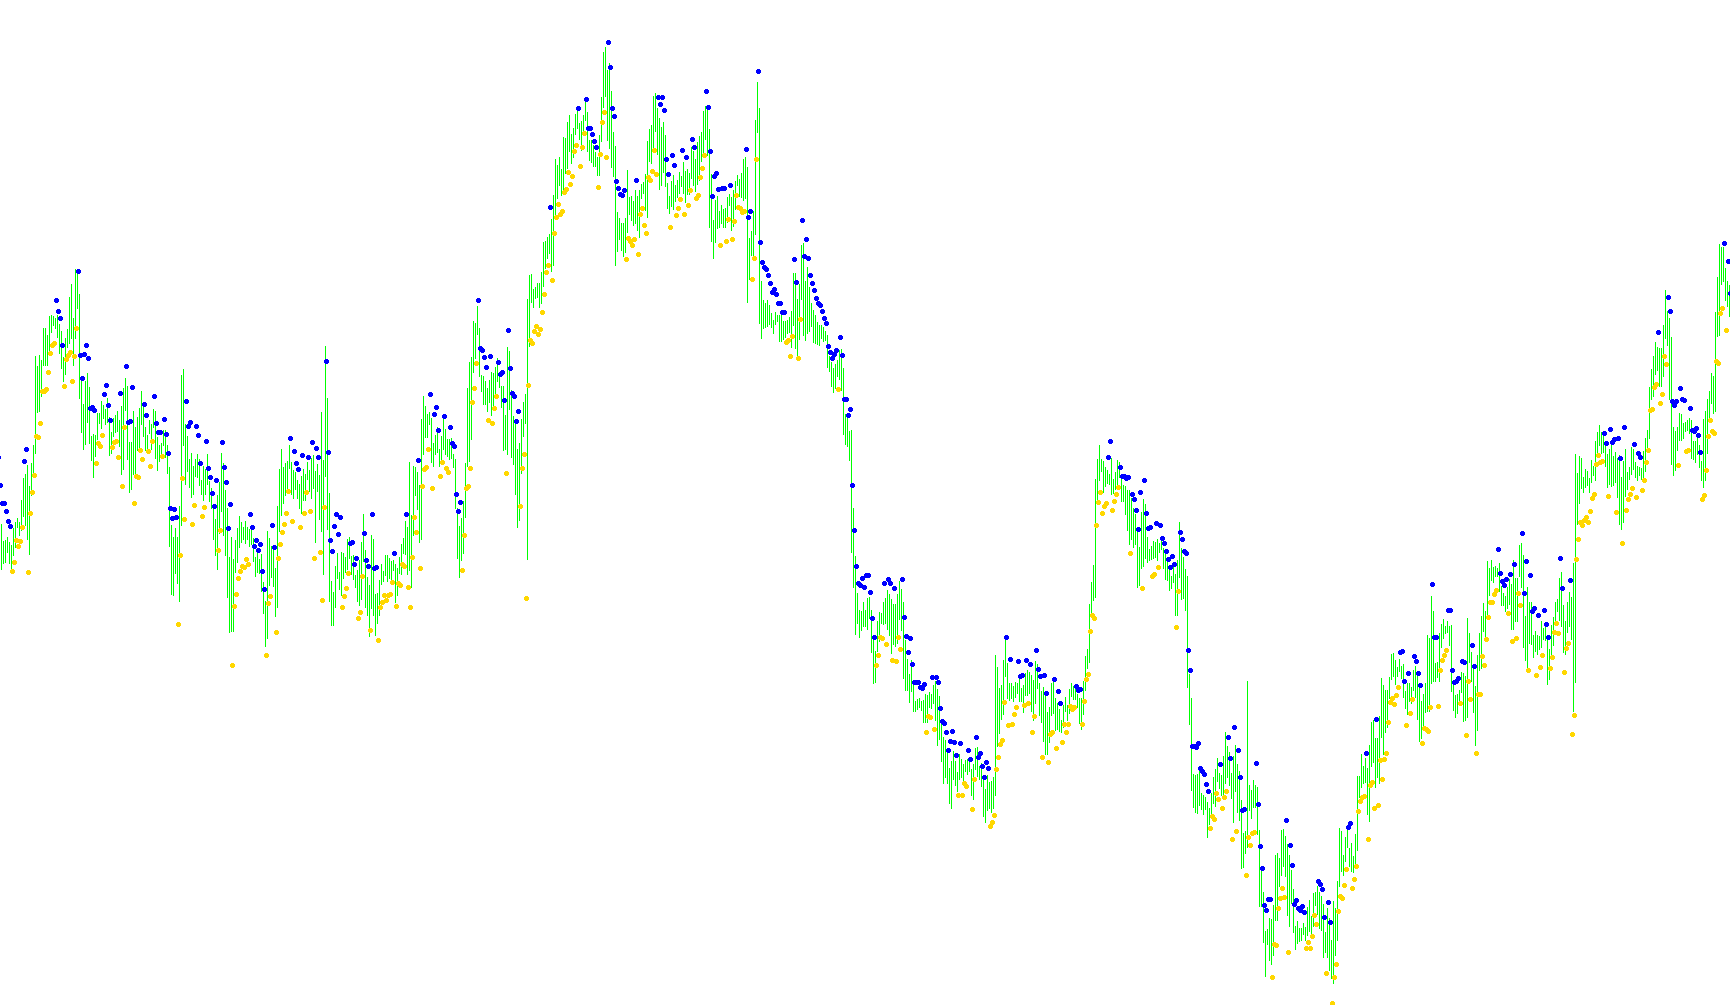
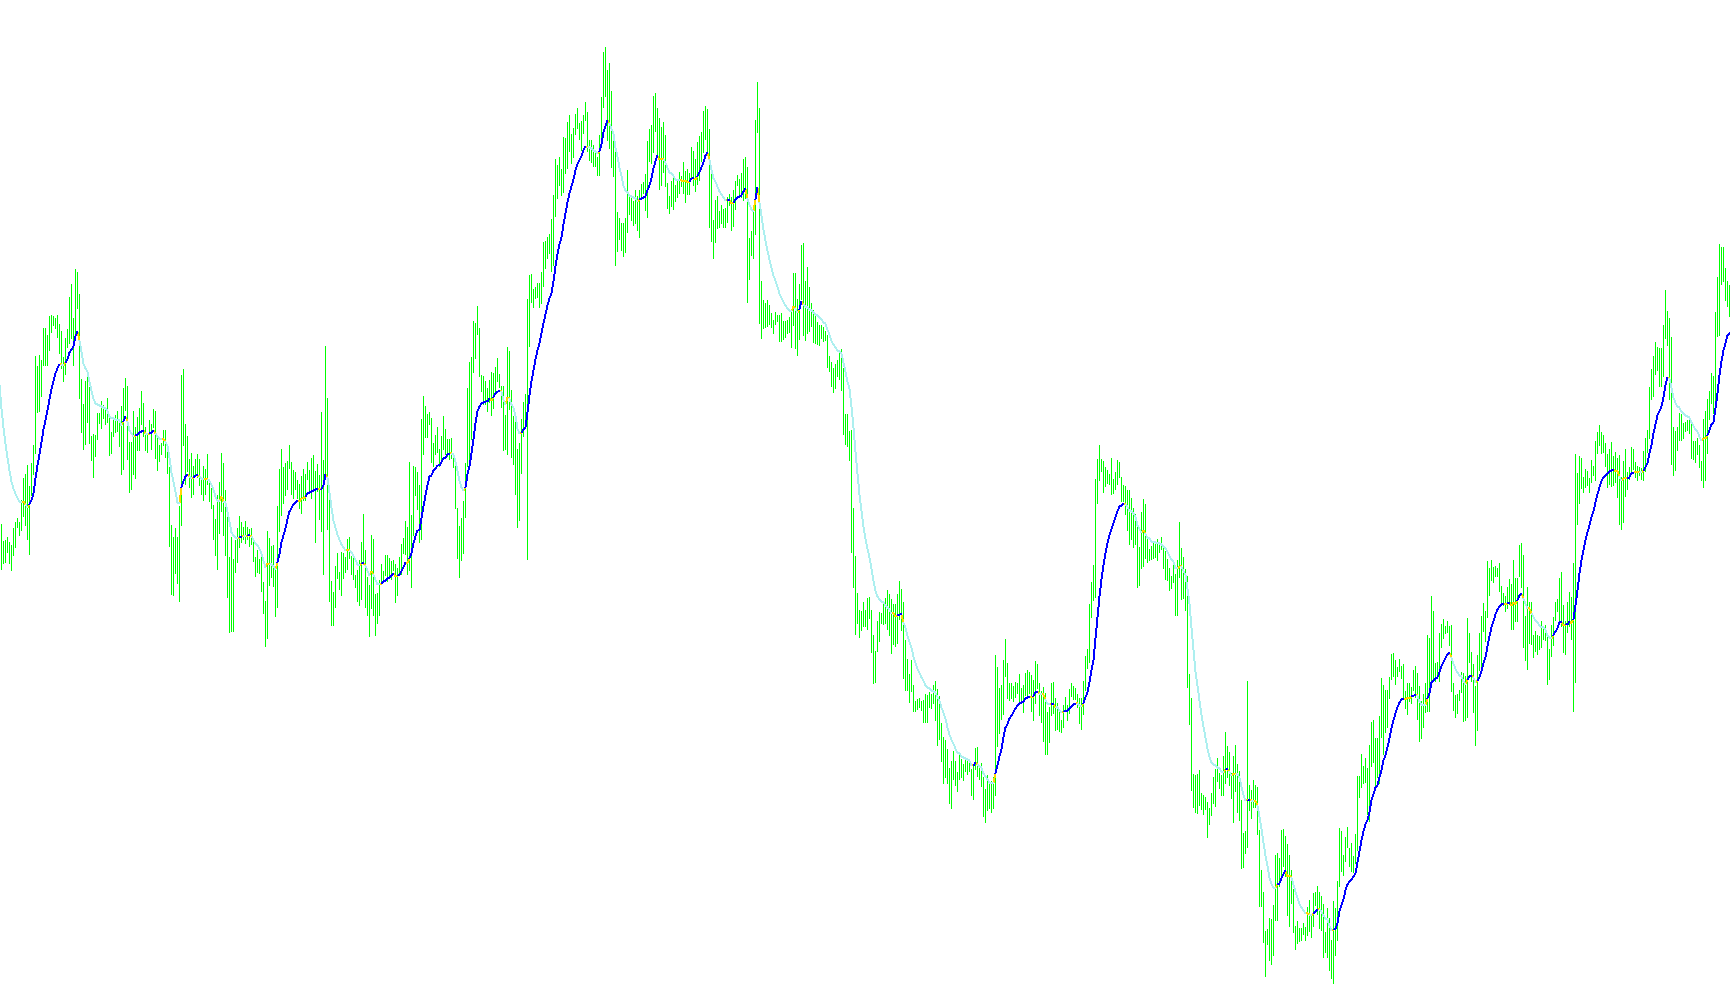
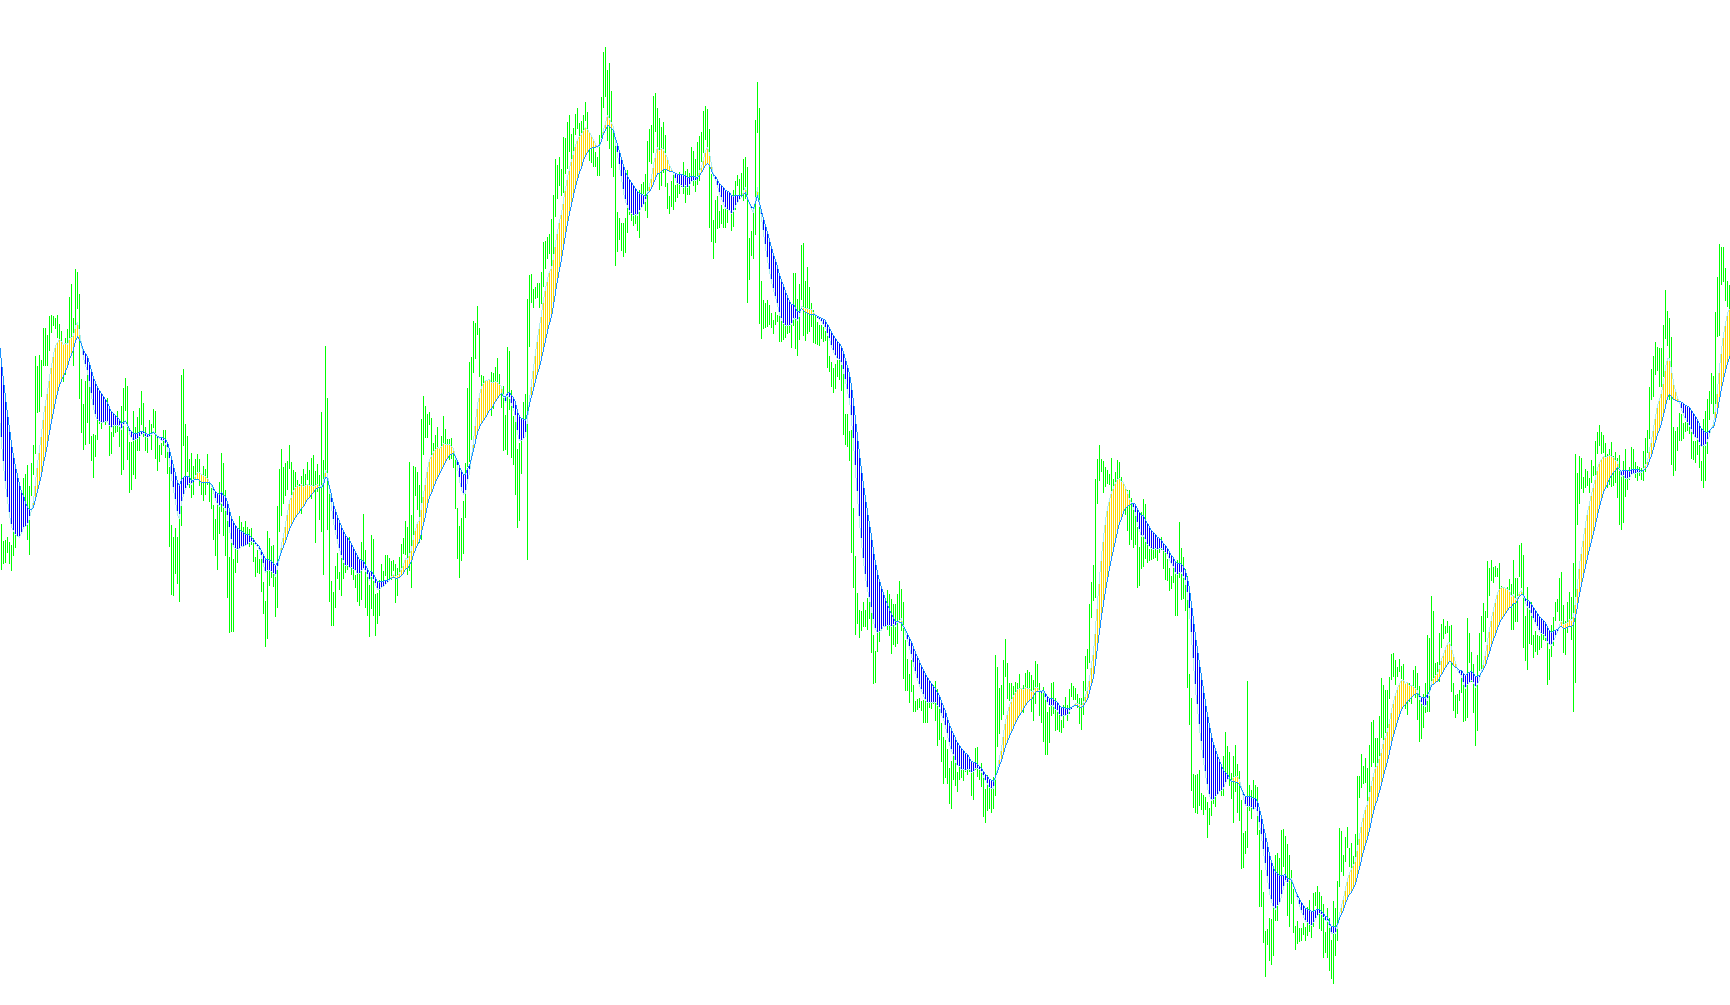
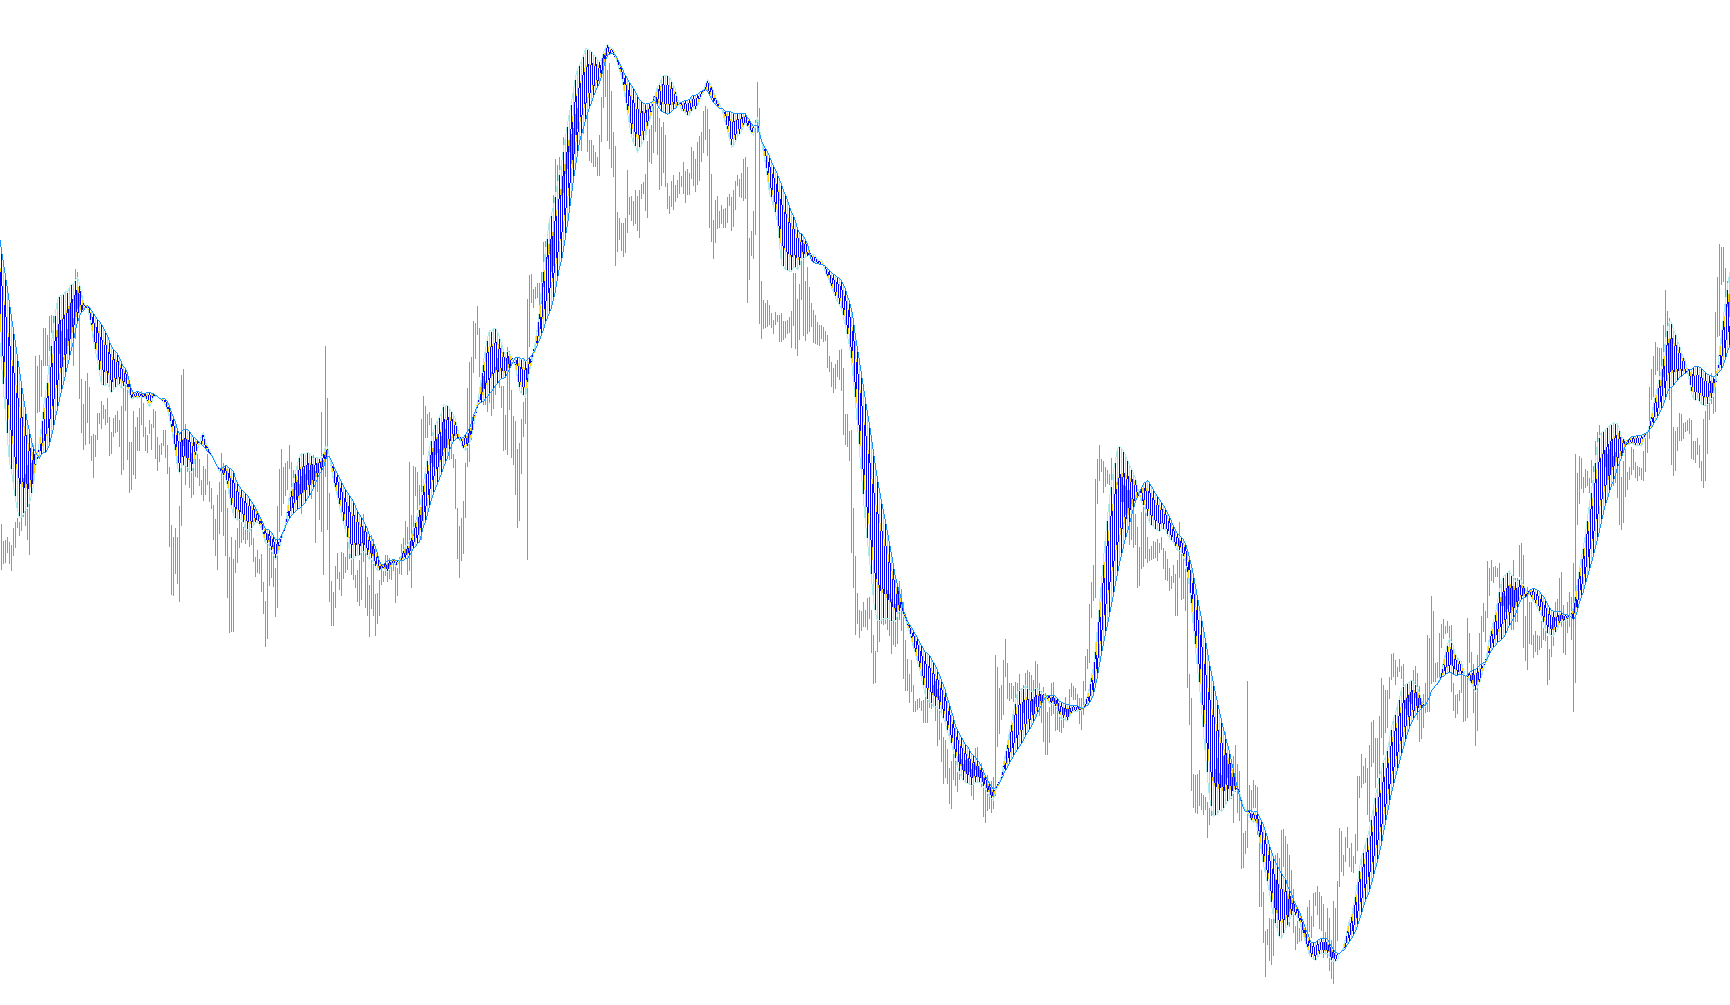
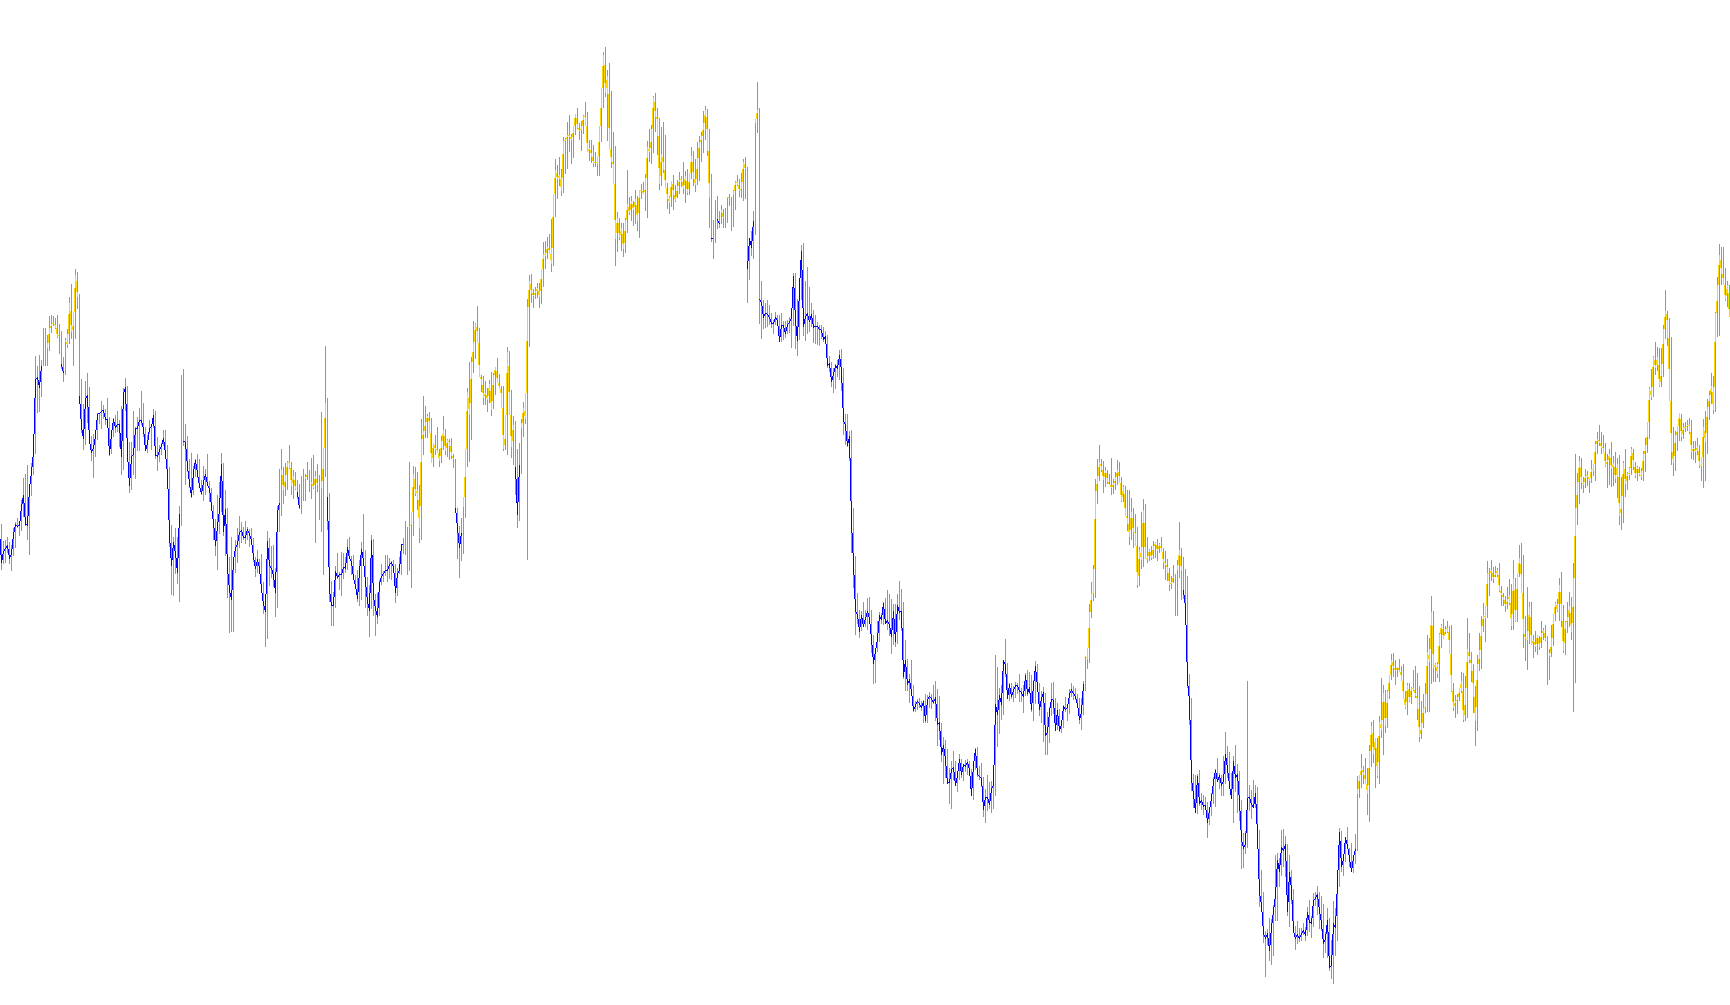
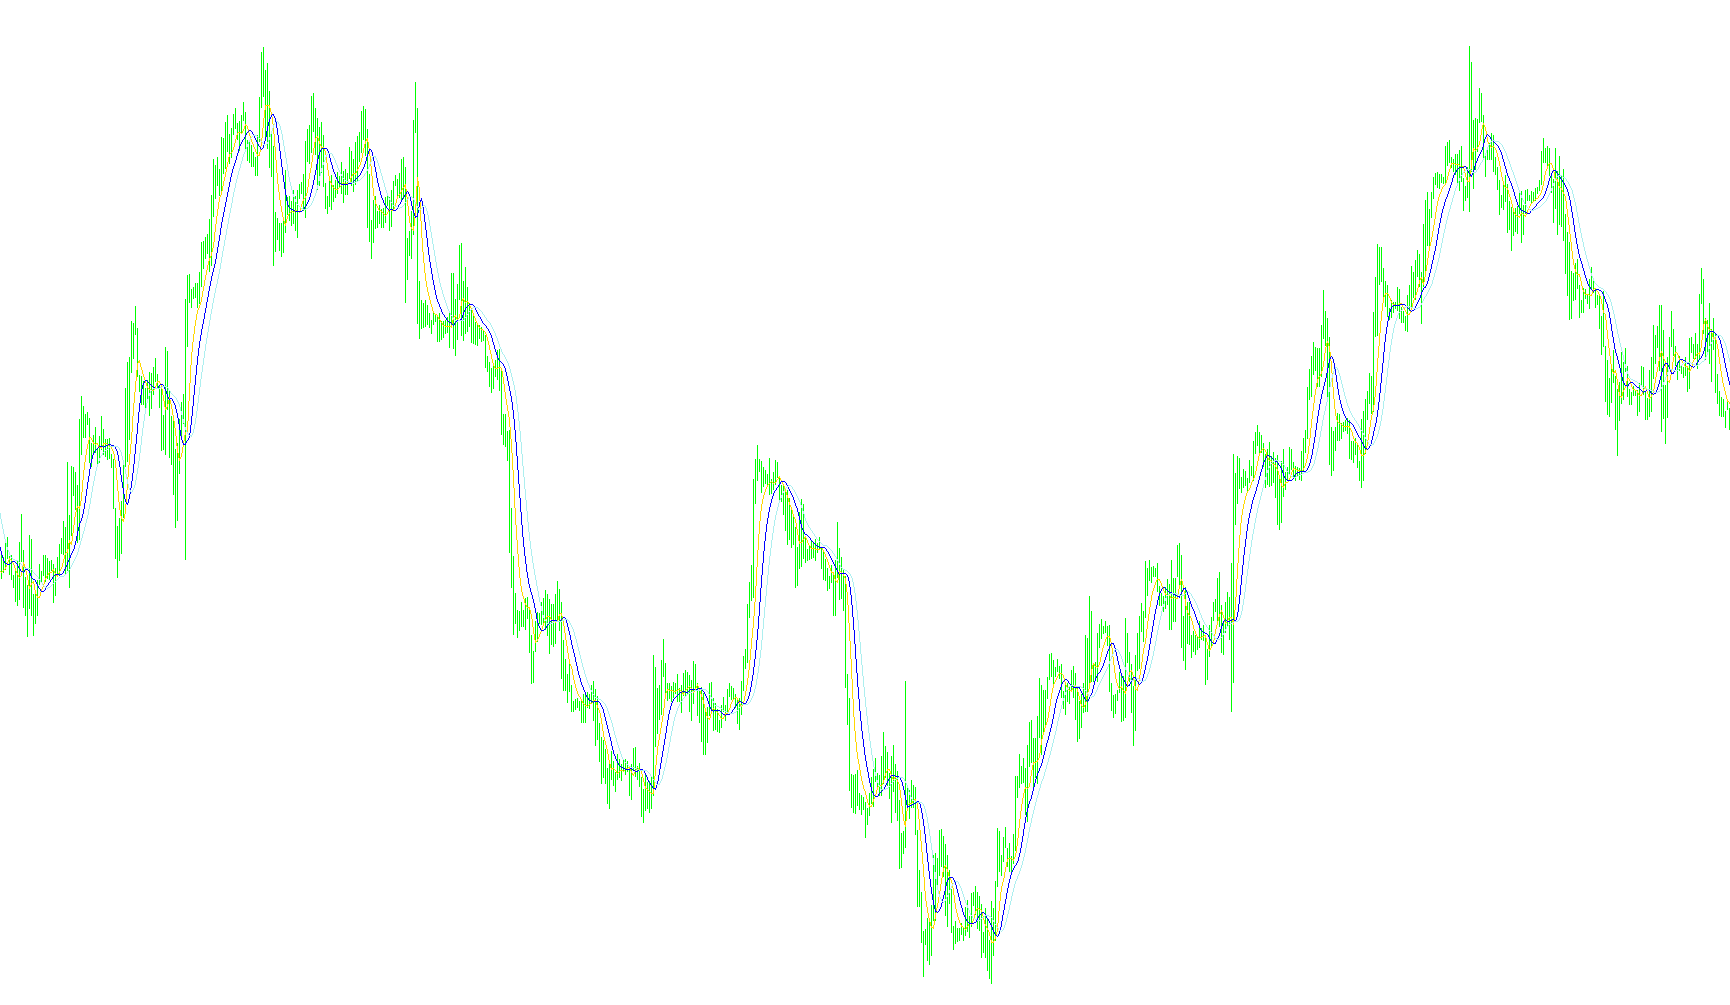
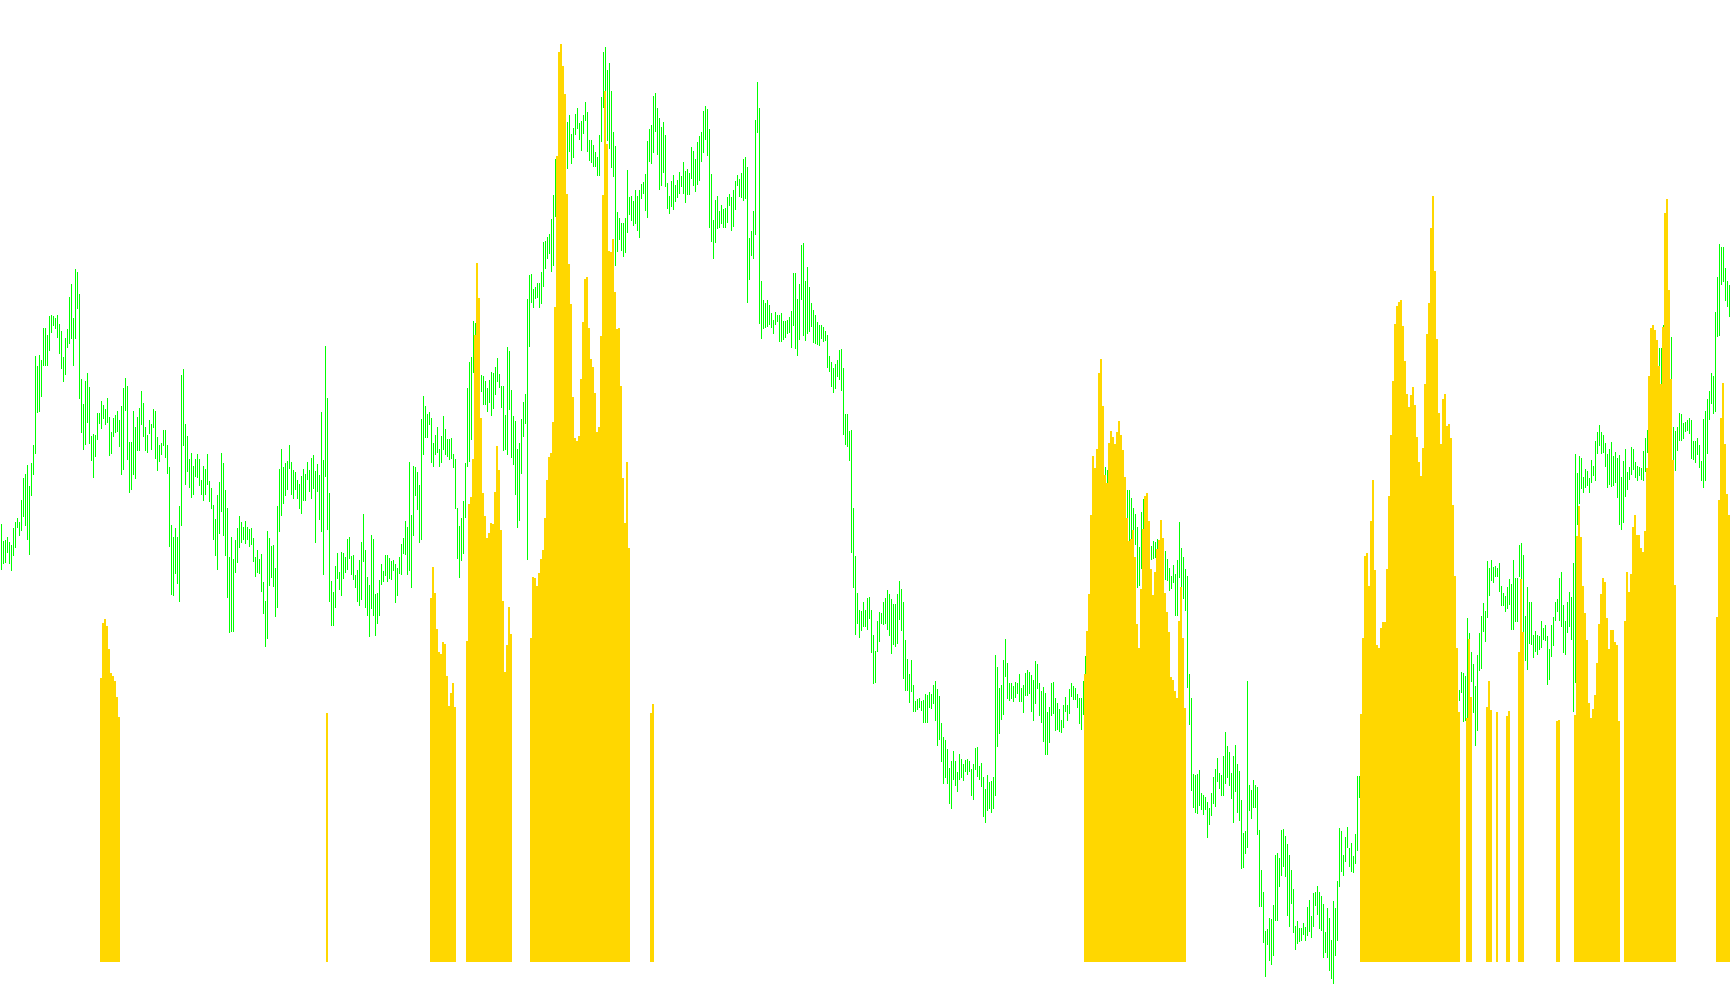
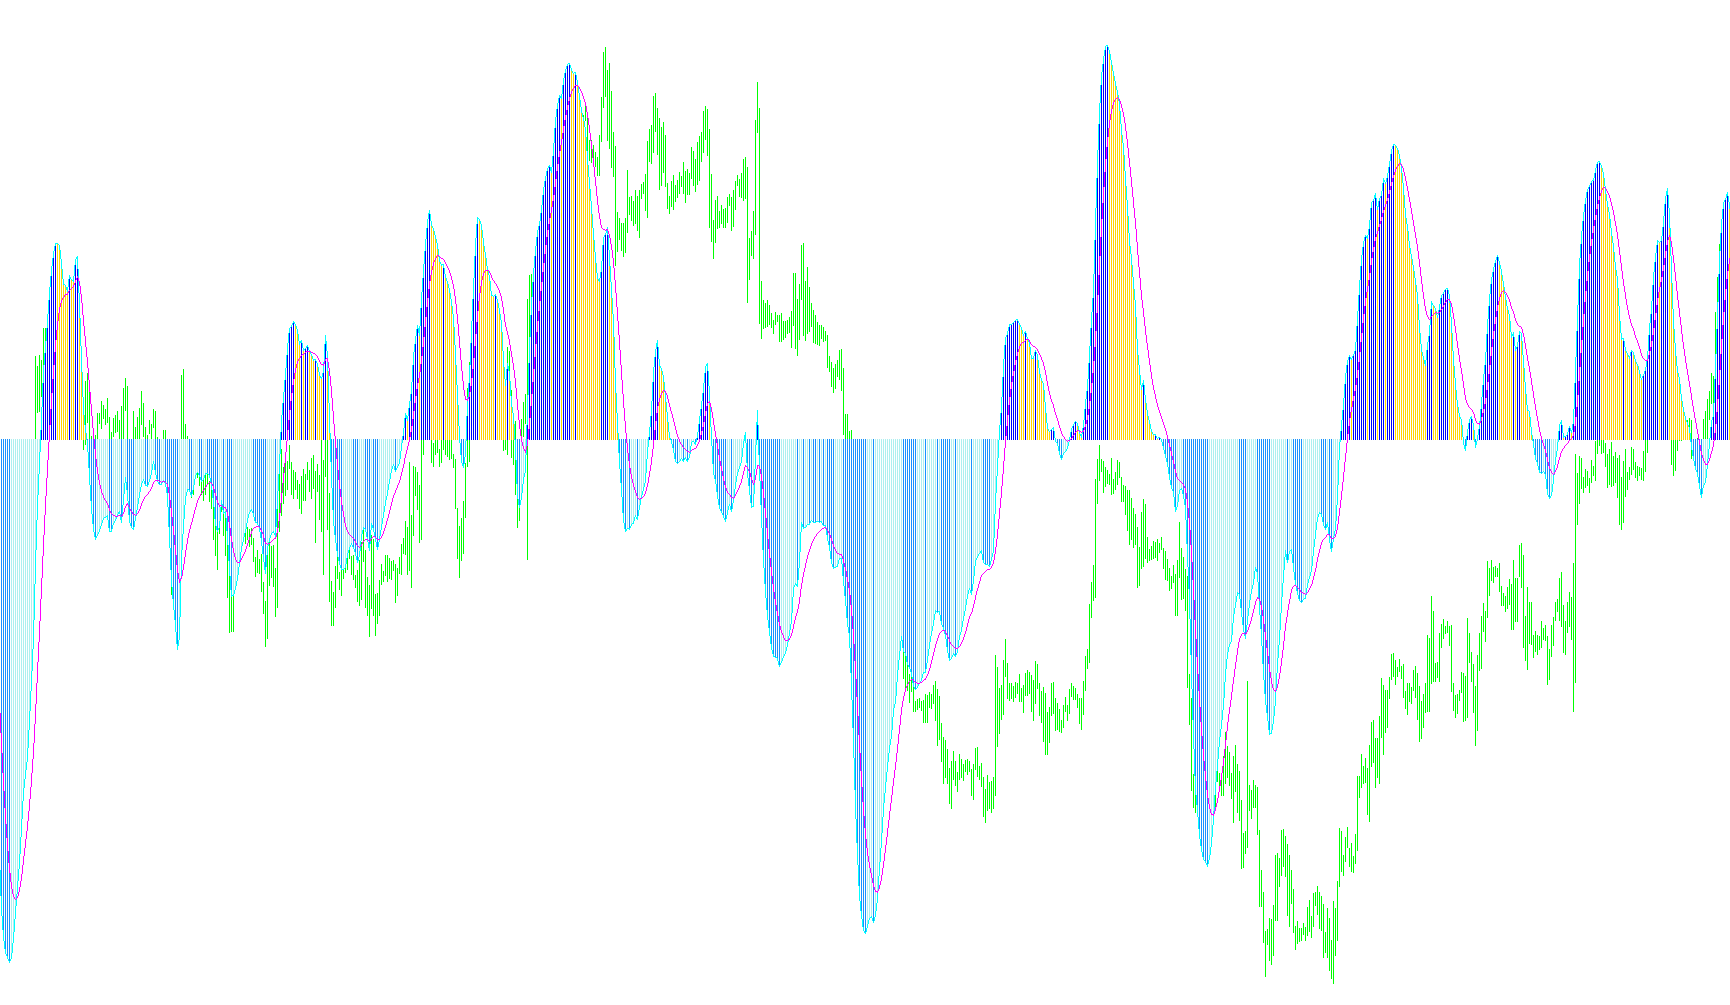
This indicator identifies momentum shifts by comparing current fast moving average values against preceding slow moving average values while scaling visual signals based on localized price range volatility.

MA dots
Indicator

MA dots

iMA

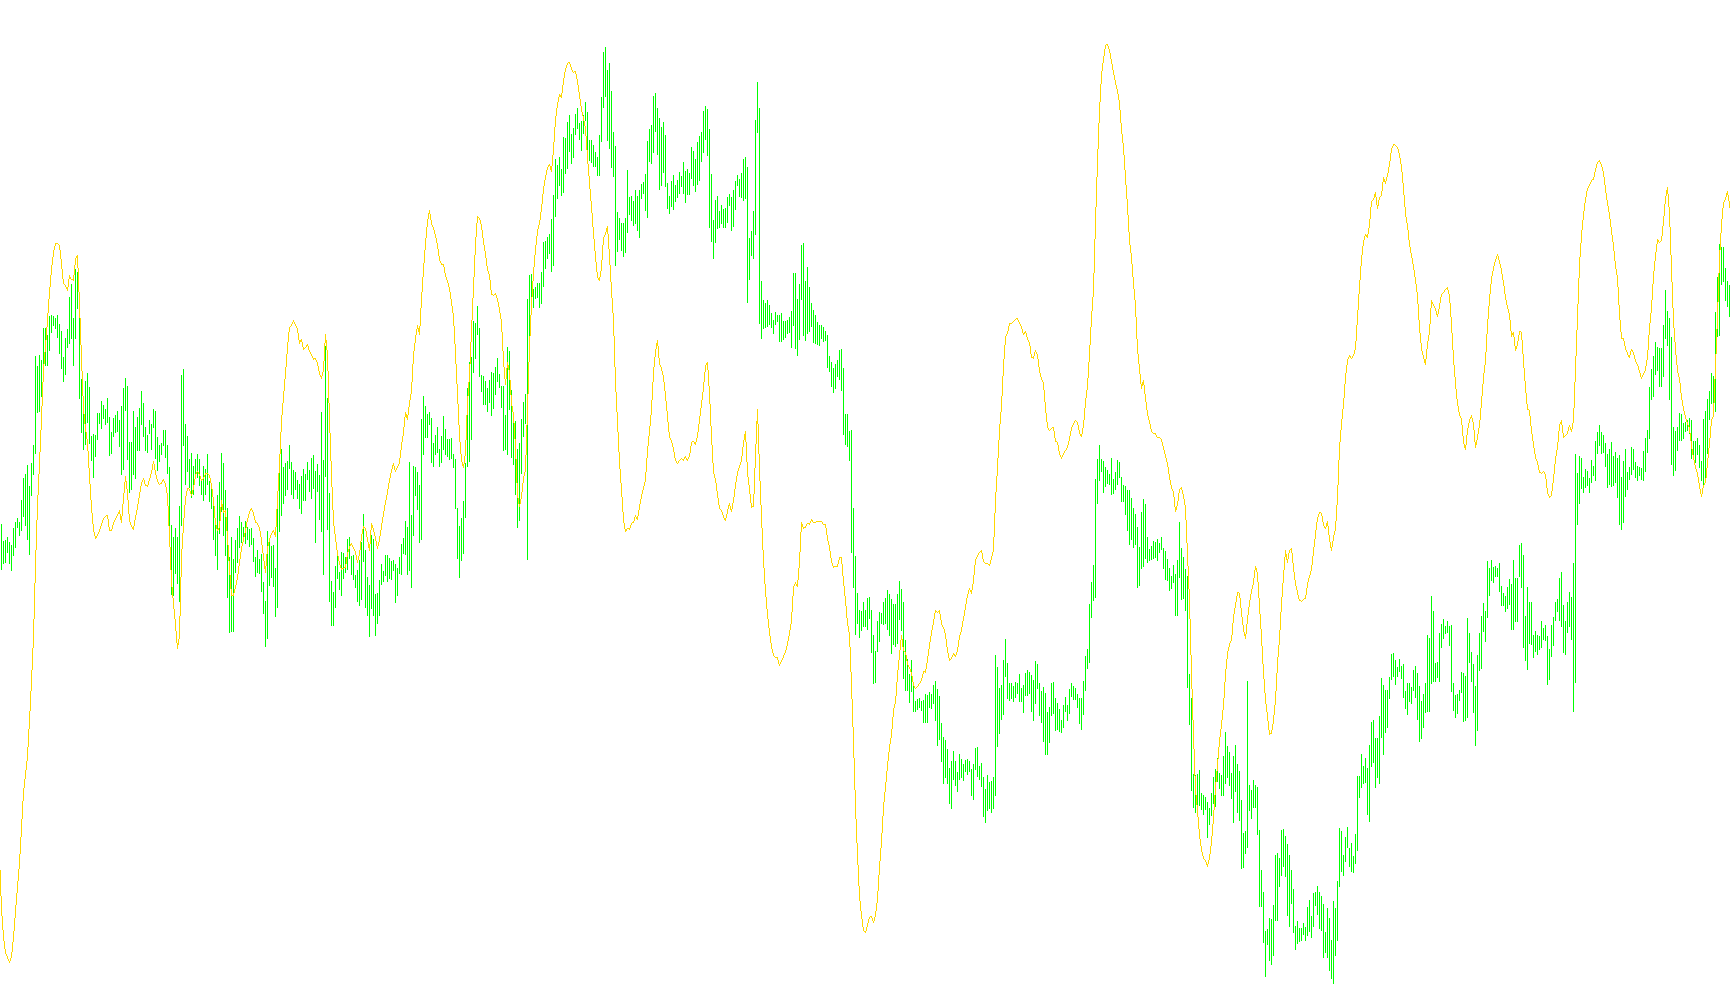
This indicator visualizes the Simple Moving Average based on median price points as a discrete series of geometric dots.

MA dots_v1
Indicator

MA dots_v1

iMA

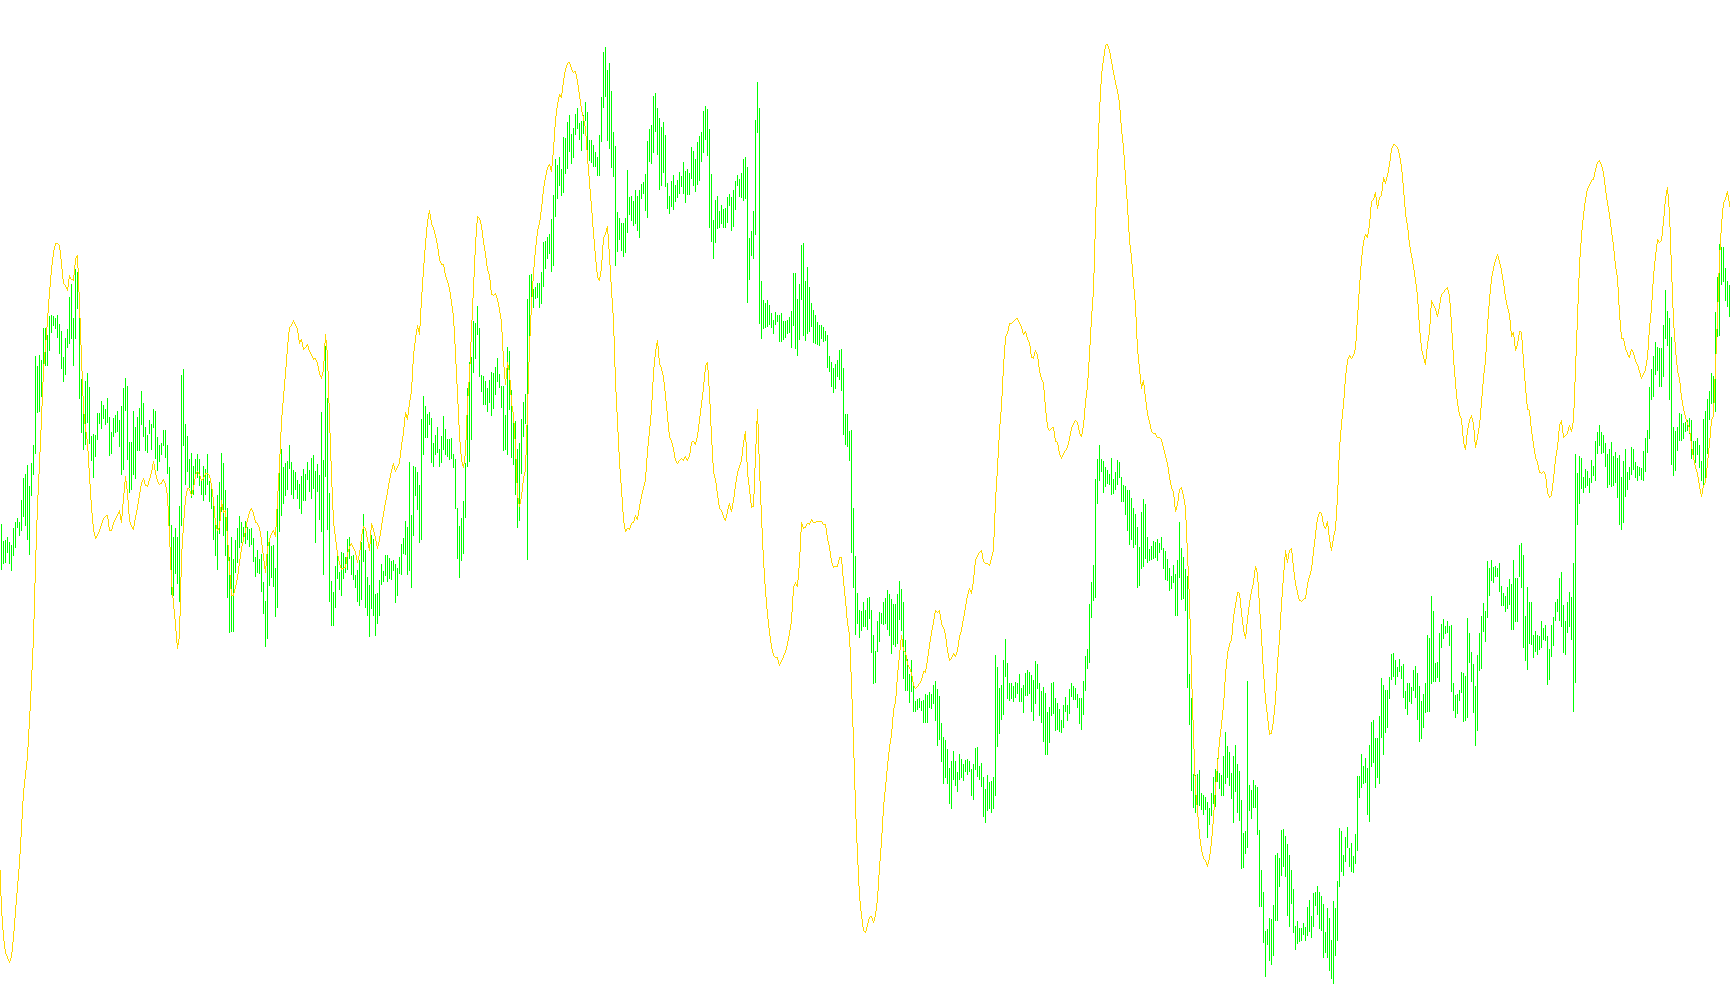
This indicator visualizes a high-frequency Simple Moving Average based on median price points as discrete aesthetic markers.

MA in Color
Indicator

MA in Color

iMA

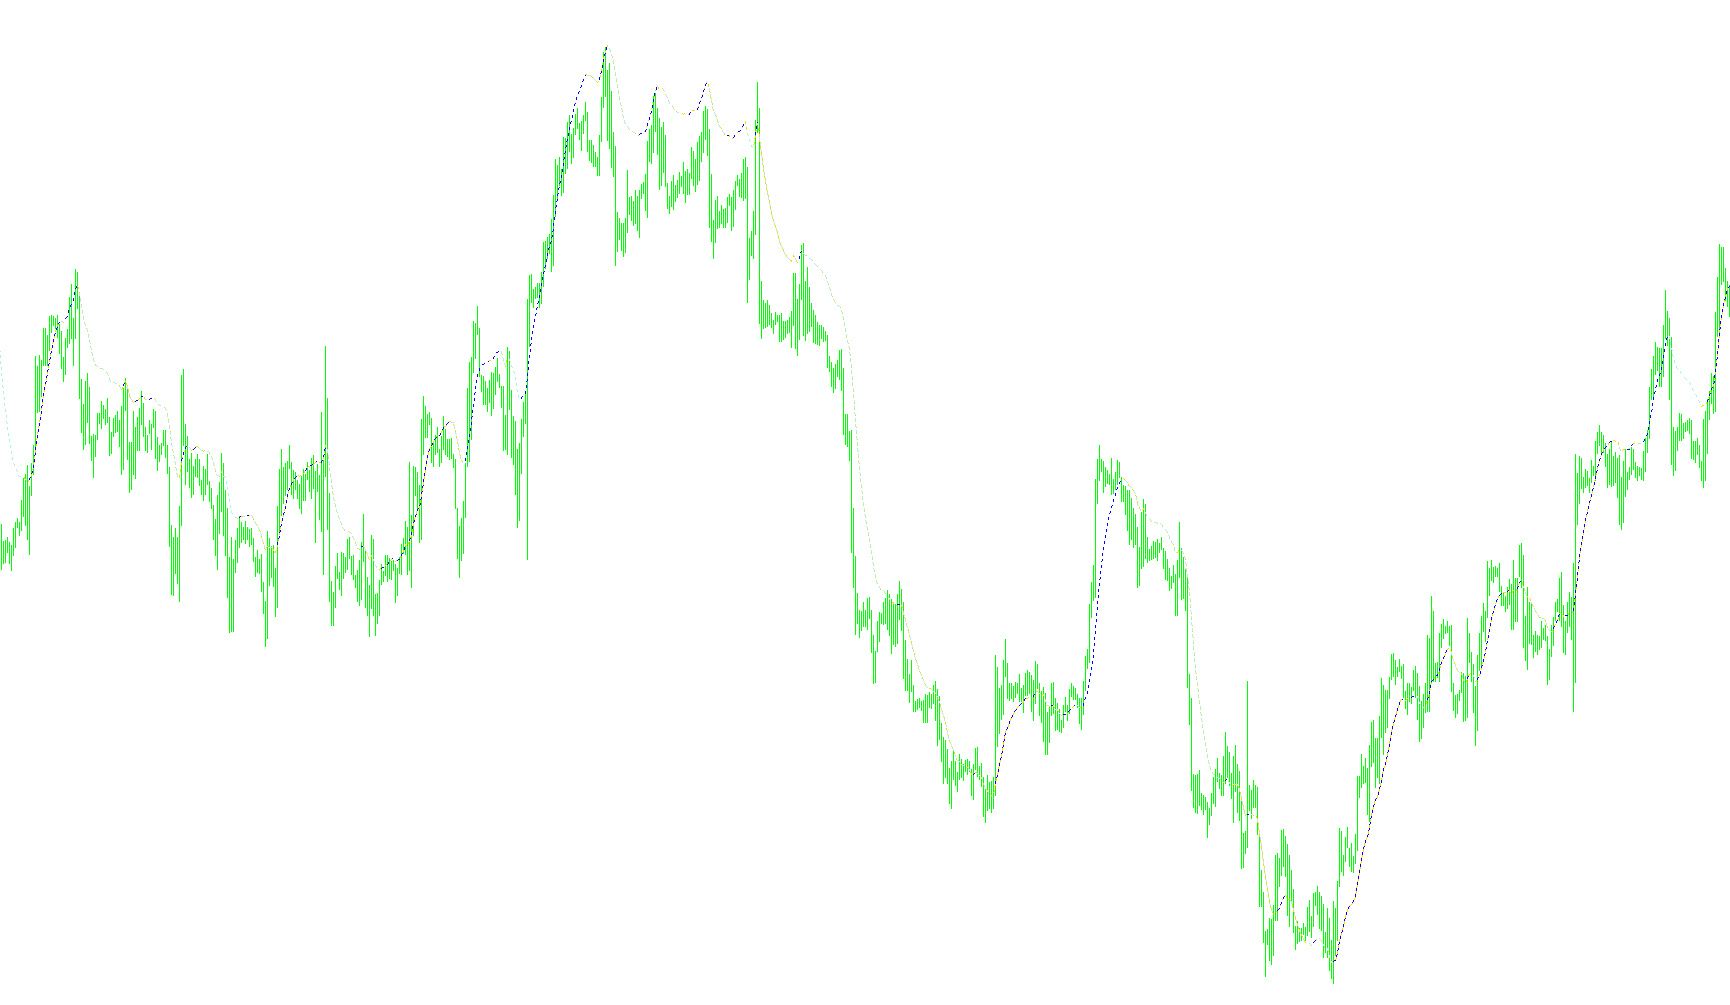
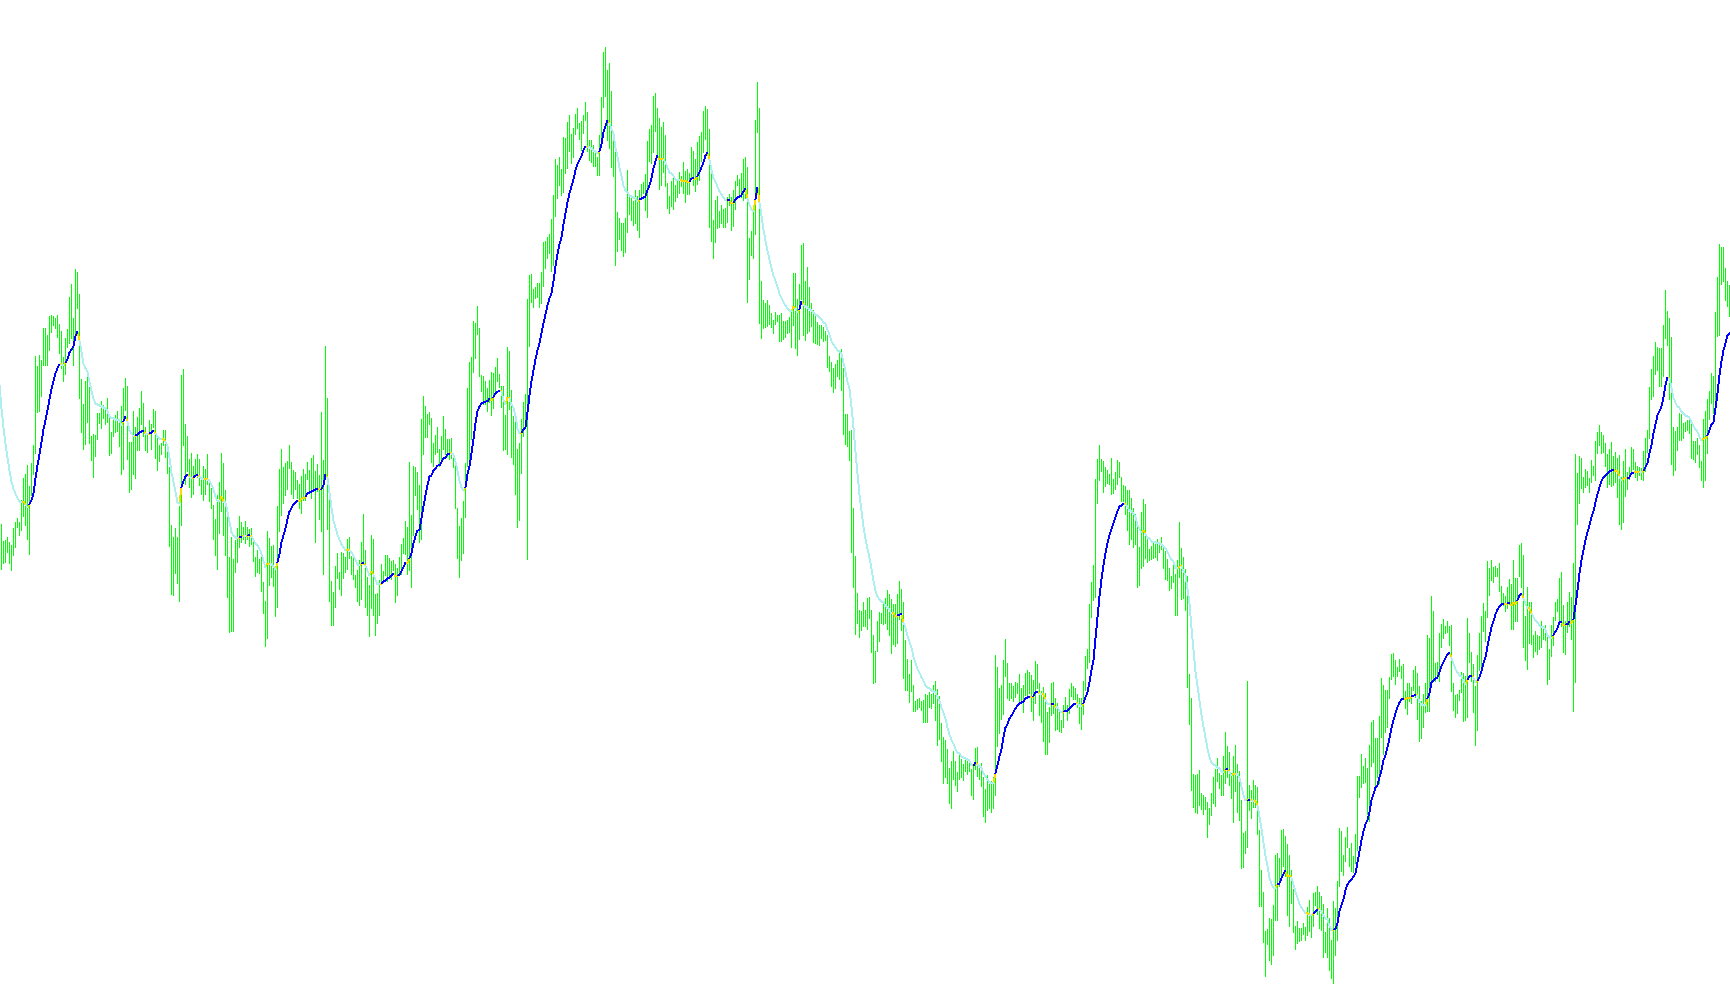
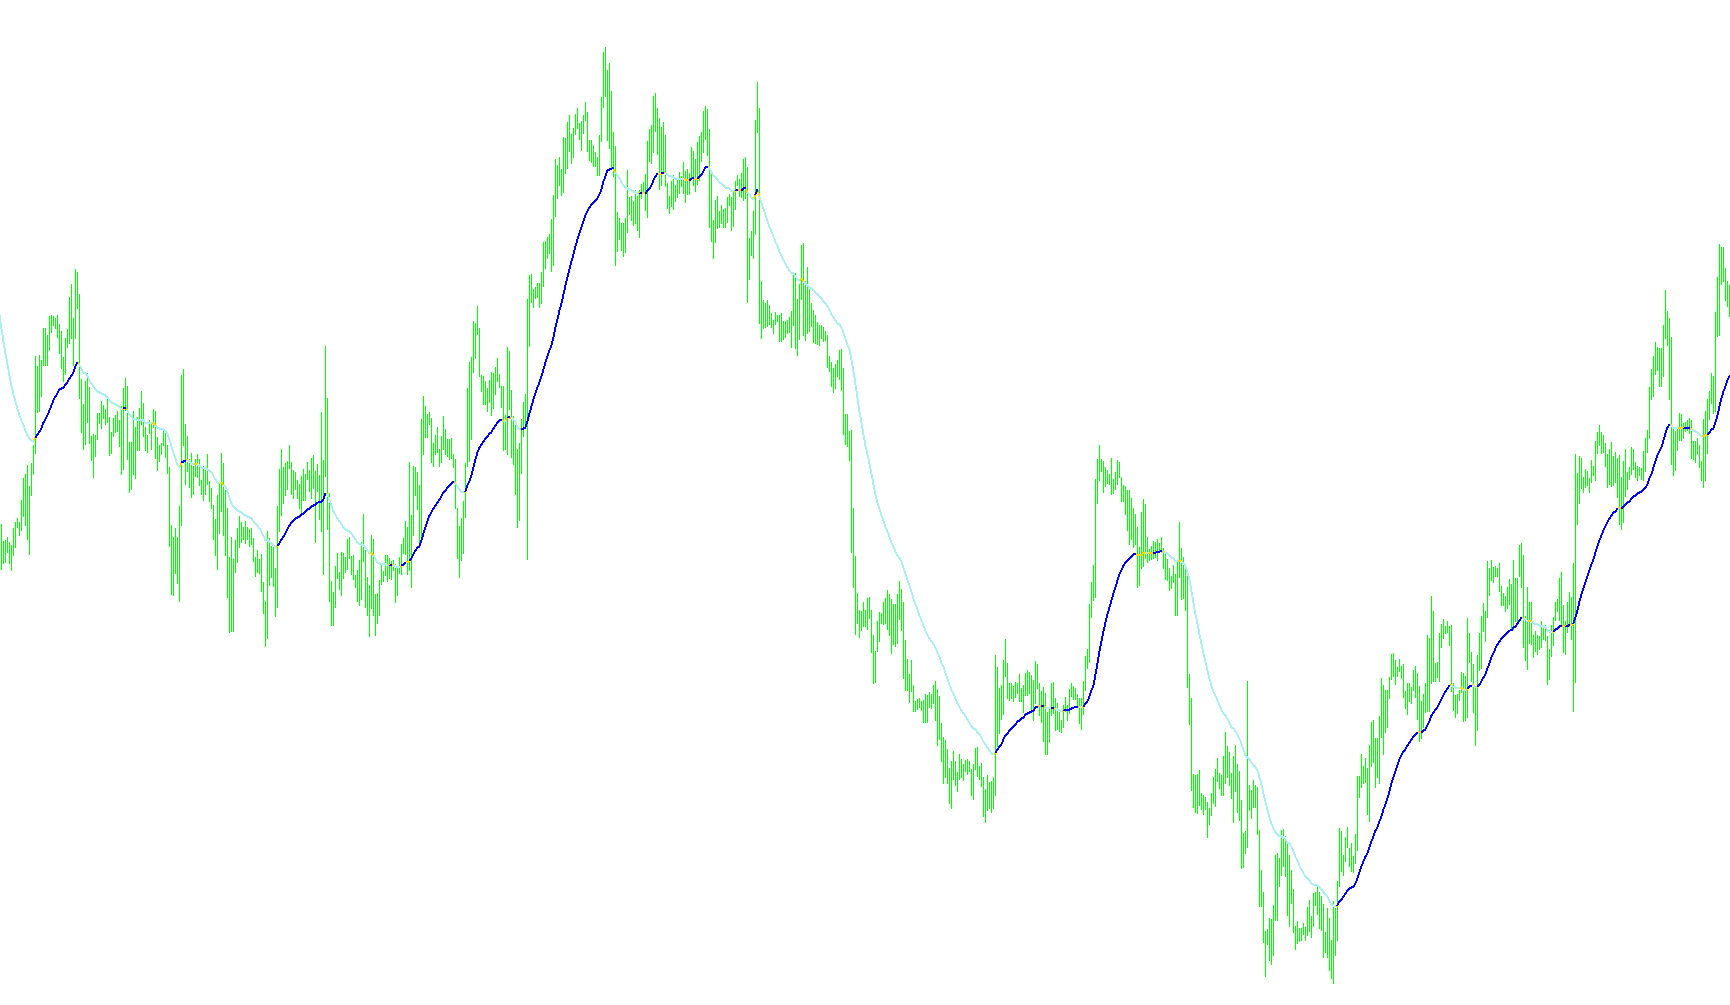
This indicator visually maps price trend dynamics by assigning distinct colors to a customizable moving average based on the direction of its instantaneous slope change.

MA in Color_001
Indicator

MA in Color_001

iMA

This indicator dynamically renders a multi-colored moving average line that shifts hue to visually signal bullish and bearish momentum transitions in real-time.

MA in Color_34
Indicator

MA in Color_34

iMA

This indicator visualizes momentum shifts by dynamically changing the color of a selected moving average based on its instantaneous directional slope.

MA in Color_Hist
Indicator

MA in Color_Hist

iMA

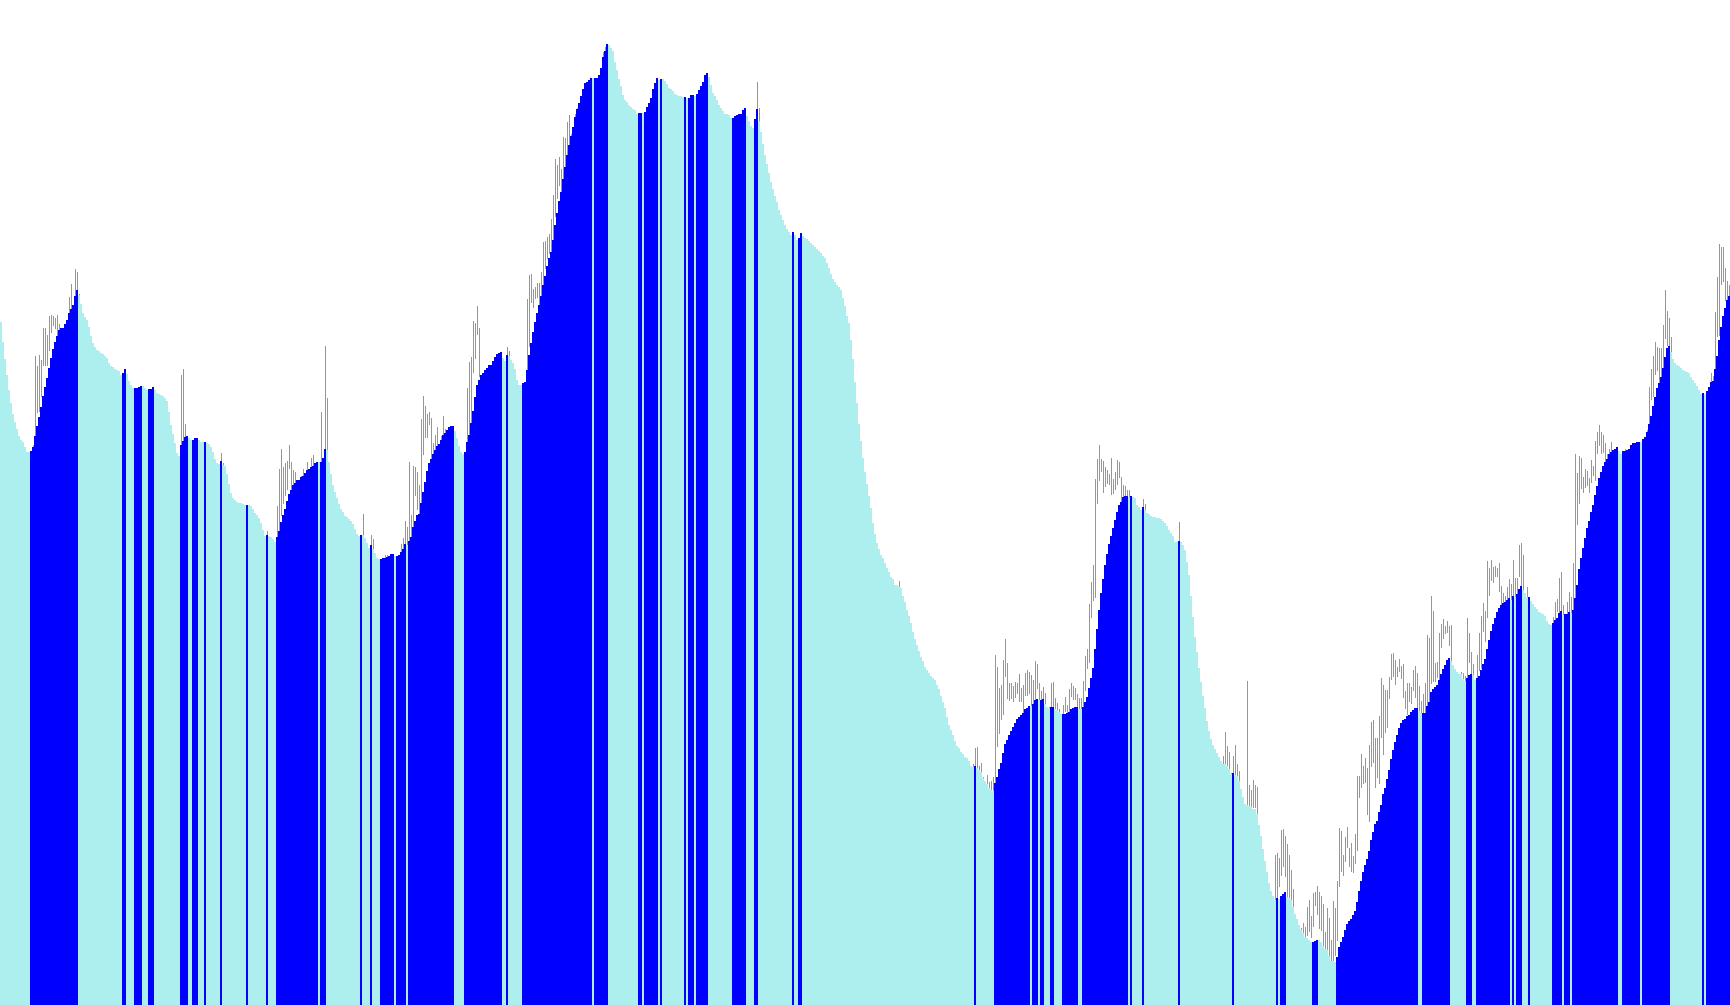
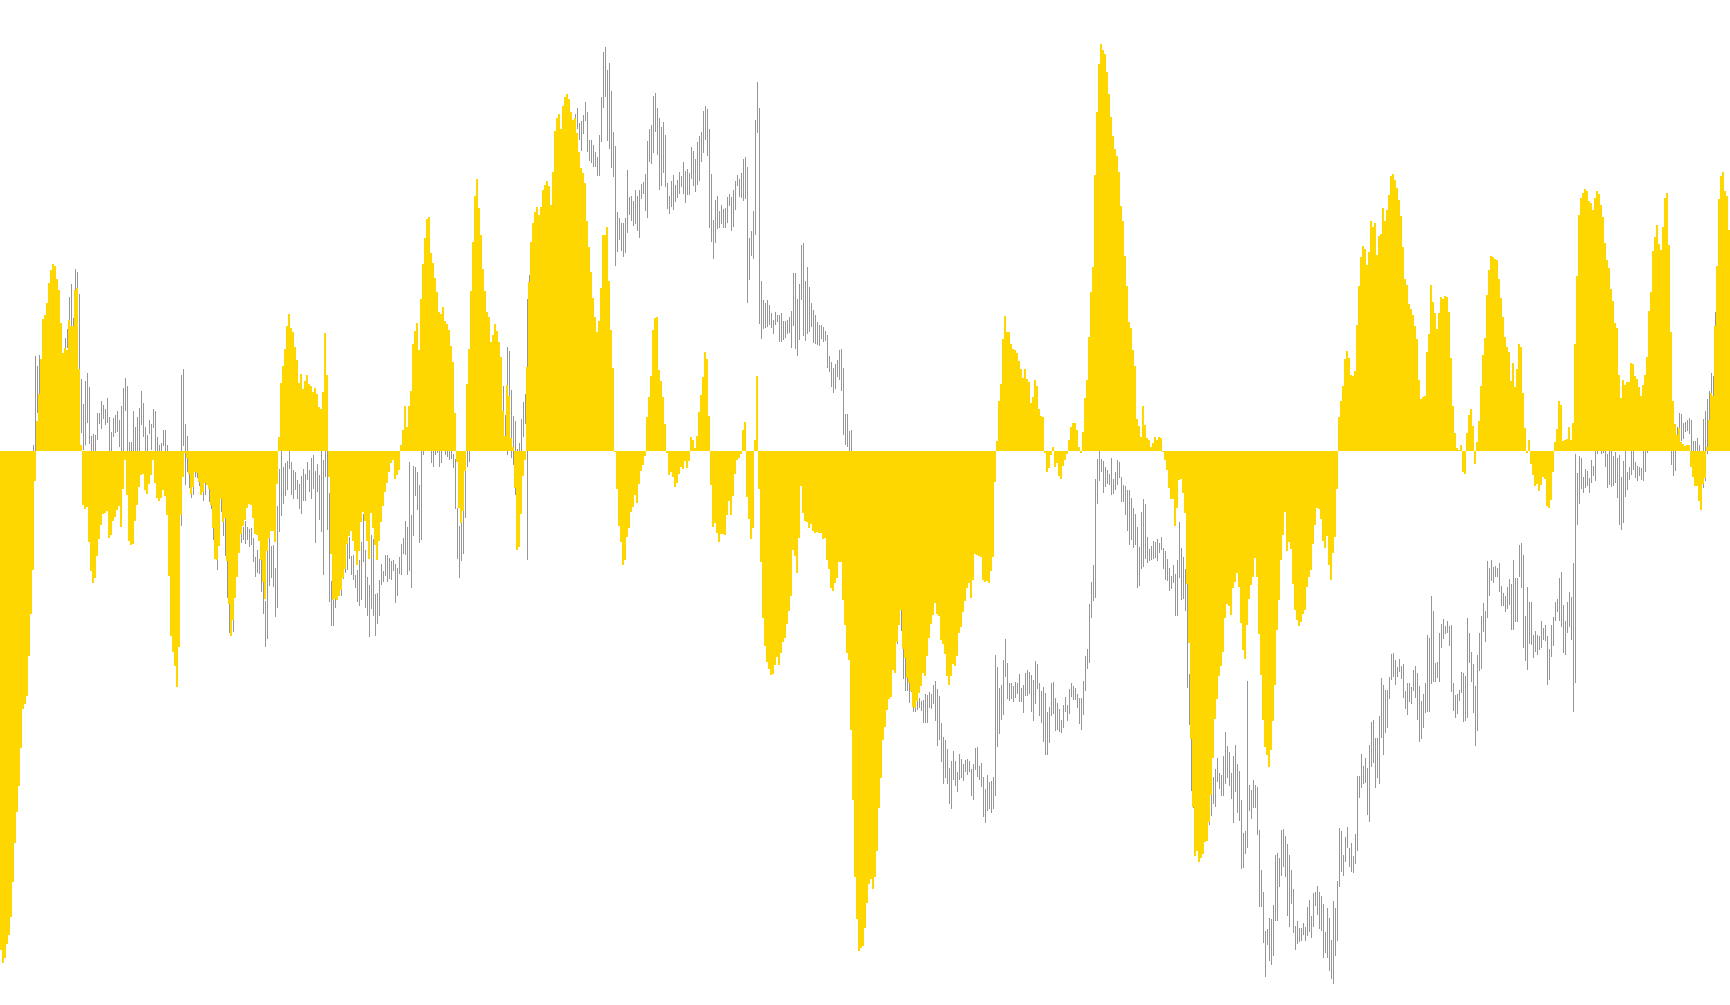
This indicator visualizes moving average trends as a color-coded histogram by comparing current price weighted averages against previous values to highlight directional shifts.

MA in Color_Hist_001
Indicator

MA in Color_Hist_001

iMA

This indicator visualizes moving average momentum by dynamically shifting histogram colors based on the slope of price velocity.

MA in Color_Separate_v2
Indicator

MA in Color_Separate_v2

iMA

This indicator visualizes trend dynamics by dynamically shifting the color of a user-defined moving average based on its immediate price velocity and directional slope.

MA in Color_t2
Indicator

MA in Color_t2

iMA

This indicator dynamically visualizes price trend direction by assigning distinct colors to various moving average types based on instantaneous slope polarity.

MA in Color_v1
Indicator

MA in Color_v1

iMA

A multi-modal moving average indicator that dynamically shifts visual colors to signal instantaneous changes in price velocity and trend direction.

MA in Color_v2
Indicator

MA in Color_v2

iMA

This indicator visualizes price momentum by dynamically shifting the color of a customizable moving average based on its instantaneous directional slope.

MA in Color_v2_001
Indicator

MA in Color_v2_001

iMA

A multi-mode moving average indicator that dynamically shifts line colors to visualize instantaneous trend velocity and momentum direction.

MA in Color_v3
Indicator

MA in Color_v3

iMA

This indicator dynamically shifts the visual color of a moving average line based on its immediate price momentum direction.

MA in Color_wAppliedPrice
Indicator

MA in Color_wAppliedPrice

iMA

This indicator dynamically shifts its visual color based on the slope of various moving averages to provide immediate directional trend orientation.

MA in Color_wAppliedPrice_v1
Indicator

MA in Color_wAppliedPrice_v1

iMA

This indicator dynamically shifts moving average line colors to visualize instantaneous momentum changes and directional pivots based on price action types.

MA in Color_wAppliedPrice_v2
Indicator

MA in Color_wAppliedPrice_v2

iMA

This indicator dynamically shifts the visual color of the moving average line based on the directional trend of its slope relative to the previous candle.

MA predictor
Indicator

MA predictor

iMA

This indicator employs a Backpropagation Neural Network to predict future price action by analyzing non-linear price relationships filtered through Fibonacci-sequence temporal delays.

MA ribbon filled mtf
Indicator

MA ribbon filled mtf

iMA

This indicator visualizes price trends by plotting dual linear weighted moving averages and rendering a filled histogram area to highlight volatility expansion and trend direction across different temporalities.

MA ribbon
Indicator

MA ribbon

iMA

The indicator identifies trend polarity by dynamically swapping the plotting order of two moving averages based on their relative crossover positions.

MA RSI Alert
Indicator

MA RSI Alert

iMAiRSI

This indicator dynamically plots a smoothed moving average line while switching between bullish and bearish visual states based on Relative Strength Index threshold breaches.

MA rsi
Indicator

MA rsi

iMAiRSI

This indicator bifurcates an Exponential Moving Average into two distinct visual streams based on the Relative Strength Index crossing a specific threshold.

MA Scan
Indicator

MA Scan

iMA

This indicator scans multiple currency pairs across various timeframes to identify bullish or bearish trend alignment based on the sequential stacking and proximity of four different Exponential Moving Averages.

ma-median
Indicator

ma-median

iMAiMAOnArray

This indicator generates a nested smoothing effect by applying successive Exponential Moving Averages to a price median base across three synchronized periods.

Indicator

MAadaptive (r2)

iMA
Indicator

MAadaptive (rsi)

iMAiRSI
Indicator

MAadaptive (rsi+r2)

iMAiRSI
Indicator

MAadaptive_(rsi+r2)_cd

iMAiRSI
Indicator

MAadaptive_(rsi+r2)_vel0

iMAiRSI
MAAngle
Indicator

MAAngle

iMA

This indicator quantifies the geometric tilt of moving averages to identify trend strength, stagnation zones, and directional velocity through specific angular thresholds.

MAAngleTony
Indicator

MAAngleTony

iMA

Identifies directional bias by calculating the rate of change between consecutive Exponential Moving Average values against a specific sensitivity threshold.

Indicator

MaBased-ZigZag

iMA
MACD + osMA
Indicator

MACD + osMA

iOsMAiMAiMAOnArray
MACD 2 Colour HISTOGRAM
Indicator

MACD 2 Colour HISTOGRAM

iMAiMAOnArray

This indicator calculates the difference between two exponential moving averages to produce a multi-colored histogram that visually distinguishes bullish and bearish momentum shifts.

MACD 3 color
Indicator

MACD 3 color

iMAiMAOnArray

This visual analytics tool categorizes MACD histogram fluctuations into three distinct color segments based on directional momentum shifts between consecutive candles.

MACD 5-34-5
Indicator

MACD 5-34-5

iMAiMAOnArray

Calculates the variance between two exponential moving averages and applies a secondary simple moving average to generate signal crossovers.

Indicator

MACD colored + mtf

iCCIiMomentumiMAiRSI
MACD colored
Indicator

MACD colored

iCCIiMomentumiMAiRSI

This indicator dynamically visualizes momentum shifts by applying a colored histogram to MACD calculations derived from multiple underlying oscillators including RSI, CCI, and Momentum.

MACD colored_002
Indicator

MACD colored_002

iCCIiMomentumiMAiRSI

This indicator analyzes market momentum by calculating moving average differentials across standard price, RSI, Momentum, and CCI inputs with an optional zero-lag smoothing algorithm.

MACD Custom
Indicator

MACD Custom

iMAiMAOnArray

Calculates the variance between two exponential moving averages and overlays a simple moving average of that variance to identify momentum shifts.

MACD Dot
Indicator

MACD Dot

iMAiMAOnArray

This indicator identifies bullish and bearish momentum shifts by detecting precise crossings between the MACD line and its signal average, marking them with visual arrows.

MACD Fix
Indicator

MACD Fix

iMAiMAOnArray

This indicator calculates the divergence between two exponential moving averages and applies a weighted 1.3x multiplier to visualize momentum shifts via dual-colored histograms.

MACD Hist
Indicator

MACD Hist

iOsMAiMAiMAOnArray
Indicator

MACD HISTO

iOsMAiMAiMAOnArray
MACD Histogram WIS
Indicator

MACD Histogram WIS

iMAiMAOnArray

This indicator quantifies market momentum by correlating MACD histogram shifts with secondary moving average filters to validate directional trends.

MACD HISTO_001
Indicator

MACD HISTO_001

iMAiMAOnArray

The algorithm identifies directional momentum by calculating the delta between a dual-EMA spread and its subsequent smoothed signal average, visualized through polarized histogram bars.

MACD Hist_v1
Indicator

MACD Hist_v1

iOsMAiMAiMAOnArray
MACD line
Indicator

MACD line

iMAiMAOnArray

Quantifies price velocity by calculating the divergence between two distinct Exponential Moving Averages and smoothing the resulting differential via a Simple Moving Average.

MACD MA Price-2
Indicator

MACD MA Price-2

iMAiMAOnArray

This indicator calculates momentum dynamics by deriving a MACD histogram from custom moving average types and generating a secondary signal line through an additional smoothing overlay.

MACD MA Price
Indicator

MACD MA Price

iMAiMAOnArray

This indicator computes the divergence between two moving averages and applies a secondary smoothing layer to generate a filtered signal line based on customizable price inputs.