MACD Non Meta bb
Indicator

MACD Non Meta bb

iMA

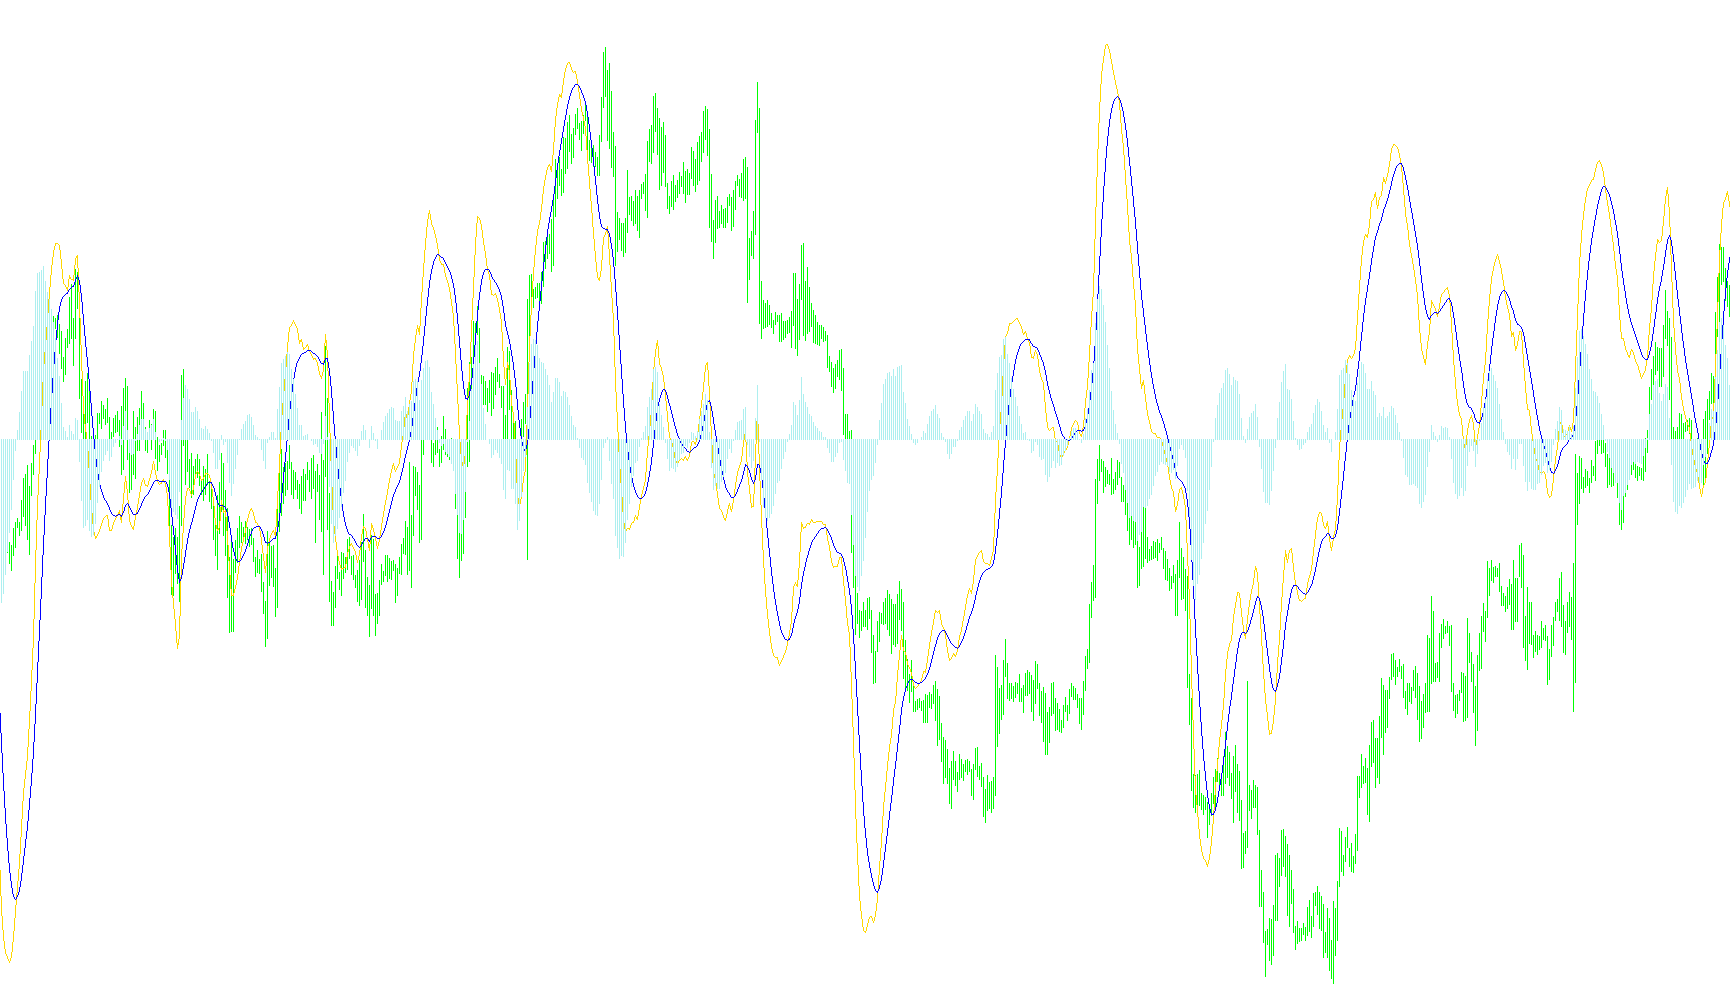
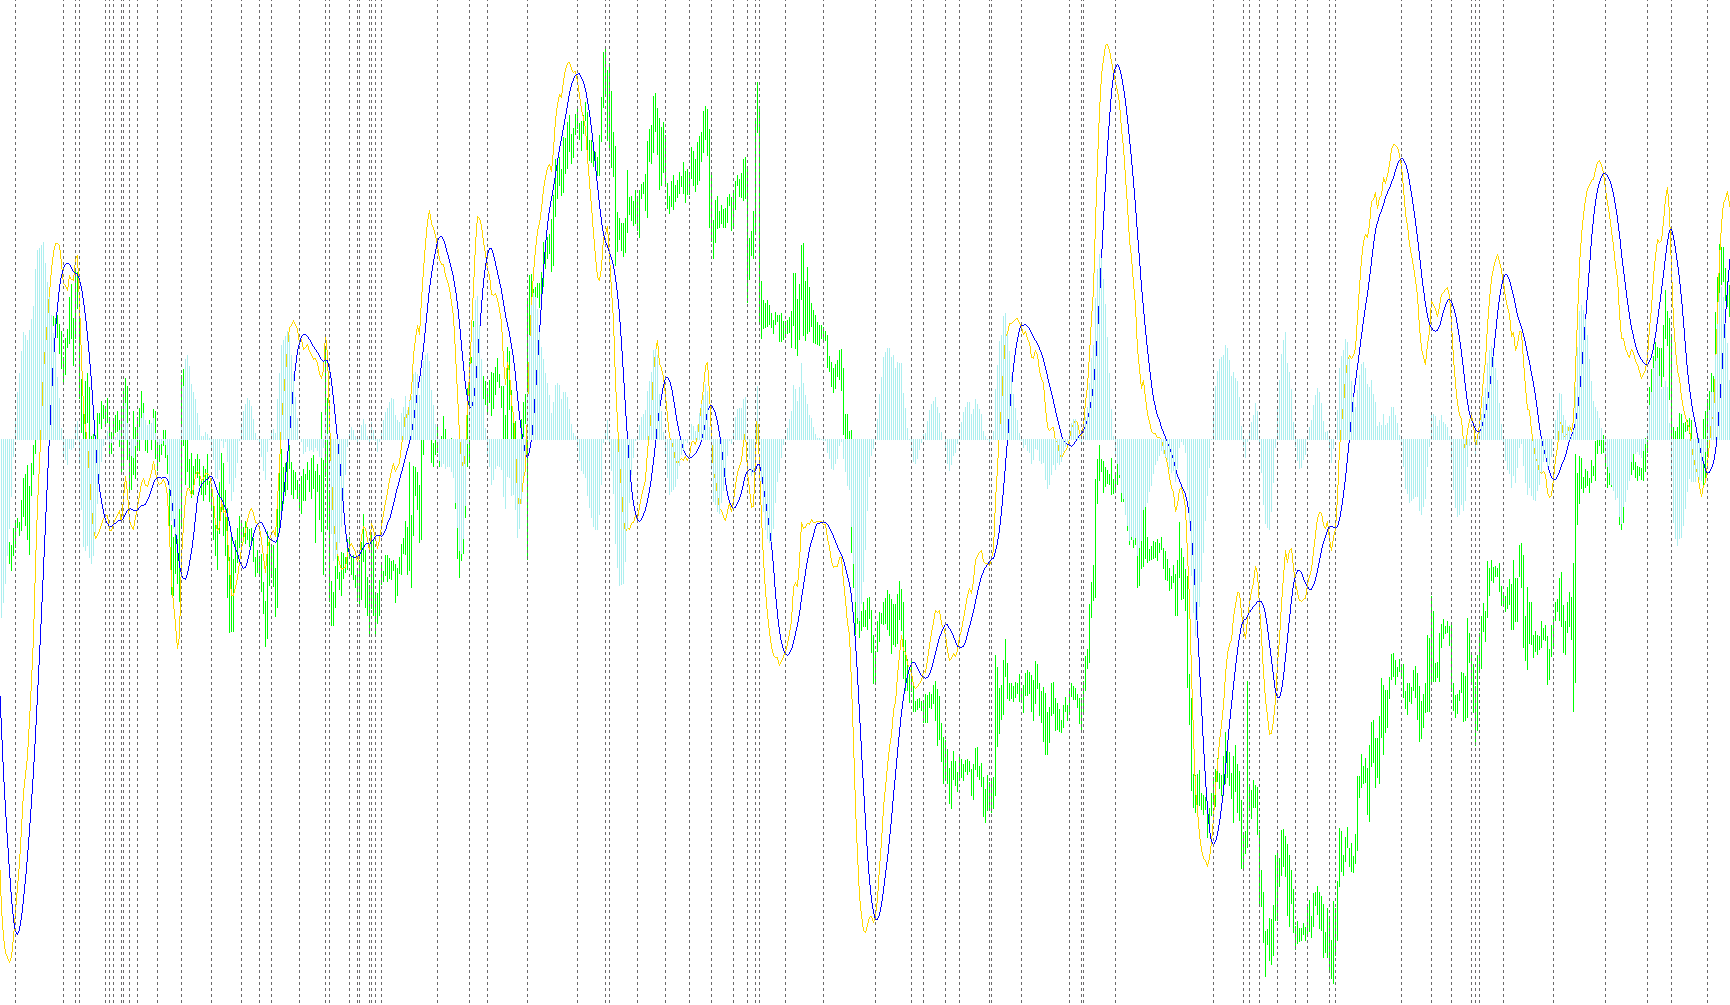
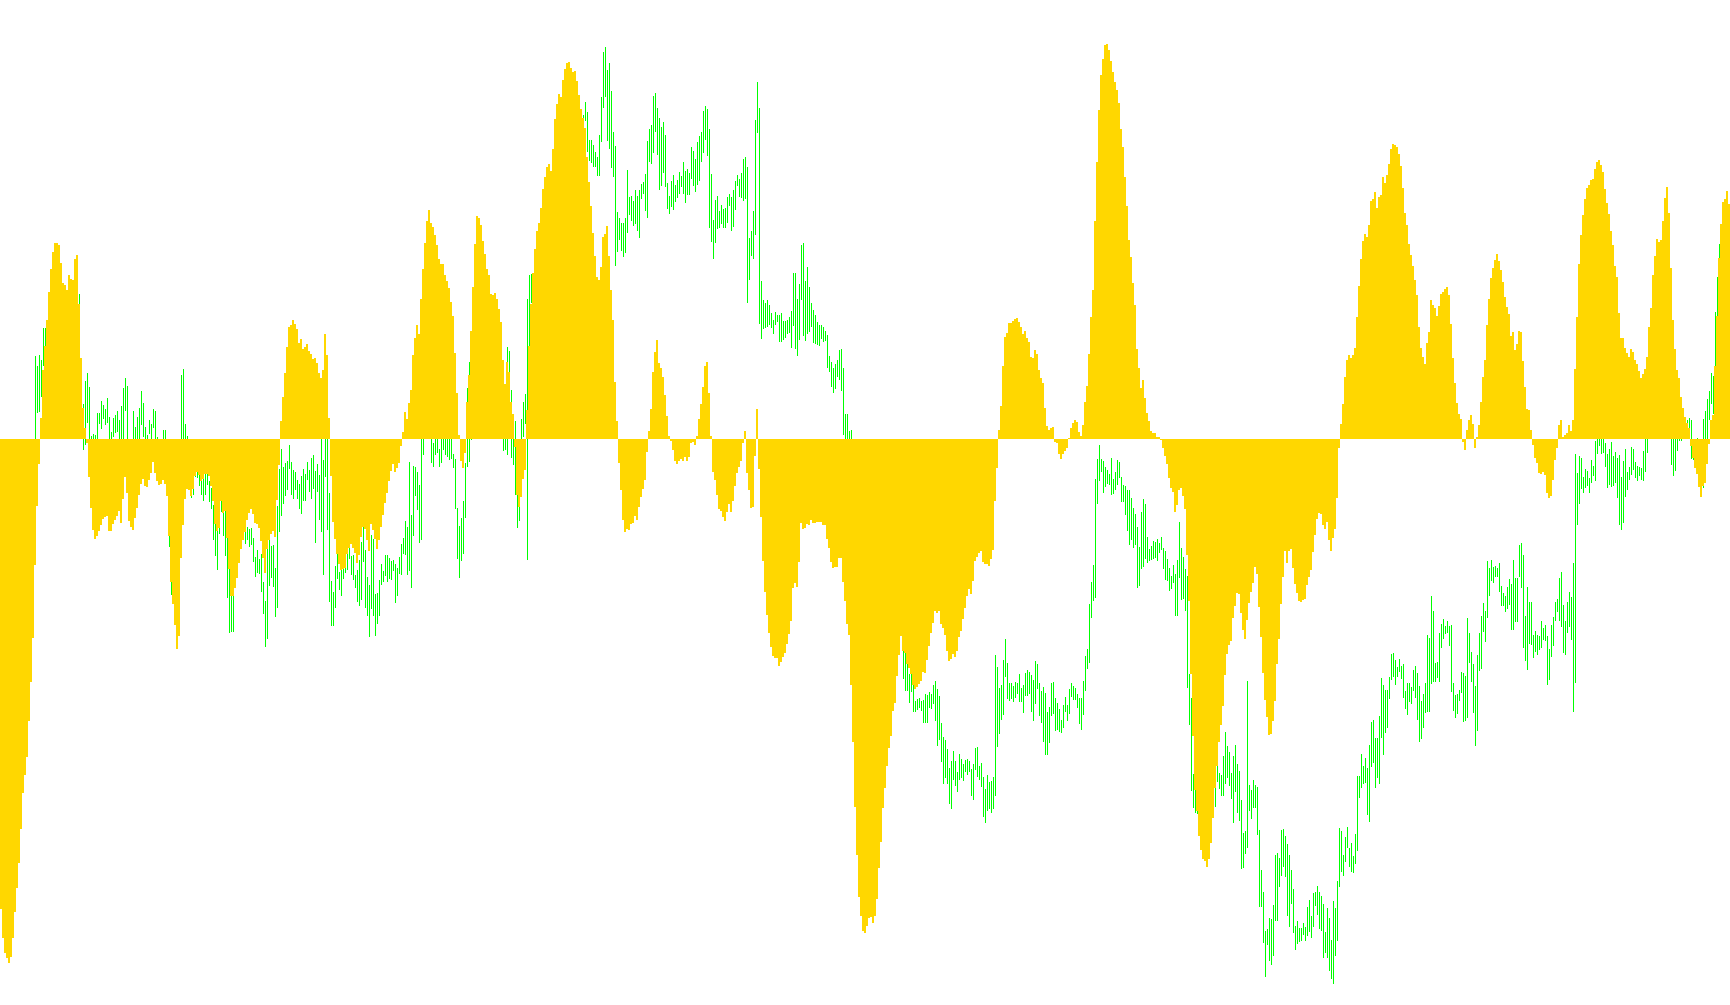
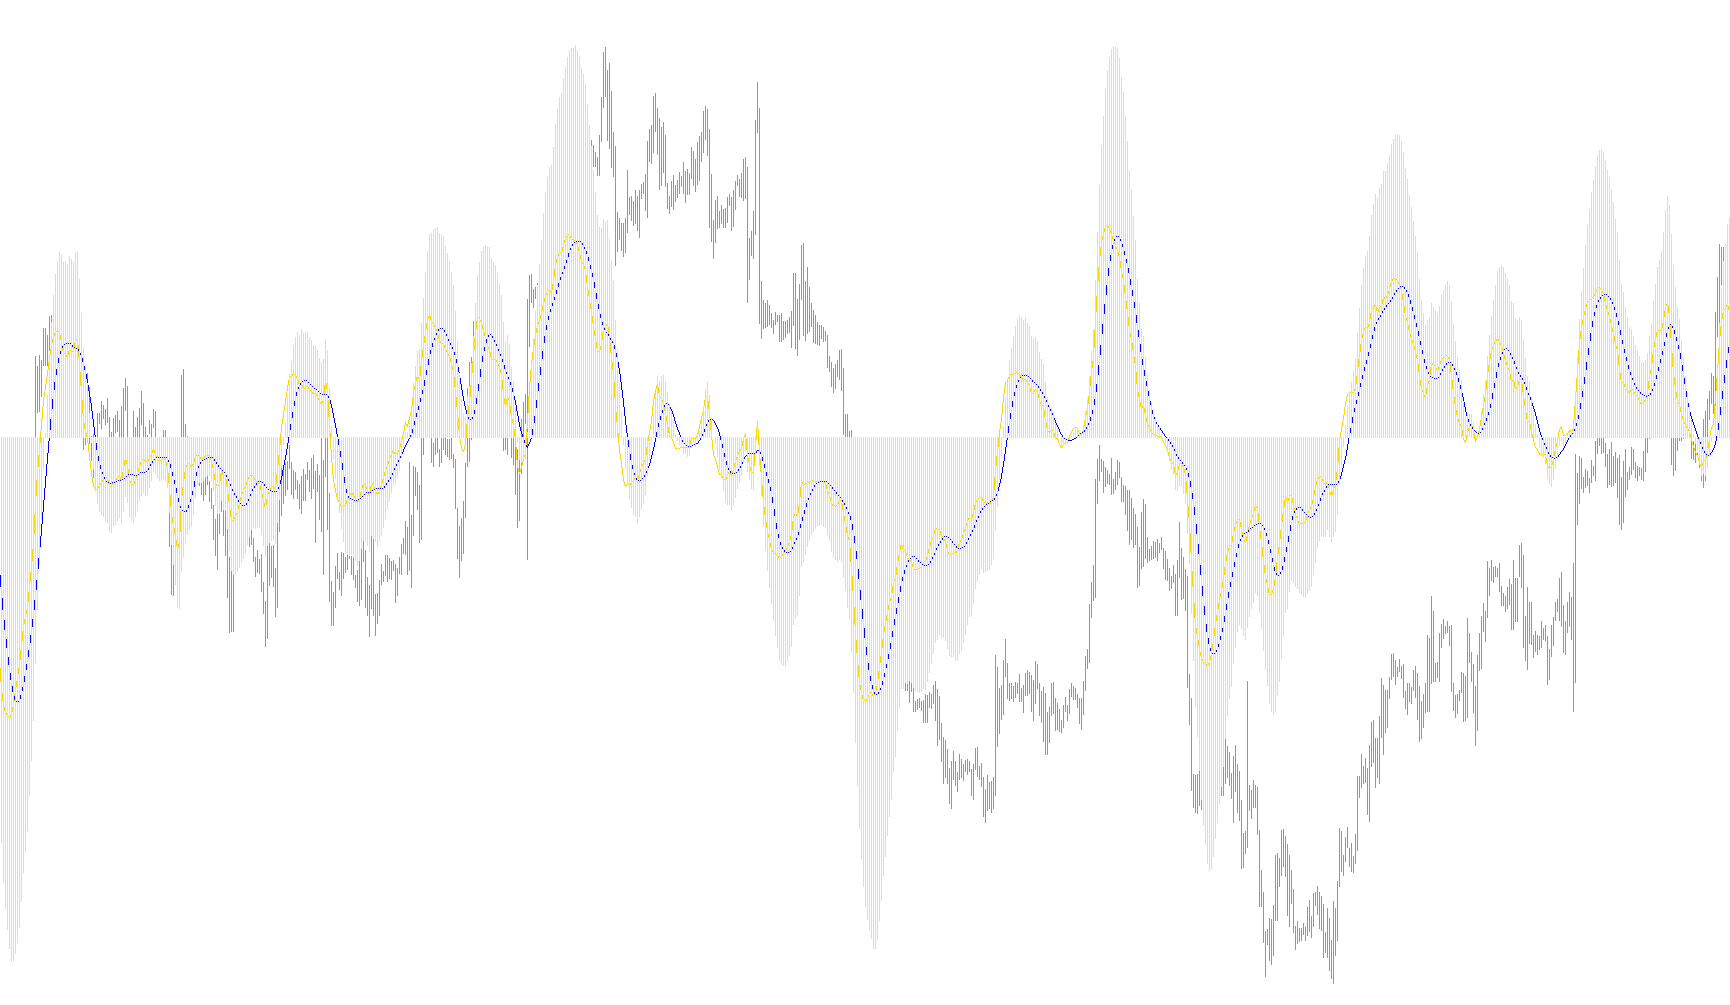
This indicator calculates the variance between two exponential moving averages to derive a momentum line, which is then smoothed by an alpha-weighted signal to visualize price velocity and trend crossovers.
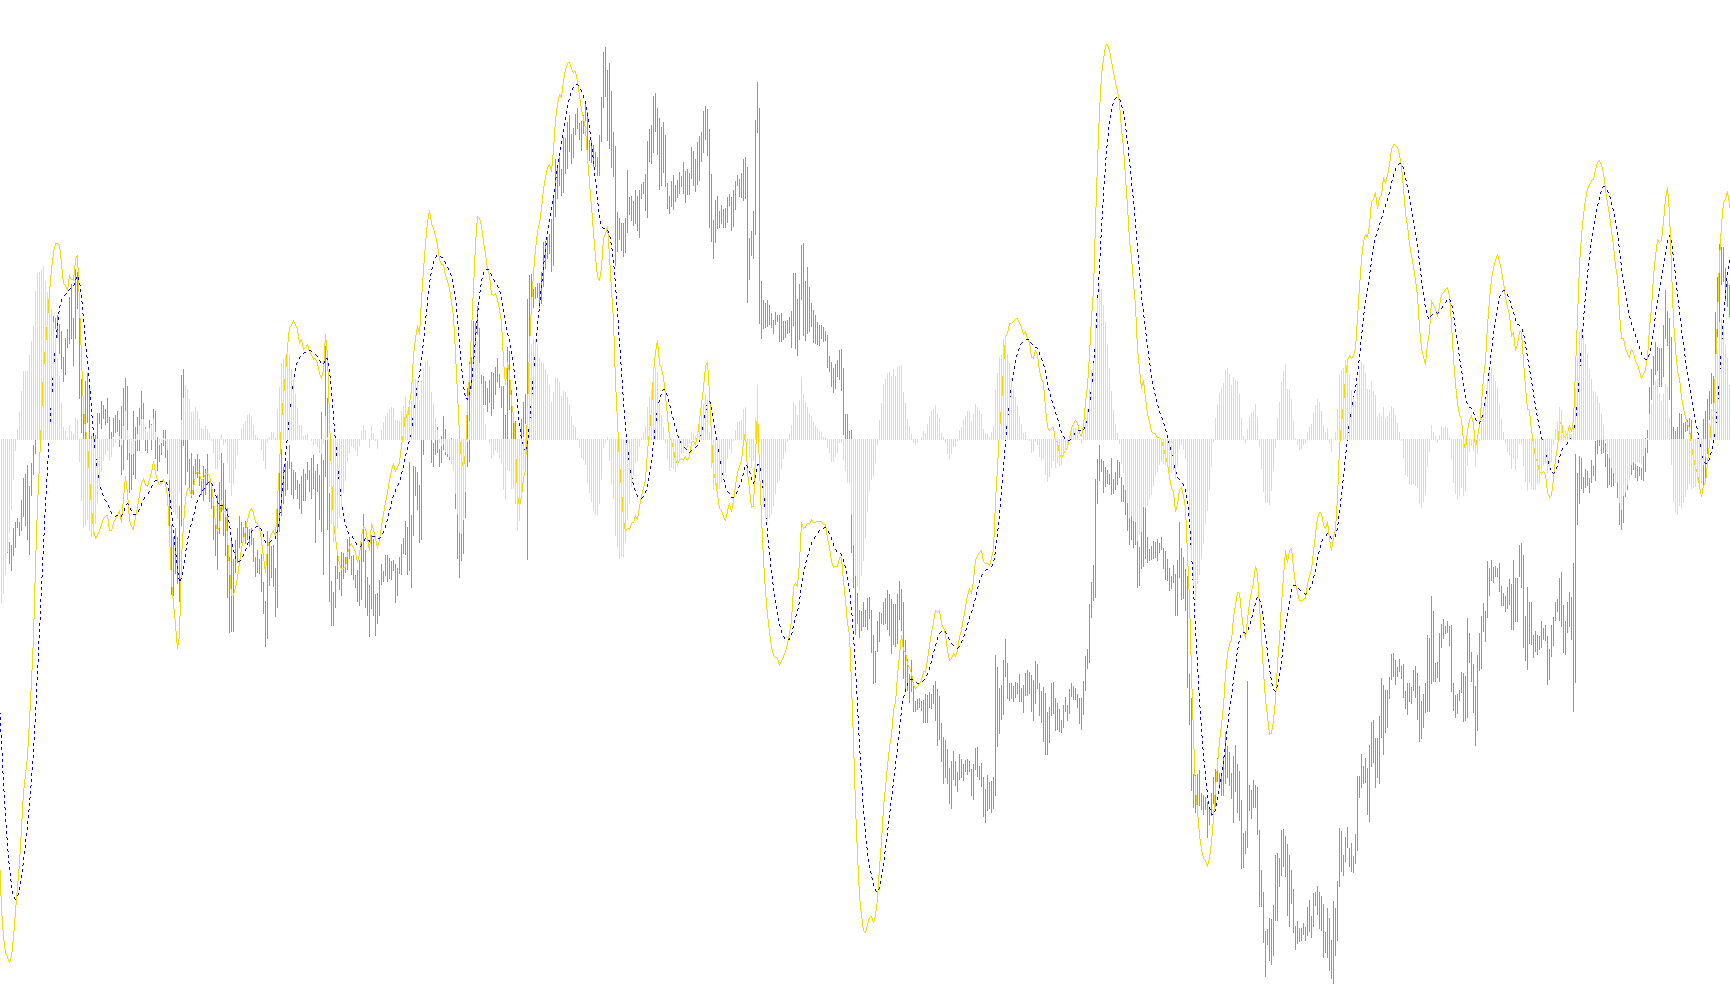
MACD trad
Indicator

MACD trad

iMAiMAOnArray

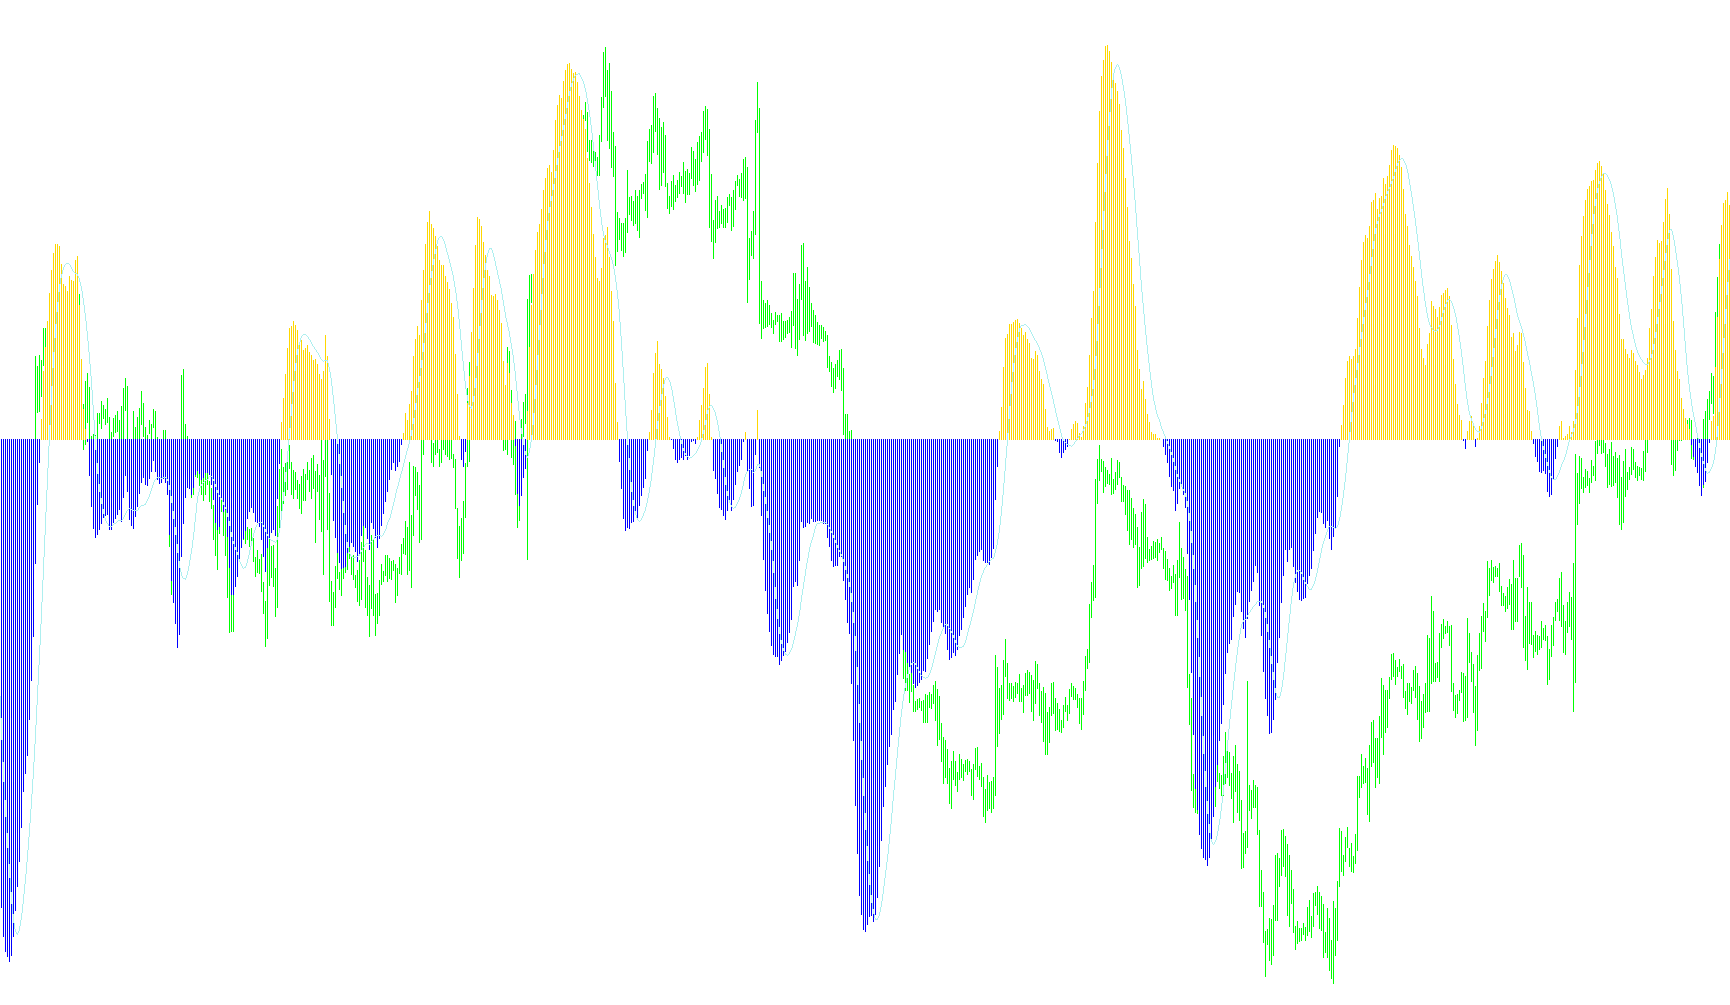
This indicator calculates the variance between two exponential moving averages and projects a secondary smoothed signal line to visualize momentum shifts through a scaled histogram.

MACD with crossing
Indicator

MACD with crossing

iMAiMAOnArray

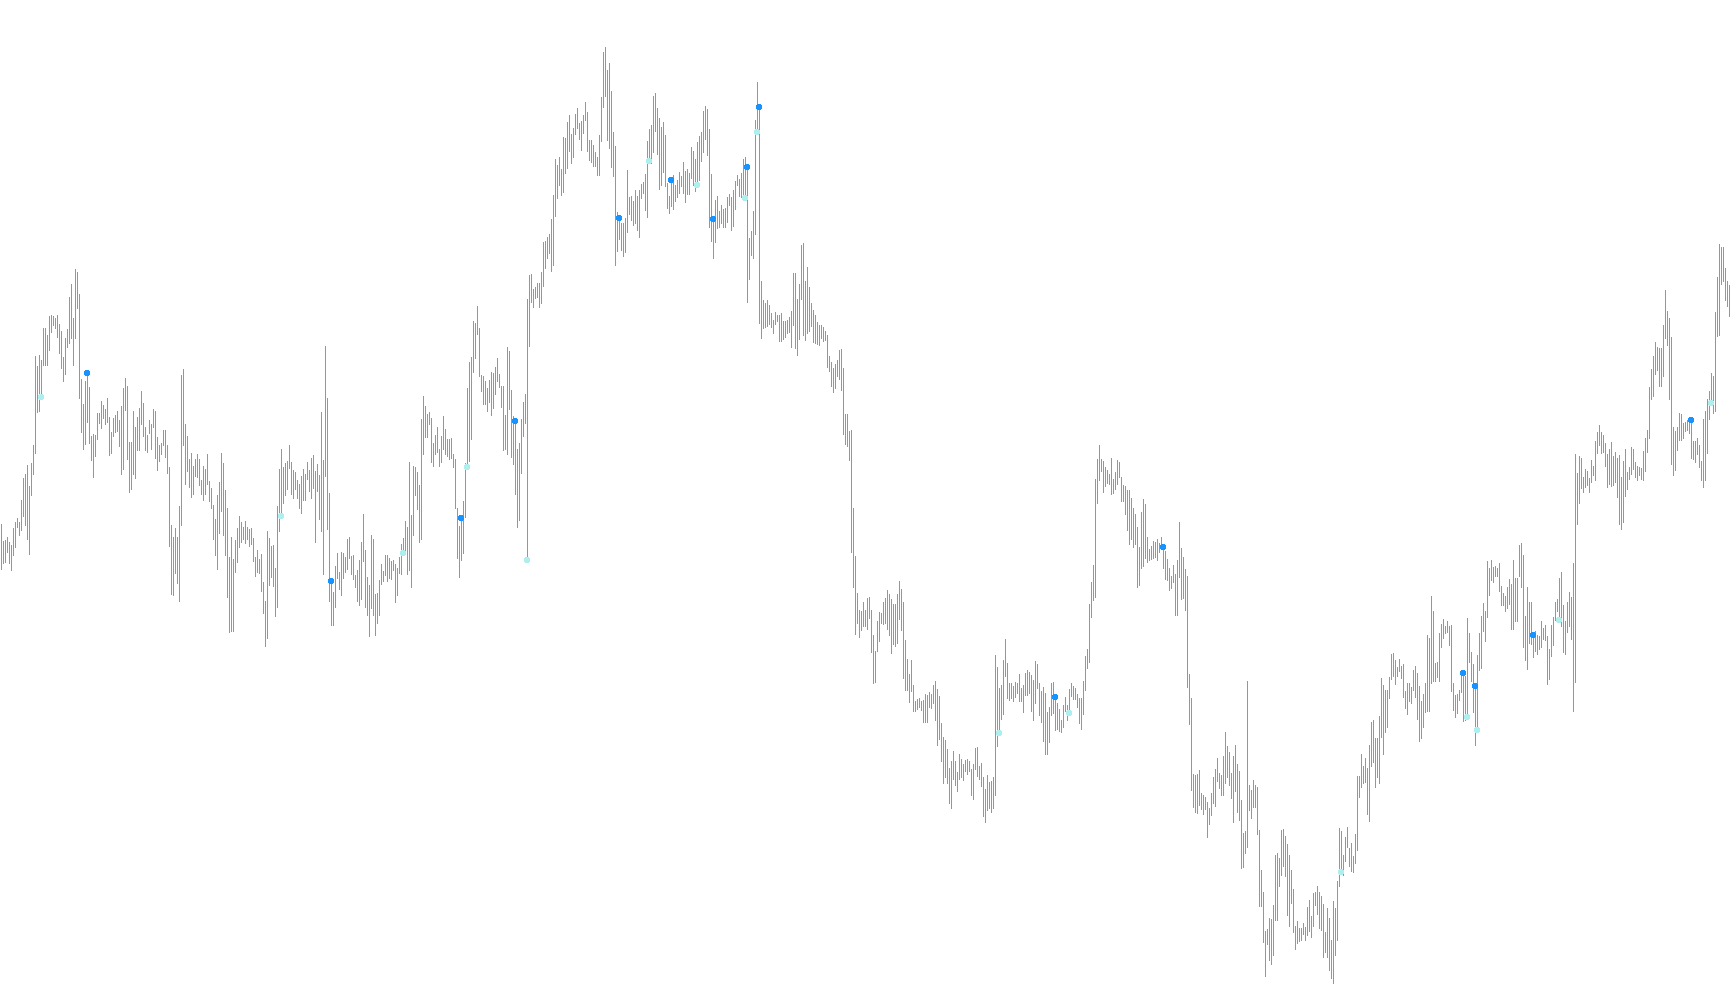
Identifies bullish and bearish reversals by plotting visual markers at the precise intersection points of the MACD line and its signal average.

MACD+MA
Indicator

MACD+MA

iMACDiMA

The indicator identifies bullish and bearish trend shifts by detecting simultaneous upward or downward price momentum across both a Moving Average and the MACD Main line.

MACD+OsMA
Indicator

MACD+OsMA

iOsMAiMAiMAOnArray
MACD+OsMA_v1
Indicator

MACD+OsMA_v1

iOsMAiMAiMAOnArray
Indicator

MacD-2 line

iMAiMAOnArray
MacD-2 line_v1
Indicator

MacD-2 line_v1

iMAiMAOnArray

This indicator calculates the divergence between two exponential moving averages to identify momentum shifts while applying a simple moving average filter to generate a trailing signal line.

Indicator

MacD-2 line_v2

iMAiMAOnArray
MACD-2
Indicator

MACD-2

iMAiMAOnArray

This indicator calculates the differential between fast and slow exponential moving averages to generate a directional momentum histogram that shifts color based on the trend's velocity change.

MACD-2_v1
Indicator

MACD-2_v1

iMAiMAOnArray

This indicator calculates the spread between two exponential moving averages and applies a secondary signal smoothing to generate amplified directional histograms.

MACD-2_v2
Indicator

MACD-2_v2

iMAiMAOnArray

This indicator calculates the spread between a fast and slow exponential moving average to generate a momentum histogram that shifts polarity based on directional velocity changes.

MACD-2_v3
Indicator

MACD-2_v3

iMAiMAOnArray

This indicator calculates the differential between exponential moving averages to project a tripled magnitude histogram that switches polarity based on trend acceleration.

MACD-2_v4
Indicator

MACD-2_v4

iMAiMAOnArray

This indicator identifies trend reversals by calculating the differential between accelerated and decelerated exponential moving averages, highlighting momentum shifts through multi-buffer histogram visualization.

MACD-Alt
Indicator

MACD-Alt

iMAiMAOnArray

This indicator calculates the differential between two exponential moving averages and overlays a simple moving average signal line to identify momentum shifts.

macd-dot
Indicator

macd-dot

iMAiMAOnArray

This indicator identifies bullish and bearish reversal points by detecting the precise moment when the MACD line crosses above or below its signal average.

macd-dot_001
Indicator

macd-dot_001

iMAiMAOnArray

This indicator identifies bullish and bearish entry points by detecting instantaneous trend reversals when the MACD line intersects its signal line.

macd-neskk
Indicator

macd-neskk

iMAiMAOnArray

This indicator synthesizes traditional MACD crossovers with secondary momentum velocity analysis to identify trend reversals and strength shifts.

MACD-OsMA(AM).3
Indicator

MACD-OsMA(AM).3

iMAiMAOnArray

This indicator identifies trend transitions by visualizing the directional momentum of both the raw MACD line and its signal variance through comparative histogram peaks.

MACD-Silver
Indicator

MACD-Silver

iMA

This indicator visualizes the differential between two exponential moving averages as a dynamic histogram that switches colors based on consecutive value thresholds.

MACD
Indicator

MACD

iMAiMAOnArray

This indicator calculates the instantaneous difference between two exponential moving averages and overlays a smoothed simple moving average signal line to identify trend shifts.

macdchannels
Indicator

macdchannels

iMA

This indicator synthesizes three distinct moving average types to calculate a weighted composite mean of price momentum and trend direction.

macdHelp
Indicator

macdHelp

iOsMAiMAiMAOnArray
MACDmVersion2_MOD
Indicator

MACDmVersion2_MOD

iMAiMAOnArray

This indicator calculates the differential between two exponential moving averages and overlays a smoothed signal line with color-coded histogram bars to visualize bullish and bearish momentum shifts.

MACDonRSI
Indicator

MACDonRSI

iMAiMAOnArrayiRSIOnArray

This indicator computes a derivative momentum signal by applying an RSI calculation onto a smoothed Moving Average, followed by a MACD-style difference of dual EMAs.

MACDsignals
Indicator

MACDsignals

iMAiMAOnArray

This indicator identifies trend reversal points by analyzing specific multi-bar price velocity changes and relative momentum shifts within the MACD histogram.

MACDsignalsv0.2
Indicator

MACDsignalsv0.2

iMAiMAOnArray

This indicator identifies bullish and bearish reversals by analyzing specific geometric shifts in MACD histogram velocity relative to multi-bar price action volatility.

MACDTrad
Indicator

MACDTrad

iMAiMAOnArray

This technical indicator quantifies the variance between two exponential moving averages to visualize trend velocity through a dual-line crossover and a dynamic differential histogram.

MACDTrad2
Indicator

MACDTrad2

iMAiMAOnArray

This indicator calculates the variance between fast and slow exponential moving averages, applies a simple moving average to derive a signal line, and constructs a custom histogram by weighting the momentum gap against current price action.

MACDTrad3%21
Indicator

MACDTrad3%21

iMAiMAOnArray

This indicator calculates momentum by blending price-adjusted exponential moving averages with a multi-layered SMA smoothing of the signal and histogram components.

MACDTrad3(1)
Indicator

MACDTrad3(1)

iMAiMAOnArray

This script calculates a modified MACD by augmenting the price action with exponential moving average differentials and secondary smoothed momentum filters.

MACDTrad4%21
Indicator

MACDTrad4%21

iMAiMAOnArray

This indicator calculates the variance between two exponential moving averages and overlays a simple moving average signal to visualize price velocity and trend momentum via a dynamic histogram.

MACDTrad4(1)
Indicator

MACDTrad4(1)

iMAiMAOnArray

This indicator calculates the differential between two exponential moving averages to derive a momentum line, complemented by a smoothed signal average and an additive histogram.

MACDTradCh(1)
Indicator

MACDTradCh(1)

iMAiMAOnArray

This indicator calculates the spread between fast and slow exponential moving averages, further modified by integrating a smoothed signal line and the current closing price into the histogram calculation.

MACDTradeSignals
Indicator

MACDTradeSignals

iMAiMAOnArray

This indicator generates multi-stage trade signals by identifying zero-line crossovers and dynamic signal line divergences using a smoothed Moving Average Convergence Divergence algorithm.

MACD^RSI
Indicator

MACD^RSI

iMAiMAOnArray

This indicator synthesizes MACD momentum trends with a smoothed Relative Strength Index calculated over the divergence values to identify price velocity and exhaustion.

MACD_2
Indicator

MACD_2

iMAiMAOnArray

This indicator calculates the differential between two exponential moving averages and overlays a simple moving average signal line to visualize bullish and bearish momentum shifts.

MACD_2_Color_HISTORAM
Indicator

MACD_2_Color_HISTORAM

iMAiMAOnArray

This indicator visualizes the MACD line relative to its signal average using a bicolored histogram to distinguish between positive and negative momentum shifts.

MACD_3_DEMA
Indicator

MACD_3_DEMA

iMA

This indicator calculates the divergence between two fast Double Exponential Moving Averages and a slow baseline to visualize trend velocity and crossovers through color-coded histograms.

MACD_3_DEMA_v101
Indicator

MACD_3_DEMA_v101

iMA

This indicator visualizes price momentum by calculating the spread between dual Double Exponential Moving Averages and a tertiary slow base, utilizing multi-colored histograms to signify velocity shifts and trend polarity.

MACD_4
Indicator

MACD_4

iMA

This indicator quantifies price velocity by calculating the divergence between two Exponential Moving Averages and generating a smoothed signal line to identify trend exhaustion and momentum shifts.

MACD_4ColorHist_2L_SEAlert
Indicator

MACD_4ColorHist_2L_SEAlert

iMAiMAOnArray

This indicator visualizes momentum via a multi-colored histogram that shifts hue based on trend direction and velocity, while providing real-time notifications for zero-line crossovers, signal line intersections, and directional slope changes.

MACD_4CZ
Indicator

MACD_4CZ

iMA

This indicator visualizes the MACD momentum by utilizing four distinct color buffers to represent directional velocity shifts and historical magnitude comparisons relative to the zero line.

MACD_4_v1
Indicator

MACD_4_v1

iMAiMAOnArray

This indicator calculates the divergence between two exponential moving averages and generates a smoothed signal line to visualize momentum velocity through a histogram.

MACD_4_v1_v1
Indicator

MACD_4_v1_v1

iMAiMAOnArray

This indicator calculates the delta between two exponential moving averages to identify trend velocity and signal momentum shifts through a smoothed histogram.

MACD_4_v2
Indicator

MACD_4_v2

iMA

Calculates the difference between two exponential moving averages to derive a momentum line, which is then smoothed into a signal baseline and histogram for trend velocity analysis.

MACD_AK
Indicator

MACD_AK

iMAiMAOnArray

This indicator filters standard MACD values by identifying specific acceleration phases where the rate of change in moving averages confirms directional momentum.

MACD_alpha
Indicator

MACD_alpha

iMA

This indicator calculates a dynamic momentum oscillator by determining the variance between dual Exponential Moving Averages and smoothing that differential with an alpha-weighted recursive filter.

macd_and_volumes
Indicator

macd_and_volumes

iMAiMAOnArray

This indicator synthesizes exponential moving average differences with normalized transaction intensity to visualize price momentum alongside relative liquidity flows.

MACD_basic
Indicator

MACD_basic

iMAiMAOnArray

This indicator identifies structural market shifts by simultaneously plotting trendline divergences between price action highs/lows and MACD momentum values.